- Products
- Learn
- Local User Groups
- Partners
- More

This website uses Cookies. Click Accept to agree to our website's cookie use as described in our Privacy Policy. Click Preferences to customize your cookie settings.
- Products
- Learn
- Local User Groups
- Upcoming Events
- Americas
- EMEA
- Czech Republic and Slovakia
- Denmark
- Netherlands
- Germany
- Sweden
- United Kingdom and Ireland
- France
- Spain
- Norway
- Ukraine
- Baltics and Finland
- Greece
- Portugal
- Austria
- Kazakhstan and CIS
- Switzerland
- Romania
- Turkey
- Belarus
- Belgium & Luxembourg
- Russia
- Poland
- Georgia
- DACH - Germany, Austria and Switzerland
- Iberia
- Africa
- Adriatics Region
- Eastern Africa
- Israel
- Nordics
- Middle East and Africa
- Balkans
- Italy
- Bulgaria
- Cyprus
- APAC
- Partners
- More
- ABOUT CHECKMATES & FAQ
- Sign In
- Leaderboard
- Events
On-Premise SD-WAN Management
Register HereWhat's New in R82.10?
Watch Here AI Security Masters E8:
Claude Mythos: New Era in Cyber Security
CheckMates Go:
The Moment Before
Turn on suggestions
Auto-suggest helps you quickly narrow down your search results by suggesting possible matches as you type.
Showing results for
- CheckMates
- :
- Products
- :
- General Topics
- :
- Issue on the sync interface
Options
- Subscribe to RSS Feed
- Mark Topic as New
- Mark Topic as Read
- Float this Topic for Current User
- Bookmark
- Subscribe
- Mute
- Printer Friendly Page
Turn on suggestions
Auto-suggest helps you quickly narrow down your search results by suggesting possible matches as you type.
Showing results for
Are you a member of CheckMates?
×
Sign in with your Check Point UserCenter/PartnerMap account to access more great content and get a chance to win some Apple AirPods! If you don't have an account, create one now for free!
- Mark as New
- Bookmark
- Subscribe
- Mute
- Subscribe to RSS Feed
- Permalink
- Report Inappropriate Content
Jump to solution
Issue on the sync interface
Hi guys!
Currently, I have one ticket opened in TAC for this case, but till now nothing...
Therefore I decided hear others opinions for while.hahah
The issue is that, my customer have a cluster 80.10 (appliance model 5800 in HA mode), where the syncronization interface between the members is through cable.
Everyday the sync interface flapping and the member 2 (in Standby) try to assume the Active state of the cluster. (in a random time of the day). And in most of the time, some VPNs falling down in same minute.
In the /var/log/messages I get always the same log strcture:
"
Sep 27 13:37:10 2018 fw02 kernel: [fw4_1];fwha_report_id_problem_status: Try to update state to DOWN due to pnote Interface Active Check (desc eth8 interface is down, 8 interfaces required, only 7 up)
Sep 27 13:37:10 2018 fw02 kernel: [fw4_1];FW-1: fwha_set_new_local_state: Setting state of fwha_local_id(1) to DOWN
Sep 27 13:37:10 2018 fw02 kernel: [fw4_1];FW-1: fwha_update_local_state: Local machine state changed to DOWN
Sep 27 13:37:10 2018 fw02 kernel: [fw4_1];fwha_state_change_implied: Try to update state to ACTIVE because member is down (the change may not be allowed).
Sep 27 13:37:11 2018 fw02 kernel: [fw4_1];check_other_machine_activity: Update state of member id 0 to DEAD, didn't hear from it since 2021025.4 and now 2021028.4
Sep 27 13:37:11 2018 fw02 kernel: [fw4_1];fwha_set_backup_mode: Try to update local state to ACTIVE because of ID 0 is not ACTIVE or READY. (This attempt may be blocked by other machines)
Sep 27 13:37:11 2018 fw02 kernel: [fw4_1];FW-1: fwha_set_new_local_state: Setting state of fwha_local_id(1) to READY
Sep 27 13:37:11 2018 fw02 kernel: [fw4_1];FW-1: fwha_update_local_state: Local machine state changed to READY
Sep 27 13:37:11 2018 fw02 kernel: [fw4_1];FW-1: fwha_update_state: ID 0 (state ACTIVE -> DOWN) (time 2021028.4)
Sep 27 13:37:11 2018 fw02 kernel: [fw4_1]; member 0 is down
Sep 27 13:37:11 2018 fw02 kernel: [fw4_1];FW-1: fwha_state_change_implied: Try to update local state from READY to ACTIVE because all other machines confirmed my READY state
Sep 27 13:37:11 2018 fw02 kernel: [fw4_1];FW-1: fwha_set_new_local_state: Setting state of fwha_local_id(1) to ACTIVE
Sep 27 13:37:11 2018 fw02 kernel: [fw4_1];FW-1: fwha_update_local_state: Local machine state changed to ACTIVE
Sep 27 13:37:12 2018 fw02 kernel: [fw4_1];fwha_report_id_problem_status: Try to update state to ACTIVE due to pnote Interface Active Check (desc <NULL>)
Sep 27 13:37:12 2018 fw02 kernel: [fw4_1];FW-1: fwha_process_state_msg: Update state of member id 0 to ACTIVE due to the member report message
Sep 27 13:37:12 2018 fw02 kernel: [fw4_1];fwha_set_backup_mode: Try to update local state to STANDBY because of ID 0 is ACTIVE or READY and with higher priority
Sep 27 13:37:12 2018 fw02 kernel: [fw4_1];FW-1: fwha_set_new_local_state: Setting state of fwha_local_id(1) to STANDBY
Sep 27 13:37:12 2018 fw02 kernel: [fw4_1];FW-1: fwha_update_local_state: Local machine state changed to STANDBY
Sep 27 13:37:12 2018 fw02 kernel: [fw4_1];FW-1: fwha_update_state: ID 0 (state DOWN -> ACTIVE) (time 2021029.5)
"
Have someone any idea what can cause this behavior?
OBS: Until now, I did some configurations, like:
- Updated the jumbo_hotfix to take 121;
- Altered the syncronization interface from SYNC to ETH8;
- Switched the cable that connected the members of cluster;
- Changed the CCP mode from multicast to broadcast.
Thanks in advance!
1 Solution
Accepted Solutions
- Mark as New
- Bookmark
- Subscribe
- Mute
- Subscribe to RSS Feed
- Permalink
- Report Inappropriate Content
Hello friends!
Great news!
After changing the kernel parameter, the flaps did not happen anymore.
Note: To survive a boot, I put the new configuration in the fwkern.conf file:
fwha_timer_cpha_res=2
Thanks everyone for the help, especially Timothy Hall
35 Replies
- Mark as New
- Bookmark
- Subscribe
- Mute
- Subscribe to RSS Feed
- Permalink
- Report Inappropriate Content
Perhaps I am missing something: can you point me to the indicator that shows Sync interface state change?
- Mark as New
- Bookmark
- Subscribe
- Mute
- Subscribe to RSS Feed
- Permalink
- Report Inappropriate Content
Hi Vladimir,
I put in bold the line (:
- Mark as New
- Bookmark
- Subscribe
- Mute
- Subscribe to RSS Feed
- Permalink
- Report Inappropriate Content
Not sure if this could be the issue, but is there a chance that there is a network in your infrastructure that conflicts with the IPs assigned to the Sync?
Is there a chance that there is a VPN recently setup with conflicting encryption domain?
- Mark as New
- Bookmark
- Subscribe
- Mute
- Subscribe to RSS Feed
- Permalink
- Report Inappropriate Content
Q: But is there a chance that there is a network in your infrastructure that conflicts with the IPs assigned to the Sync?
A: No Vlad, the infra's guy reserved one network /30 for sync interface.
Q:Is there a chance that there is a VPN recently setup with conflicting encryption domain?
A: I think no, because theses VPN's are old, but I will confirm with my customer.
Thanks.
- Mark as New
- Bookmark
- Subscribe
- Mute
- Subscribe to RSS Feed
- Permalink
- Report Inappropriate Content
Did you see Danny's post https://community.checkpoint.com/thread/9624-clusterxl-improved-stability-hotfix
Also try switching sync to a different interface of that's an option to rule out some HW issues.
- Mark as New
- Bookmark
- Subscribe
- Mute
- Subscribe to RSS Feed
- Permalink
- Report Inappropriate Content
Hi Kaspars,
I will take a look in Danny's post, thank you.
And about the interface, I already did this, switched from interface called SYNC to ETH8
- Mark as New
- Bookmark
- Subscribe
- Mute
- Subscribe to RSS Feed
- Permalink
- Report Inappropriate Content
Did the Hotfix help solve your issue?
- Mark as New
- Bookmark
- Subscribe
- Mute
- Subscribe to RSS Feed
- Permalink
- Report Inappropriate Content
Hi Danny!
I don't install the hotfix yet (I need to schedule some window with my customer for this).
Thanks.
- Mark as New
- Bookmark
- Subscribe
- Mute
- Subscribe to RSS Feed
- Permalink
- Report Inappropriate Content
Hi Danny!
Yesterday We try to install the fix (over jumbo take 142), but no success!
When the fix was installed on a member, the HA module stop work it.
When I ran the cphastart command, this message show up:
cphastart: symbol lookup error: cphastart: undefined symbol: get_cluster_interfaces
Even if I try through cpconfig, the module don't start.
I was thinking in install the jumbo take 151, cause the fix is already include on this.
Any idea about this problem?
- Mark as New
- Bookmark
- Subscribe
- Mute
- Subscribe to RSS Feed
- Permalink
- Report Inappropriate Content
Try disable sync in service dns.
- Mark as New
- Bookmark
- Subscribe
- Mute
- Subscribe to RSS Feed
- Permalink
- Report Inappropriate Content
Hi Jesus!
Sorry, I don't understand the answer...
How could I do this?
- Mark as New
- Bookmark
- Subscribe
- Mute
- Subscribe to RSS Feed
- Permalink
- Report Inappropriate Content
###UPDATE###
Yesterday we installed the newest Jumbo (take_151 ongoing version and with the ClusterXL Improved Stability Hotfix already included ) with success on both members, but the issue remains!
Today the sync interface already flapping 2 times.
😞
Someone have any new idea?
- Mark as New
- Bookmark
- Subscribe
- Mute
- Subscribe to RSS Feed
- Permalink
- Report Inappropriate Content
### ANOTHER UPDATE ###
Hello fellows!
After we installed the take_154 jumbo hotfix, problems with the VPNs have been resolved.
But the synchronization interface is still flapping and the cluster members continues trying to change the state.
Below, some pieces of messages log.
Flapping of sync interface + Cluster's members trying change the state:
Nov 27 14:04:12 2018 fw02 kernel: [fw4_1];fwha_report_id_problem_status: Try to update state to DOWN due to pnote Interface Active Check (desc eth8 interface is down, 8 interfaces required, only 7 up)
Nov 27 14:04:12 2018 fw02 kernel: [fw4_1];FW-1: fwha_set_new_local_state: Setting state of fwha_local_id(1) to DOWN
Nov 27 14:04:12 2018 fw02 kernel: [fw4_1];FW-1: fwha_update_local_state: Local machine state changed to DOWN
Nov 27 14:04:12 2018 fw02 kernel: [fw4_1];fwha_state_change_implied: Try to update state to ACTIVE because member is down (the change may not be allowed).
Nov 27 14:04:13 2018 fw02 kernel: [fw4_1];check_other_machine_activity: Update state of member id 0 to DEAD, didn't hear from it since 403715.3 and now 403718.3
Nov 27 14:04:13 2018 fw02 kernel: [fw4_1];fwha_set_backup_mode: Try to update local state to ACTIVE because of ID 0 is not ACTIVE or READY. (This attempt may be blocked by other machines)
Nov 27 14:04:13 2018 fw02 kernel: [fw4_1];FW-1: fwha_set_new_local_state: Setting state of fwha_local_id(1) to READY
Nov 27 14:04:13 2018 fw02 kernel: [fw4_1];FW-1: fwha_update_local_state: Local machine state changed to READY
Nov 27 14:04:13 2018 fw02 kernel: [fw4_1];FW-1: fwha_update_state: ID 0 (state ACTIVE -> DOWN) (time 403718.3)
Nov 27 14:04:13 2018 fw02 kernel: [fw4_1]; member 0 is down
Nov 27 14:04:13 2018 fw02 kernel: [fw4_1];FW-1: fwha_state_change_implied: Try to update local state from READY to ACTIVE because all other machines confirmed my READY state
Nov 27 14:04:13 2018 fw02 kernel: [fw4_1];FW-1: fwha_set_new_local_state: Setting state of fwha_local_id(1) to ACTIVE
Nov 27 14:04:13 2018 fw02 kernel: [fw4_1];FW-1: fwha_update_local_state: Local machine state changed to ACTIVE
Nov 27 14:04:13 2018 fw02 kernel: [fw4_0];fwxlate_dyn_port_release_global_quota: kiss_ghtab_get failed
Nov 27 14:04:13 2018 fw02 last message repeated 5 times
Nov 27 14:04:14 2018 fw02 kernel: [fw4_1];fwha_report_id_problem_status: Try to update state to ACTIVE due to pnote Interface Active Check (desc <NULL>)
Nov 27 14:04:15 2018 fw02 kernel: [fw4_1];FW-1: fwha_process_state_msg: Update state of member id 0 to ACTIVE due to the member report message
Nov 27 14:04:15 2018 fw02 kernel: [fw4_1];fwha_set_backup_mode: Try to update local state to STANDBY because of ID 0 is ACTIVE or READY and with higher priority
Nov 27 14:04:15 2018 fw02 kernel: [fw4_1];FW-1: fwha_set_new_local_state: Setting state of fwha_local_id(1) to STANDBY
Nov 27 14:04:15 2018 fw02 kernel: [fw4_1];FW-1: fwha_update_local_state: Local machine state changed to STANDBY
Nov 27 14:04:15 2018 fw02 kernel: [fw4_1];FW-1: fwha_update_state: ID 0 (state DOWN -> ACTIVE) (time 403721.0)
Cluster's member trying to change the state (without the flapping):
Nov 27 16:36:30 2018 fw02 kernel: [fw4_1];check_other_machine_activity: Update state of member id 0 to DEAD, didn't hear from it since 412743.5 and now 412746.5
Nov 27 16:36:30 2018 fw02 kernel: [fw4_1];fwha_set_backup_mode: Try to update local state to ACTIVE because of ID 0 is not ACTIVE or READY. (This attempt may be blocked by other machines)
Nov 27 16:36:30 2018 fw02 kernel: [fw4_1];FW-1: fwha_set_new_local_state: Setting state of fwha_local_id(1) to READY
Nov 27 16:36:30 2018 fw02 kernel: [fw4_1];FW-1: fwha_update_local_state: Local machine state changed to READY
Nov 27 16:36:30 2018 fw02 kernel: [fw4_1];FW-1: fwha_update_state: ID 0 (state ACTIVE -> DOWN) (time 412746.5)
Nov 27 16:36:30 2018 fw02 kernel: [fw4_1]; member 0 is down
Nov 27 16:36:30 2018 fw02 kernel: [fw4_1];FW-1: fwha_state_change_implied: Try to update local state from READY to ACTIVE because all other machines confirmed my READY state
Nov 27 16:36:30 2018 fw02 kernel: [fw4_1];FW-1: fwha_set_new_local_state: Setting state of fwha_local_id(1) to ACTIVE
Nov 27 16:36:30 2018 fw02 kernel: [fw4_1];FW-1: fwha_update_local_state: Local machine state changed to ACTIVE
Nov 27 16:36:30 2018 fw02 kernel: [fw4_0];fwxlate_dyn_port_release_global_quota: kiss_ghtab_get failed
Nov 27 16:36:30 2018 fw02 last message repeated 3 times
Nov 27 16:36:31 2018 fw02 kernel: [fw4_1];FW-1: fwha_process_state_msg: Update state of member id 0 to ACTIVE due to the member report message
Nov 27 16:36:31 2018 fw02 kernel: [fw4_1];fwha_set_backup_mode: Try to update local state to STANDBY because of ID 0 is ACTIVE or READY and with higher priority
Nov 27 16:36:31 2018 fw02 kernel: [fw4_1];FW-1: fwha_set_new_local_state: Setting state of fwha_local_id(1) to STANDBY
Nov 27 16:36:31 2018 fw02 kernel: [fw4_1];FW-1: fwha_update_local_state: Local machine state changed to STANDBY
Nov 27 16:36:31 2018 fw02 kernel: [fw4_1];FW-1: fwha_update_state: ID 0 (state DOWN -> ACTIVE) (time 412747.9)
- Mark as New
- Bookmark
- Subscribe
- Mute
- Subscribe to RSS Feed
- Permalink
- Report Inappropriate Content
Did you try to connect both the firewall Sync interfaces back to back?
At least this can be done as a test. We had a similar issue which was resolved by doing this.
- Mark as New
- Bookmark
- Subscribe
- Mute
- Subscribe to RSS Feed
- Permalink
- Report Inappropriate Content
Your eth8 still goes down or at least is not able to communicate between firewalls as before.
Have you checked switch logs on that VLAN you have connected your SYNC.
Is it possible that you have another firewall cluster connected to the same VLAN?
Straight cable (if that's an option) could give some answers too as suggested earlier.
If it's a time predictable flap, try to collect packet capture from eth8 to see what's going on there
Why don't you make FW2 higher priority and see if that one suffers from the same symptoms?
- Mark as New
- Bookmark
- Subscribe
- Mute
- Subscribe to RSS Feed
- Permalink
- Report Inappropriate Content
From expert mode run "ifconfig eth8" on the firewall, is the "carrier" value shown nonzero?
Also please post outputs of:
ifconfig eth8
ethtool -S eth8
fw ctl pstat
cphaprob syncstat
--
Second Edition of my "Max Power" Firewall Book
Now Available at http://www.maxpowerfirewalls.com
New Book: "Max Power 2026" Coming Soon
Check Point Firewall Performance Optimization
Check Point Firewall Performance Optimization
- Mark as New
- Bookmark
- Subscribe
- Mute
- Subscribe to RSS Feed
- Permalink
- Report Inappropriate Content
Hi guys!
First of all, thank you for the posts and let's go to the answers:
Mubarizuddin Mohammed and Kaspars Zibarts the cluster's members is connected via straight cable since this start this post (I only changed from interface called Sync to eth8).
About the packet capture, I can't measure when this happen, I only know that occur in a business hour (7 AM to 7 PM).
About the cluster's priority, the gateways is configured with option "Maintain current active Cluster Member"
In both members the carrier is 0
Follow the outputs requesteds:
ifconfig eth8
[Expert@fw01:0]# ifconfig eth8
eth8 Link encap:Ethernet HWaddr 00:1C:7F:81:66:91
inet addr:172.31.255.221 Bcast:172.31.255.223 Mask:255.255.255.252
UP BROADCAST RUNNING MULTICAST MTU:1500 Metric:1
RX packets:33119286 errors:0 dropped:0 overruns:0 frame:0
TX packets:242265575 errors:0 dropped:0 overruns:0 carrier:0
collisions:0 txqueuelen:1000
RX bytes:4570799625 (4.2 GiB) TX bytes:273528052825 (254.7 GiB)
[Expert@fw02:0]# ifconfig eth8
eth8 Link encap:Ethernet HWaddr 00:1C:7F:81:66:69
inet addr:172.31.255.222 Bcast:172.31.255.223 Mask:255.255.255.252
UP BROADCAST RUNNING MULTICAST MTU:1500 Metric:1
RX packets:242105389 errors:0 dropped:0 overruns:0 frame:0
TX packets:33023750 errors:0 dropped:0 overruns:0 carrier:0
collisions:0 txqueuelen:1000
RX bytes:273360672145 (254.5 GiB) TX bytes:4456865387 (4.1 GiB)
ethtool -S eth8
[Expert@fw01:0]# ethtool -S eth8
NIC statistics:
rx_packets: 33123568
tx_packets: 242327493
rx_bytes: 4704099767
tx_bytes: 274570256636
rx_broadcast: 321931
tx_broadcast: 323124
rx_multicast: 32645695
tx_multicast: 238322690
multicast: 32645695
collisions: 0
rx_crc_errors: 0
rx_no_buffer_count: 0
rx_missed_errors: 0
tx_aborted_errors: 0
tx_carrier_errors: 0
tx_window_errors: 0
tx_abort_late_coll: 0
tx_deferred_ok: 0
tx_single_coll_ok: 0
tx_multi_coll_ok: 0
tx_timeout_count: 1
rx_long_length_errors: 0
rx_short_length_errors: 0
rx_align_errors: 0
tx_tcp_seg_good: 0
tx_tcp_seg_failed: 0
rx_flow_control_xon: 0
rx_flow_control_xoff: 0
tx_flow_control_xon: 0
tx_flow_control_xoff: 0
rx_long_byte_count: 4704099767
tx_dma_out_of_sync: 0
lro_aggregated: 0
lro_flushed: 0
lro_recycled: 0
tx_smbus: 0
rx_smbus: 0
dropped_smbus: 0
os2bmc_rx_by_bmc: 0
os2bmc_tx_by_bmc: 0
os2bmc_tx_by_host: 0
os2bmc_rx_by_host: 0
rx_errors: 0
tx_errors: 0
tx_dropped: 0
rx_length_errors: 0
rx_over_errors: 0
rx_frame_errors: 0
rx_fifo_errors: 0
tx_fifo_errors: 0
tx_heartbeat_errors: 0
tx_queue_0_packets: 242327681
tx_queue_0_bytes: 273600968980
tx_queue_0_restart: 0
rx_queue_0_packets: 33123568
rx_queue_0_bytes: 4571605495
rx_queue_0_drops: 0
rx_queue_0_csum_err: 0
rx_queue_0_alloc_failed: 0
[Expert@fw02:0]# ethtool -S eth8
NIC statistics:
rx_packets: 242350310
tx_packets: 33040613
rx_bytes: 274617825638
tx_bytes: 4592014643
rx_broadcast: 320793
tx_broadcast: 321873
rx_multicast: 238353795
tx_multicast: 32602820
multicast: 238353795
collisions: 0
rx_crc_errors: 0
rx_no_buffer_count: 0
rx_missed_errors: 0
tx_aborted_errors: 0
tx_carrier_errors: 0
tx_window_errors: 0
tx_abort_late_coll: 0
tx_deferred_ok: 0
tx_single_coll_ok: 0
tx_multi_coll_ok: 0
tx_timeout_count: 0
rx_long_length_errors: 0
rx_short_length_errors: 0
rx_align_errors: 0
tx_tcp_seg_good: 0
tx_tcp_seg_failed: 0
rx_flow_control_xon: 0
rx_flow_control_xoff: 0
tx_flow_control_xon: 0
tx_flow_control_xoff: 0
rx_long_byte_count: 274617825638
tx_dma_out_of_sync: 0
lro_aggregated: 0
lro_flushed: 0
lro_recycled: 0
tx_smbus: 0
rx_smbus: 0
dropped_smbus: 0
os2bmc_rx_by_bmc: 0
os2bmc_tx_by_bmc: 0
os2bmc_tx_by_host: 0
os2bmc_rx_by_host: 0
rx_errors: 0
tx_errors: 0
tx_dropped: 0
rx_length_errors: 0
rx_over_errors: 0
rx_frame_errors: 0
rx_fifo_errors: 0
tx_fifo_errors: 0
tx_heartbeat_errors: 0
tx_queue_0_packets: 33040613
tx_queue_0_bytes: 4459729583
tx_queue_0_restart: 0
rx_queue_0_packets: 242350310
rx_queue_0_bytes: 273648424398
rx_queue_0_drops: 0
rx_queue_0_csum_err: 0
rx_queue_0_alloc_failed: 0
fw ctl pstat
[Expert@fw01:0]# fw ctl pstat
System Capacity Summary:
Memory used: 13% (3318 MB out of 23989 MB) - below watermark
Concurrent Connections: 52435 (Unlimited)
Aggressive Aging is enabled, not active
Hash kernel memory (hmem) statistics:
Total memory allocated: 2512388096 bytes in 613376 (4096 bytes) blocks using 1 pool
Total memory bytes used: 0 unused: 2512388096 (100.00%) peak: 1644289672
Total memory blocks used: 0 unused: 613376 (100%) peak: 425749
Allocations: 921927929 alloc, 0 failed alloc, 910377276 free
System kernel memory (smem) statistics:
Total memory bytes used: 4247545836 peak: 4597334808
Total memory bytes wasted: 89520318
Blocking memory bytes used: 98583572 peak: 148710952
Non-Blocking memory bytes used: 4148962264 peak: 4448623856
Allocations: 38576947 alloc, 0 failed alloc, 38548237 free, 0 failed free
vmalloc bytes used: 4129415616 expensive: no
Kernel memory (kmem) statistics:
Total memory bytes used: 2807431148 peak: 3353144992
Allocations: 960493754 alloc, 0 failed alloc
948917252 free, 0 failed free
External Allocations: 8298240 for packets, 152281056 for SXL
Cookies:
2892022307 total, 11 alloc, 11 free,
22507831 dup, 3453581577 get, 1905764438 put,
2039508532 len, 23406809 cached len, 0 chain alloc,
0 chain free
Connections:
101983124 total, 63467267 TCP, 24356197 UDP, 14127765 ICMP,
31895 other, 273 anticipated, 0 recovered, 52435 concurrent,
75786 peak concurrent
Fragments:
25905384 fragments, 12940787 packets, 6562 expired, 0 short,
0 large, 16 duplicates, 36 failures
NAT:
710997013/0 forw, 1020399649/0 bckw, 1713879696 tcpudp,
15522032 icmp, 66808162-46398448 alloc
Sync:
Version: new
Status: Able to Send/Receive sync packets
Sync packets sent:
total : 234541097, retransmitted : 12, retrans reqs : 194, acks : 565604
Sync packets received:
total : 3194567, were queued : 330, dropped by net : 267
retrans reqs : 12, received 109468 acks
retrans reqs for illegal seq : 0
dropped updates as a result of sync overload: 193
Callback statistics: handled 108306 cb, average delay : 1, max delay : 152
[Expert@fw02:0]# fw ctl pstat
System Capacity Summary:
Memory used: 9% (2210 MB out of 23989 MB) - below watermark
Concurrent Connections: 51740 (Unlimited)
Aggressive Aging is enabled, not active
Hash kernel memory (hmem) statistics:
Total memory allocated: 2512388096 bytes in 613376 (4096 bytes) blocks using 1 pool
Total memory bytes used: 0 unused: 2512388096 (100.00%) peak: 706276448
Total memory blocks used: 0 unused: 613376 (100%) peak: 180436
Allocations: 1836486752 alloc, 0 failed alloc, 1832764488 free
System kernel memory (smem) statistics:
Total memory bytes used: 4019361572 peak: 4322083508
Total memory bytes wasted: 9222979
Blocking memory bytes used: 9536488 peak: 11610296
Non-Blocking memory bytes used: 4009825084 peak: 4310473212
Allocations: 357809 alloc, 0 failed alloc, 351482 free, 0 failed free
vmalloc bytes used: 3998226488 expensive: no
Kernel memory (kmem) statistics:
Total memory bytes used: 1900327696 peak: 2440715436
Allocations: 1836833507 alloc, 0 failed alloc
1833107776 free, 0 failed free
External Allocations: 3072 for packets, 99247102 for SXL
Cookies:
269724906 total, 0 alloc, 0 free,
46698 dup, 824924779 get, 2437180 put,
272039687 len, 115648 cached len, 0 chain alloc,
0 chain free
Connections:
814760 total, 25611 TCP, 206335 UDP, 551009 ICMP,
31805 other, 0 anticipated, 0 recovered, 51737 concurrent,
75691 peak concurrent
Fragments:
52898 fragments, 26383 packets, 2 expired, 0 short,
0 large, 0 duplicates, 0 failures
NAT:
1737046/0 forw, 83816/0 bckw, 1431059 tcpudp,
388069 icmp, 621656-46351628 alloc
Sync:
Version: new
Status: Able to Send/Receive sync packets
Sync packets sent:
total : 3163702, retransmitted : 267, retrans reqs : 12, acks : 109257
Sync packets received:
total : 234507506, were queued : 9802, dropped by net : 12
retrans reqs : 194, received 565578 acks
retrans reqs for illegal seq : 0
dropped updates as a result of sync overload: 0
Callback statistics: handled 560483 cb, average delay : 1, max delay : 7
cphaprob syncstat
[Expert@fw01:0]# cphaprob syncstat
Sync Statistics (IDs of F&A Peers - 1 😞
Other Member Updates:
Sent retransmission requests................... 194
Avg missing updates per request................ 1
Old or too-new arriving updates................ 0
Unsynced missing updates....................... 193
Lost sync connection (num of events)........... 42
Timed out sync connection ..................... 0
Local Updates:
Total generated updates ....................... 33518802
Recv Retransmission requests................... 12
Recv Duplicate Retrans request................. 0
Blocking Events................................ 0
Blocked packets................................ 0
Max length of sending queue.................... 0
Avg length of sending queue.................... 0
Hold Pkts events............................... 108320
Unhold Pkt events.............................. 108320
Not held due to no members..................... 47
Max held duration (sync ticks)................. 0
Avg held duration (sync ticks)................. 0
Timers:
Sync tick (ms)................................. 100
CPHA tick (ms)................................. 100
Queues:
Sending queue size............................. 512
Receiving queue size........................... 256
[Expert@fw02:0]# cphaprob syncstat
Sync Statistics (IDs of F&A Peers - 1 😞
Other Member Updates:
Sent retransmission requests................... 12
Avg missing updates per request................ 1
Old or too-new arriving updates................ 12
Unsynced missing updates....................... 0
Lost sync connection (num of events)........... 42
Timed out sync connection ..................... 9
Local Updates:
Total generated updates ....................... 3385198
Recv Retransmission requests................... 194
Recv Duplicate Retrans request................. 0
Blocking Events................................ 0
Blocked packets................................ 0
Max length of sending queue.................... 0
Avg length of sending queue.................... 0
Hold Pkts events............................... 560569
Unhold Pkt events.............................. 560569
Not held due to no members..................... 36
Max held duration (sync ticks)................. 0
Avg held duration (sync ticks)................. 0
Timers:
Sync tick (ms)................................. 100
CPHA tick (ms)................................. 100
Queues:
Sending queue size............................. 512
Receiving queue size........................... 256
- Mark as New
- Bookmark
- Subscribe
- Mute
- Subscribe to RSS Feed
- Permalink
- Report Inappropriate Content
The eth8 interfaces at a hardware/Gaia level look healthy and the sync network does not appear to be overloaded. One thing that was a little odd on fw01:
tx_timeout_count: 1
Don't think I've ever seen this counter be nonzero before, it indicates that a transmit operation timed out because an interrupt was lost or the NIC card lost its mind. I'm assuming that you have experienced many sync interface "failures" and this counter does not increment every time they happen, so it is probably nothing.
Since the underlying NIC is stable and not overloaded (and you already tried switching ports from Sync to eth8) it sounds like some kind of Check Point code issue. The log entry is indicating that the member declaring the failure has not heard anything from the other member via the sync interface for a full 3 seconds, which is a relative eternity in terms of sync updates which are supposed to happen 10-20 times a second. A few questions:
- Are both cluster members declaring the eth8 interface down at roughly the same time, or is only the active member doing it?
- Assuming that fw01 is initially active, if you fail over to fw02 and run there for awhile, does the eth8 failure now happen on fw02 and not fw01? Or does the eth8 failure stick with fw01 (or stop completely) when running with fw02 active?
- Is the value "Lost sync connection (num of events)........... 42" reported by cphaprob syncstat incrementing on its own? It is expected that this counter will bump up a few every time policy is reinstalled as sync has to restart, but should not increment on its own without the policy being loaded. Does it increment every time eth8 is declared dead?
- Are any or lots of process core dumps getting barfed into the /var/log/dump/usermode directory every time eth8 is declared dead?
- Any establishment or loss of cluster state sync should be logged in $FWDIR/log/fwd.elg. Does this file have anything interesting added to it around the time of the issue? Any chance the fwd daemon is crashing when sync is lost? (Use cpwd_admin list to check this)
- Is eth8 configured as "1st Sync" or "Cluster + 1st Sync" on the cluster object?
--
Second Edition of my "Max Power" Firewall Book
Now Available at http://www.maxpowerfirewalls.com
New Book: "Max Power 2026" Coming Soon
Check Point Firewall Performance Optimization
Check Point Firewall Performance Optimization
- Mark as New
- Bookmark
- Subscribe
- Mute
- Subscribe to RSS Feed
- Permalink
- Report Inappropriate Content
Timothy Hall, follow the answer about your questions (sorry about the delay)
Are both cluster members declaring the eth8 interface down at roughly the same time, or is only the active member doing it?
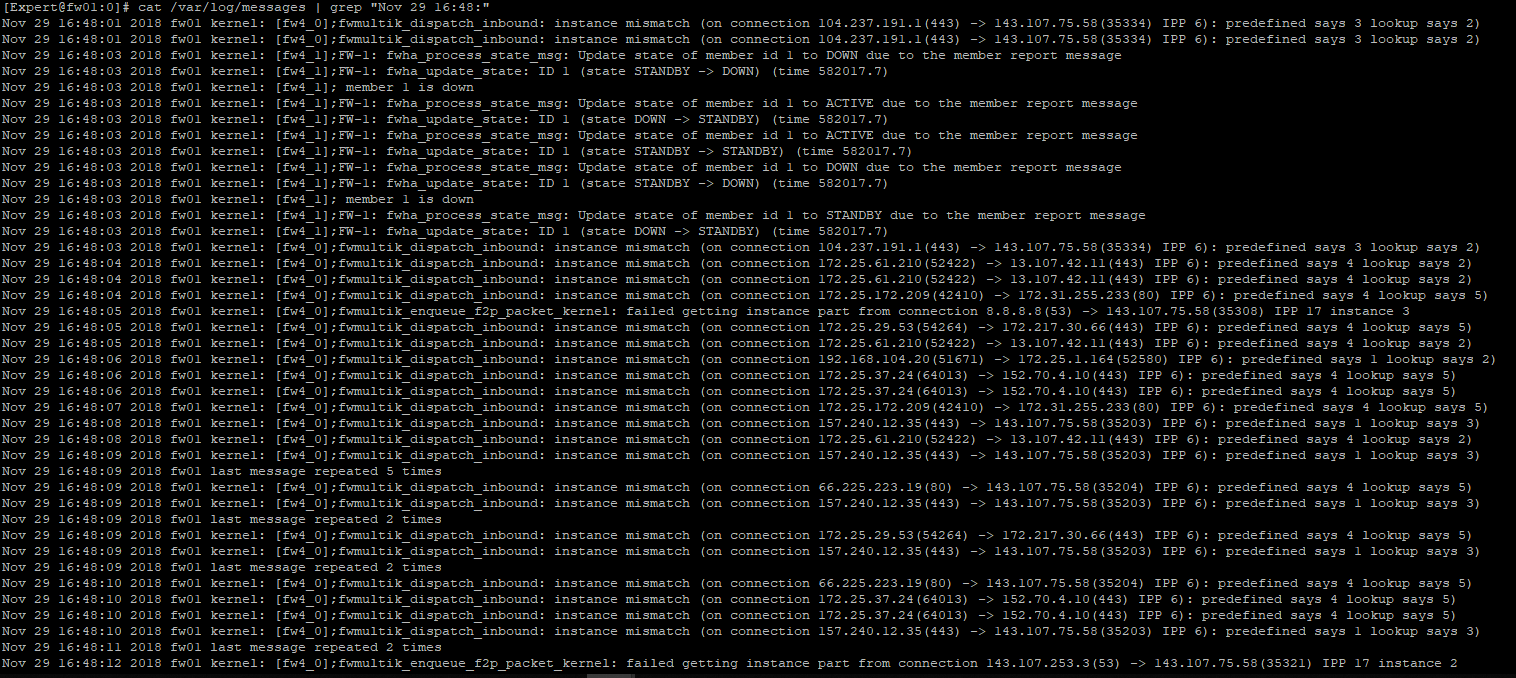
A: Actually no, the message of "eth8 interface is down" appears only on the standby member. For the active member, who "is down" was the member in standby(I'll put the screenshot of both)
Active
Standby
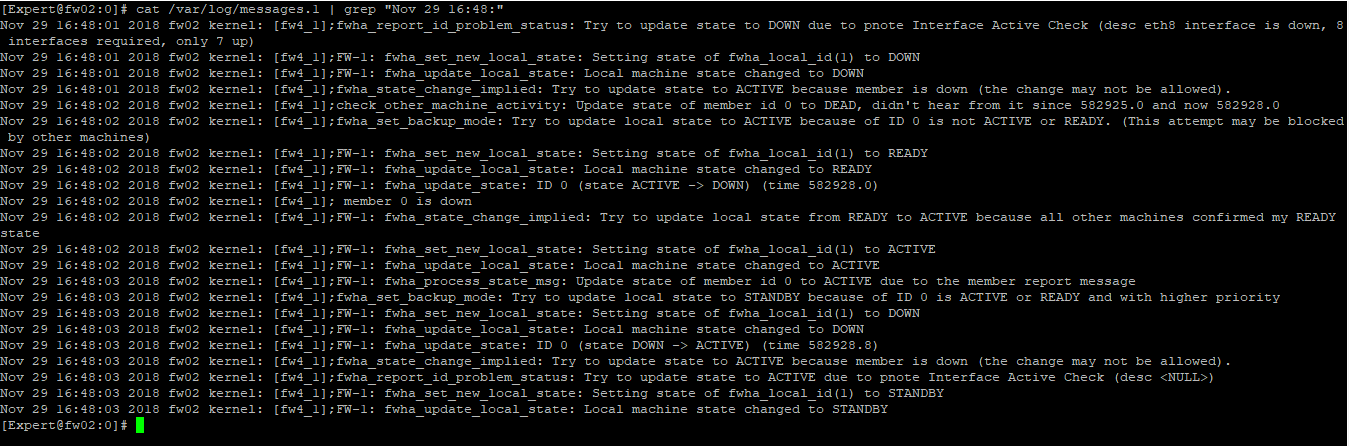
Note: Some messages about fwmultik_dispatch started to appear after we enabled priority queue (As requested by the TAC)
Assuming that fw01 is initially active, if you fail over to fw02 and run there for awhile, does the eth8 failure now happen on fw02 and not fw01?Or does the eth8 failure stick with fw01 (or stop completely) when running with fw02 active?
A: The same problem still happens, only the messages are reversed.
Is the value "Lost sync connection (num of events)........... 42" reported by cphaprob syncstat incrementing on its own? It is expected that this counterwill bump up a few every time policy is reinstalled as sync has to restart, but should not increment on its own without the policy being loaded.Does it increment every time eth8 is declared dead?
A: Sorry Tim, but I cannot answer this question, because I don't have control about the installation policy. My customer apply policy sometimes without consult us.
(But today, I can see the value of "Lost sync connection" is 60)
Are any or lots of process core dumps getting barfed into the /var/log/dump/usermode directory every time eth8 is declared dead?
A: No core dumps in both members.
Any establishment or loss of cluster state sync should be logged in $FWDIR/log/fwd.elg. Does this file have anything interesting added to it around the time of the issue? Any chance the fwd daemon is crashing when sync is lost? (Use cpwd_admin list to check this)
A: In fwd.elg I don't see any logs on the same hour of the flapping (16:00 to 16:59)
Is eth8 configured as "1st Sync" or "Cluster + 1st Sync" on the cluster object?
A: Just 1st Sync
- Mark as New
- Bookmark
- Subscribe
- Mute
- Subscribe to RSS Feed
- Permalink
- Report Inappropriate Content
OK that helps. If I'm reading those logs correctly the active member never actually has a problem itself, it is just logging the state change of the standby member to down then back to standby, and the active member is just hearing about it via CCP. What's interesting is based on the lack of fwd.elg log entries, actual state sync does not appear to be getting lost between the two members. We have established that the underlying eth8 interface is stable. It is the "Interface Active Check" pnote that is actually throwing the failure, since it thinks that nothing has been heard for 3 seconds (the dead interval) on the eth8 interface. I find it very hard to believe that no state sync traffic would traverse eth8 for a full 3 seconds, but I guess it is possible since only the state table changes are sent between the two members (delta sync) in normal operation.
If you run cphaprob -a if on both members they report eth8 as Sync/trusted, right?
Bit of a long shot but run ethtool -k eth8, is TCP Segmentation Offload enabled? It should not be, see sk102969: Intermittent outages of TCP traffic on 10GbE interfaces in IP Appliances running Gaia OS
This will sound silly, but try initiating a constant ping from the standby member to a the active member's eth8 IP address (i.e. via the sync/eth8 interface) and leave it running. Do these blips on the eth8 interface stop happening as long as that ping is left running? Based on what you've provided it looks like some kind of malfunction with the Interface Active Check pnote.
As a last resort I guess you could increase the ClusterXL dead timeout from 3 seconds (sk93454: Increasing ClusterXL dead timeout), but that is just addressing a symptom of the problem and not solving the underlying problem. The standby member does seem to complete the entire eth8 "flap" and go back to standby in about 4 seconds total. That may be however because it starts active probing of that interface once it is declared down after the initial 3 seconds, and then immediately finds the interface is OK just as described here: sk31336: Using Monitor Interface Link State feature to improve ClusterXL interface-failure-detection...
--
Second Edition of my "Max Power" Firewall Book
Now Available at http://www.maxpowerfirewalls.com
New Book: "Max Power 2026" Coming Soon
Check Point Firewall Performance Optimization
Check Point Firewall Performance Optimization
- Mark as New
- Bookmark
- Subscribe
- Mute
- Subscribe to RSS Feed
- Permalink
- Report Inappropriate Content
Hi Timothy Hall.
Let's go to the answers:
If you run cphaprob -a if on both members they report eth8 as Sync/trusted, right?
A: Yes, this message appear on both members "sync(secured), multicast"
Bit of a long shot but run ethtool -k eth8, is TCP Segmentation Offload enabled?
A: TCP segmentation is off on both members.
This will sound silly, but try initiating a constant ping from the standby member to a the active member's eth8 IP address
(i.e. via the sync/eth8 interface) and leave it running. Do these blips on the eth8 interface stop happening as long as that ping is left running? Based on what you've provided it looks like some kind of malfunction with the Interface Active Check pnote.
A: I'm going to start a ping now and let it run all day. (I'm posting the result soon)
As a last resort I guess you could increase the ClusterXL dead timeout from 3 seconds (sk93454: Increasing ClusterXL dead timeout), but that is just addressing a symptom of the problem and not solving the underlying problem.
The standby member does seem to complete the entire eth8 "flap" and go back to standby in about 4 seconds total.
That may be however because it starts active probing of that interface once it is declared down after the initial 3 seconds, and then immediately finds the interface is OK just as described here: sk31336: Using Monitor Interface Link State feature to improve ClusterXL interface-failure-detection ability
A: I have already changed this parameter in the past, from 3 to 6, and the problem has continued to occur.
(Nowadays, after a reboot, this parameter is set to default value 3). Could the MILS feature be the cause of this behavior? Disable it can cause any impact in futures failovers?
- Mark as New
- Bookmark
- Subscribe
- Mute
- Subscribe to RSS Feed
- Permalink
- Report Inappropriate Content
Hello Timothy Hall, me again!
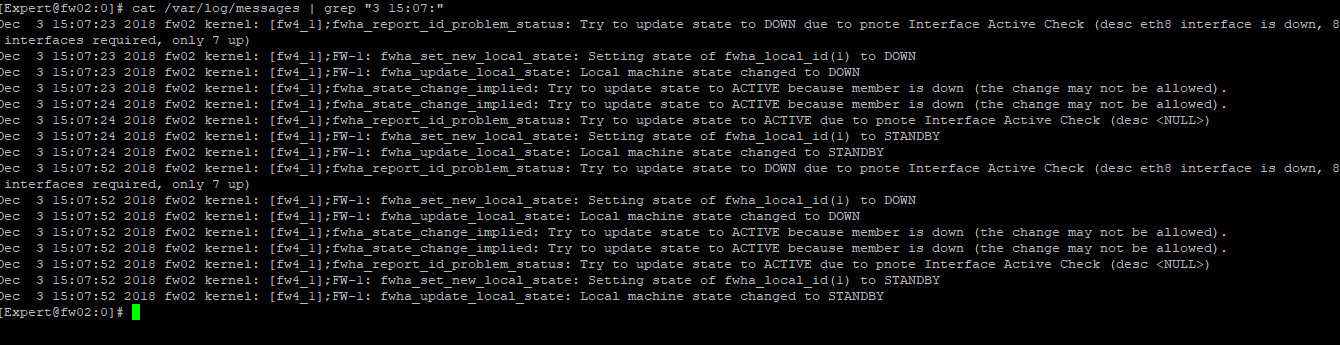
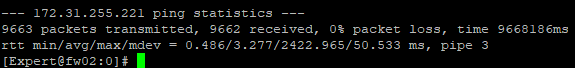
Even with the ping test started, the flap happened twice in the same minute. (No packet loss).
eth8 down:
ping statistics:
- Mark as New
- Bookmark
- Subscribe
- Mute
- Subscribe to RSS Feed
- Permalink
- Report Inappropriate Content
Interesting, in the latest log output the "check_other_machine_activity" log entry noting that it hasn't seen the active member for 3 seconds is now missing, presumably because of the continuous ping. After the ping is stopped and the next eth8 "flap" occurs does this particular message come back?
At a loss to explain what problem the Interface Active Check thinks is occurring there...will probably have to enable a debug with TAC and catch the flap in the act...
You may also want to check out this thread which sounds eerily similar to what you are seeing, in their case they RMA'ed their 5800 box for a suspected bad NIC:
HA Failover appears to be caused by sync interface
--
Second Edition of my "Max Power" Firewall Book
Now Available at http://www.maxpowerfirewalls.com
New Book: "Max Power 2026" Coming Soon
Check Point Firewall Performance Optimization
Check Point Firewall Performance Optimization
- Mark as New
- Bookmark
- Subscribe
- Mute
- Subscribe to RSS Feed
- Permalink
- Report Inappropriate Content
Yes, this case is getting increasingly weird... hahah
About the debug, I think this is not possible because I never know when this flap will happen again (eg the last flap occurs yesterday at 10am) and I imagine that letting debug run for a long time can cause problems in gateway performance, right?
The TAC updated the SR today, requesting a reduction in the amount of synchronization traffic (disabling the synchronization of some services, such as ICMP, HTTP and DNS). I'll try to do this as soon as possible to see the behavior.
Note: Before thinking about RMA, it has already crossed my mind to reinstall the cluster from scratch, what do you think, bad or good idea?
- Mark as New
- Bookmark
- Subscribe
- Mute
- Subscribe to RSS Feed
- Permalink
- Report Inappropriate Content
I'd think the debug could be very tightly scoped to just the Interface Active Check pnote since that seems to be where the problem is located. That shouldn't be a ridiculous amount of debugging output.
Your sync interface didn't look particularly overloaded to me but setting up selective synchronization might help, as would perhaps adding two physical interfaces to a bond and using that as your 1st sync. Do not add a second separate physical interface as 2nd sync in the cluster properties as that will cause further performance problems.
Kind of doubt reloading the cluster from scratch will help.
--
Second Edition of my "Max Power" Firewall Book
Now Available at http://www.maxpowerfirewalls.com
New Book: "Max Power 2026" Coming Soon
Check Point Firewall Performance Optimization
Check Point Firewall Performance Optimization
- Mark as New
- Bookmark
- Subscribe
- Mute
- Subscribe to RSS Feed
- Permalink
- Report Inappropriate Content
Hi MATEUS SALGADO any updates to your case?
One thing that has really been bugging me about this issue is how it seems to have come out of the blue in an R80.10 release that has been around for awhile. I got curious and looked through the list of resolved issues in the various R80.10 Jumbo HFAs, and oh boy look at what I found in GA Take 103:
PMTR-7312, PMTR-791 Cluster Enhancement: adding a grace period before failover when detecting 'Interface Active Check' state to prevent unneeded failovers
So it looks like the Interface Active Check code did get touched in R80.10 Jumbo HFA Take 103. While reverting your cluster to Take 91 and seeing if the sync flap goes away might be a bit extreme (unless you have a very well-equipped lab environment), it might be worth asking TAC if there is a way to disable this new grace period feature in a kernel variable (via fw ctl set int) or a registry entry. It is possible that some kind of new bug was introduced along with this grace period feature.
Mike Jensen you are running R77.30 and seeing something kind of similar, but PMTR-7312/PMTR-791 does not show up in the R77.30 Jumbo HFA release notes at all. I suppose it is possible that this feature/fix was backported in the R77.30 Jumbo HFAs at some point but not documented. Looking at the release date for R80.10 Jumbo HFA 103 (4/12/2018), I'd estimate that R77.30 GA Jumbo HFA Take 302 (release date 3/27/2018) would probably not contain this grace period enhancement, assuming it was actually backported in the first place.
This is all wild speculation, but seems to fit the available facts.
--
Second Edition of my "Max Power" Firewall Book
Now Available at http://www.maxpowerfirewalls.com
New Book: "Max Power 2026" Coming Soon
Check Point Firewall Performance Optimization
Check Point Firewall Performance Optimization
- Mark as New
- Bookmark
- Subscribe
- Mute
- Subscribe to RSS Feed
- Permalink
- Report Inappropriate Content
Hello Timothy Hall,
My customer is in "freezing", so I have not changed anything in their environment yet (nor the TAC procedure - disabling the synchronization of some services, such as ICMP, HTTP and DNS).
About your research, thank you very much, I really appreciate your help.
The support site, after the last update, is so strange and with so many bugs, but I will update SR with new information and keep you informed.
Thanks!
- Mark as New
- Bookmark
- Subscribe
- Mute
- Subscribe to RSS Feed
- Permalink
- Report Inappropriate Content
Hello Mateus.
Finally, did you get with the source of the problem ?? ......does the TAC give to you any solution?
i am experiencing very simillar issue with Gaia VSX cluster R80.30 take 215.....flapping with Sync and with one traffic interface
Regards
- Mark as New
- Bookmark
- Subscribe
- Mute
- Subscribe to RSS Feed
- Permalink
- Report Inappropriate Content
Hello,
I am the individual having the very similar issue that is posted on CPUG. Check Point TAC RMA'd one of the security gateways in my cluster, I have the new one installed, and I still have the same issue. I am running R7730 with the latest GA JHA installed.
Can you please tell me if the speed of your interface is operating at 1000Mbps Full duplex? With my gateways I cannot get the sync interface to operate at 1000Mbps / full.
I ran the ifconfig Sync command on the cluster members for the first time today after seeing Tim's suggestion above and the gateway that was not replaced is showing a Carrier value of 414. The other gateway's carrier is 0.
Can someone please explain the significance of the Carrier # ?
[Expert@msgcu-intfw1:0]# ifconfig Sync
Sync Link encap:Ethernet HWaddr 00:1C:7F:84:53:74
inet addr:172.25.2.1 Bcast:172.25.2.255 Mask:255.255.255.0
UP BROADCAST RUNNING MULTICAST MTU:1500 Metric:1
RX packets:86815809 errors:167 dropped:0 overruns:0 frame:167
TX packets:21365880 errors:414 dropped:0 overruns:0 carrier:414
collisions:1062 txqueuelen:1000
RX bytes:89637420608 (83.4 GiB) TX bytes:7413666606 (6.9 GiB)
[Expert@msgcu-intfw1:0]#
Leaderboard
Epsum factorial non deposit quid pro quo hic escorol.
| User | Count |
|---|---|
| 12 | |
| 6 | |
| 4 | |
| 3 | |
| 3 | |
| 3 | |
| 3 | |
| 2 | |
| 2 | |
| 2 |
Upcoming Events
Fri 10 Jul 2026 @ 11:00 AM (IDT)
CheckMates Live Netherlands - Sessie 48: Nieuwe Check Point Workspace SecurityTue 14 Jul 2026 @ 10:00 AM (PDT)
AI Security Masters E11: READY OR NOT: Securing the AI Enterprise 3/5 - AI Workforce SecurityThu 30 Jul 2026 @ 10:00 AM (PDT)
AI Security Masters E12: READY OR NOT: Securing the AI Enterprise 4/5 - AI GatewayFri 10 Jul 2026 @ 11:00 AM (IDT)
CheckMates Live Netherlands - Sessie 48: Nieuwe Check Point Workspace SecurityTue 14 Jul 2026 @ 10:00 AM (PDT)
AI Security Masters E11: READY OR NOT: Securing the AI Enterprise 3/5 - AI Workforce SecurityThu 30 Jul 2026 @ 10:00 AM (PDT)
AI Security Masters E12: READY OR NOT: Securing the AI Enterprise 4/5 - AI GatewayThu 20 Aug 2026 @ 10:00 AM (PDT)
AI Security Masters E13: READY OR NOT: Securing the AI Ent 5/5 - AI Research & Threat LandscapeAbout CheckMates
Learn Check Point
Advanced Learning
YOU DESERVE THE BEST SECURITY

©1994-2026 Check Point Software Technologies Ltd. All rights reserved.
Copyright
Privacy Policy
About Us
UserCenter