Create a Post
cancel
Showing results for 
Search instead for 
Did you mean: 
r1der
Advisor
Jump to solution

Bandwidth Utilization Report for interface (smartview monitor or diagnosticsview)

Hello everyone,

I am trying to find out if I can generate a 30 day report for Mbps usage on an external interface for justifying a speed increase.

There seems to be several ways to possibly get what I am asking, but having no luck so far.

From what I have checked so far:

  • SmartConsole > Logs & Monitor - I have created Views/Reports >> Widget >> Timeline >> but there doesn't appear to be a Timeline Value (Y) for this.  Tried Normal Traffic (bps), Traffic Total Bytes (Sum) but those don't seem to have a way to filter by interface eth1. Seeing has there's no way to do that, I think this module is not the right way to generate this. 

  • SmartConsole > Tunnel & User Monitoring (SmartView Monitor). I created a "new traffic view". Filtered by "Real time" - Interfaces. Targeting the gateway in question.  I believe this is exactly what I need, except a 30 day report. When I go back into the properties and set it to History & Traffic History to Last Month for Time Frame, it only gives the attached list. 
     

     So not sure this will work.

  • cpview - I found the column I believe I need, but not sure how to extract this data, besides typing it out in an excel spreadsheet. One other option I read was to possibly setup cpviewer. Another was DiagnosticsViewer. I exported the logs, and opened it within DiagnosticsViewer.  There are predefined views, which has eth1_Rx_throughput, but cannot find the Tx throughput under Explorer. I can also filter the dates I want, however I cannot find the fields I need and not sure they exist. I went through each dropdown but I don't think I can get what I am looking for automatically perhaps.

Maybe I am after the wrong thing, or looking at the wrong places? Any suggestions are appreciated.

Thank you!


0 Kudos
2 Solutions

Accepted Solutions
Danny
Champion Champion
Champion

First try if CPViewer gives you the result you are looking for.

If that doesn't help you we can support you getting that data out of your cpview history database in an automated way.

View solution in original post

Elad_Chomsky
Employee
Employee

Hi r1der,

Below are the steps to modify the DiagnosticsView configuration to see the required data:

  • Go to C:\Users\<Your User>\AppData\Local\DiagnosticsView\Config
  • Create a new XML file called CPViewDbPredefined.user.xml
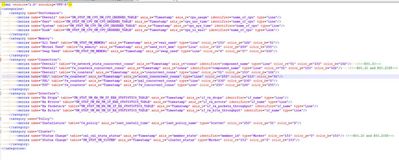
  • It contents should be similar to C:\Program Files (x86)\CheckPoint\DiagnosticsView\Config\CPViewDbPredefined.xml :

Elad_Chomsky_6-1612702575811.jpeg


  • You can add your own custom configurations to this file – All of them are based on existing cpview Tables and Axis X is always a “Timestamp”
  • For example in this case add this lines under the Interface category:

<series name="Tx Drops" table="UM_STAT_UM_HW_UM_IF_ERR_STATISTICS_TABLE" axis_x="Timestamp" axis_y="if_tx_drops" identifier="if_name" type="Line"/>

<series name="Tx Errors" table="UM_STAT_UM_HW_UM_IF_ERR_STATISTICS_TABLE" axis_x="Timestamp" axis_y="if_tx_errors" identifier="if_name" type="Line"/>

<series name="Tx Packets/s" table="UM_STAT_UM_HW_UM_IF_TX_STATISTICS_TABLE" axis_x="Timestamp" axis_y="if_tx_packets_throughput" identifier="if_name" type="Line"/>

<series name="Tx Bits/s" table="UM_STAT_UM_HW_UM_IF_TX_STATISTICS_TABLE" axis_x="Timestamp" axis_y="if_tx_bits_throughput" identifier="if_name" type="Line"/>

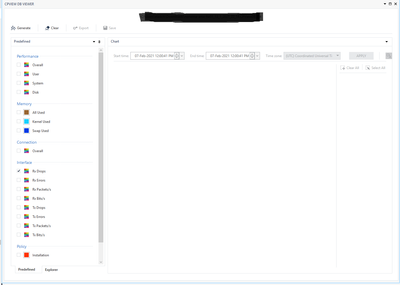
Those columns should now appear by default.

Elad_Chomsky_7-1612702575818.png


You can also use the “Explorer” to see the data more directly:

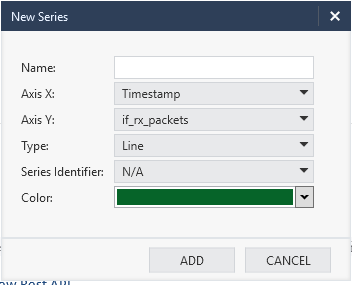
Select the Stat you wish to see – select the table you wish to see and in it double click on the field you wish to see – and it should open you this dialog:

Elad_Chomsky_8-1612702575819.png


View solution in original post

6 Replies
Danny
Champion Champion
Champion

First try if CPViewer gives you the result you are looking for.

If that doesn't help you we can support you getting that data out of your cpview history database in an automated way.

r1der
Advisor

Thanks @Danny. I wanted to be sure it'll contain the ability for the report first before setting it up, but I just pulled the trigger and set it up

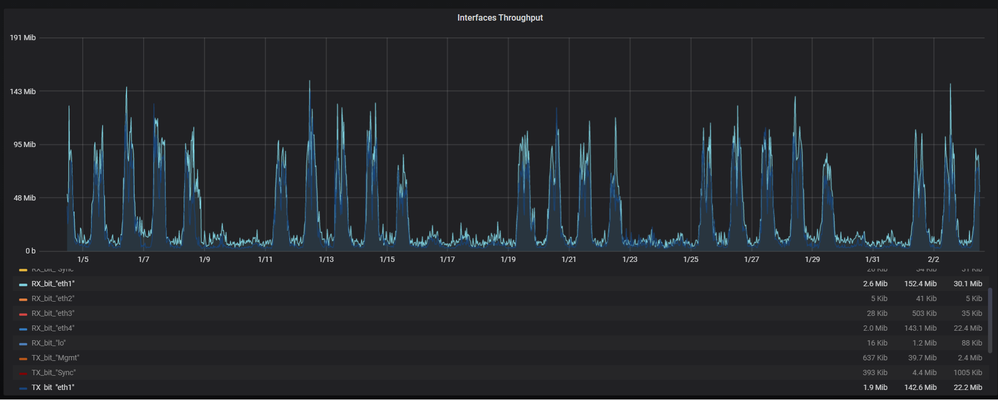
This did have the information I was looking for. It aligns up with our ISP report, I just have to convert the Mib values.
CPViewerCPViewer

0 Kudos
Chris_Atkinson
Employee Employee
Employee

SNMP monitoring of interface traffic counters (as you would do for routers / switches) is also a common solution utilizing your Tool / NMS of choice e.g. Cacti etc.

Netflow is also possible but likely overkill for the task at hand.

CCSM R77/R80/ELITE
r1der
Advisor

Thanks, this will be something I will look into and test around with!

0 Kudos
Elad_Chomsky
Employee
Employee

Hi r1der,

Below are the steps to modify the DiagnosticsView configuration to see the required data:

  • Go to C:\Users\<Your User>\AppData\Local\DiagnosticsView\Config
  • Create a new XML file called CPViewDbPredefined.user.xml
  • It contents should be similar to C:\Program Files (x86)\CheckPoint\DiagnosticsView\Config\CPViewDbPredefined.xml :

Elad_Chomsky_6-1612702575811.jpeg


  • You can add your own custom configurations to this file – All of them are based on existing cpview Tables and Axis X is always a “Timestamp”
  • For example in this case add this lines under the Interface category:

<series name="Tx Drops" table="UM_STAT_UM_HW_UM_IF_ERR_STATISTICS_TABLE" axis_x="Timestamp" axis_y="if_tx_drops" identifier="if_name" type="Line"/>

<series name="Tx Errors" table="UM_STAT_UM_HW_UM_IF_ERR_STATISTICS_TABLE" axis_x="Timestamp" axis_y="if_tx_errors" identifier="if_name" type="Line"/>

<series name="Tx Packets/s" table="UM_STAT_UM_HW_UM_IF_TX_STATISTICS_TABLE" axis_x="Timestamp" axis_y="if_tx_packets_throughput" identifier="if_name" type="Line"/>

<series name="Tx Bits/s" table="UM_STAT_UM_HW_UM_IF_TX_STATISTICS_TABLE" axis_x="Timestamp" axis_y="if_tx_bits_throughput" identifier="if_name" type="Line"/>

Those columns should now appear by default.

Elad_Chomsky_7-1612702575818.png


You can also use the “Explorer” to see the data more directly:

Select the Stat you wish to see – select the table you wish to see and in it double click on the field you wish to see – and it should open you this dialog:

Elad_Chomsky_8-1612702575819.png


r1der
Advisor

@Elad_Chomsky, thank you so much! Just tested this out, and this will work as well.

My only issue is I'd like to have 1 y-axis if possible. Other than that, this accomplishes the request but will need 2 separate graphs for clarity.

0 Kudos

Leaderboard

Epsum factorial non deposit quid pro quo hic escorol.

Upcoming Events

    CheckMates Events