Hi r1der,
Below are the steps to modify the DiagnosticsView configuration to see the required data:
- Go to C:\Users\<Your User>\AppData\Local\DiagnosticsView\Config
- Create a new XML file called CPViewDbPredefined.user.xml
- It contents should be similar to C:\Program Files (x86)\CheckPoint\DiagnosticsView\Config\CPViewDbPredefined.xml :

- You can add your own custom configurations to this file – All of them are based on existing cpview Tables and Axis X is always a “Timestamp”
- For example in this case add this lines under the Interface category:
<series name="Tx Drops" table="UM_STAT_UM_HW_UM_IF_ERR_STATISTICS_TABLE" axis_x="Timestamp" axis_y="if_tx_drops" identifier="if_name" type="Line"/>
<series name="Tx Errors" table="UM_STAT_UM_HW_UM_IF_ERR_STATISTICS_TABLE" axis_x="Timestamp" axis_y="if_tx_errors" identifier="if_name" type="Line"/>
<series name="Tx Packets/s" table="UM_STAT_UM_HW_UM_IF_TX_STATISTICS_TABLE" axis_x="Timestamp" axis_y="if_tx_packets_throughput" identifier="if_name" type="Line"/>
<series name="Tx Bits/s" table="UM_STAT_UM_HW_UM_IF_TX_STATISTICS_TABLE" axis_x="Timestamp" axis_y="if_tx_bits_throughput" identifier="if_name" type="Line"/>
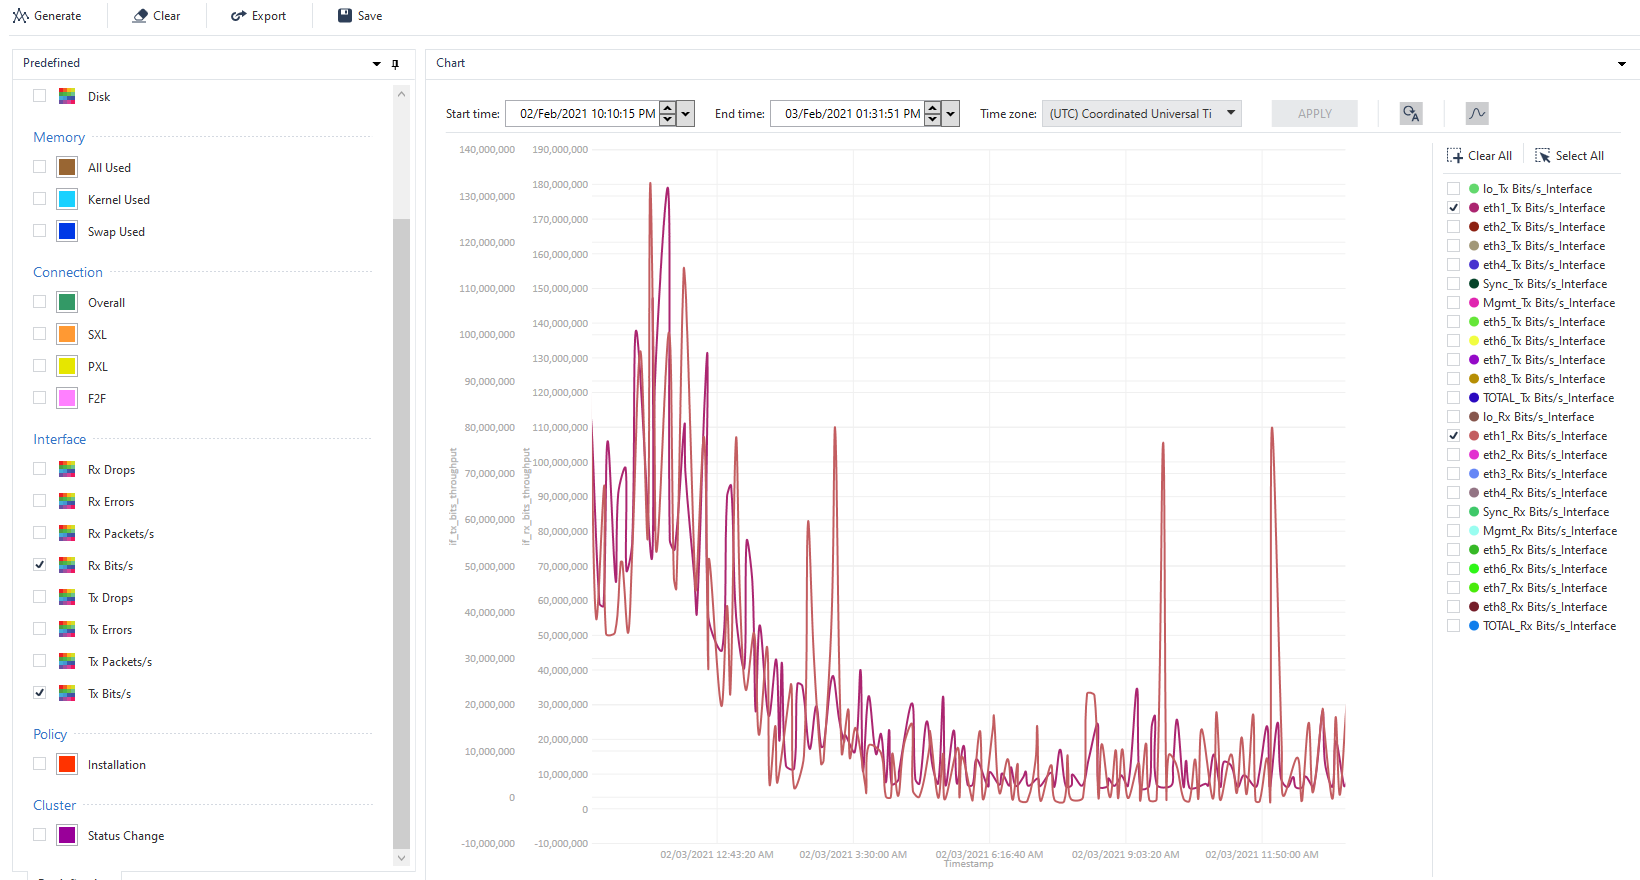
Those columns should now appear by default.

You can also use the “Explorer” to see the data more directly:
Select the Stat you wish to see – select the table you wish to see and in it double click on the field you wish to see – and it should open you this dialog:


