Create a Post
cancel
Showing results for 
Search instead for 
Did you mean: 
Josh28
Contributor
Jump to solution

SmartEvent - Error (CPSEMD not running)

Hello Mates,

Long story short, I had a smartEvent VM taking dust in R80.10, still configured in a R77.30 old CMA not in use anymore.

I’ve upgraded the VM in R81.10 and configured it in a new CMA (also in R81.10) as specified in the documentation https://sc1.checkpoint.com/documents/R81/WebAdminGuides/EN/CP_R81_LoggingAndMonitoring_AdminGuide/To... .

First, I couldn’t install the policy but the sk https://support.checkpoint.com/results/sk/sk113127 helped with it.

Now, policy is installed but I have the error message below while looking for the logs:
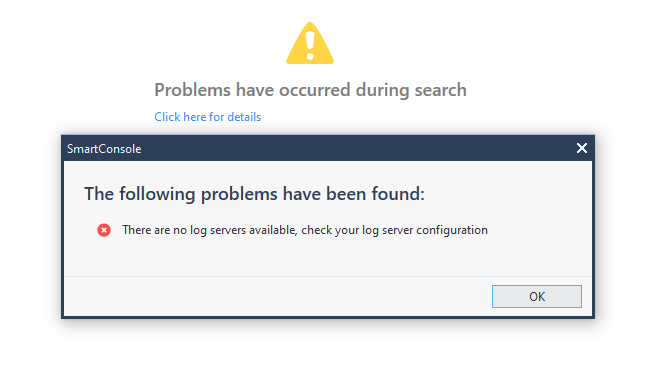
SEerror1.png

And in the CMA, the smartEvent object is in error with this message: “Error (CPSEMD not running)”

SEerror2.png

Management seems up and running on the VM, and the SmartEvent blades enable:

[Expert@SmartEvent:0]# /opt/CPsuite-R81.10/fw1/scripts/cpm_status.sh   

Check Point Security Management Server is running and ready


[Expert@SmartEvent:0]# evconfig

Please select the installation you would like to update

1) SmartReporter.                       (disabled, select to enable)

2) SmartEvent Server.                   (enabled, select to disable)

3) SmartEvent Correlation Unit.         (enabled, select to disable)

4) SmartEvent Intro.            (disabled, select to enable)

5) SmartEvent Intro Correlation Unit.   (enabled, select to disable)

Tried cpstop/cpstart and reboot but I keep having the error. cpsemd.elg is spammed with the messages below:

[CPSEMD 13615 4054460480]@SmartEvent[5 Feb 14:38:08] CDBConfiguration::RefreshStatus() - Failed to calculate available DB max size.
[CPSEMD 13615 4054460480]@SmartEvent[5 Feb 14:38:13] CRFLStatusFetcher::HandleResultFailed - CRFLStatusFetcher::HandleResult() - The reply from RFL is empty (status: 0)

Do you have a clue on what could be wrong with CPSEMD ?

Thanks!

0 Kudos
1 Solution

Accepted Solutions
Josh28
Contributor

Thank you all for your feedback.

The only drop I had was on the TCP/8211 port between the SmartEvent and the CMA. To the best of my knowledge, the port is not listed on the CheckPoint documentation so I hadn't opened it until now... and it works, logs are now collected by the smartEvent.

The port 8211 is mentioned in the comment on this thread too, so it seems to be needed for the smartEvent to work https://community.checkpoint.com/t5/Security-Gateways/R8x-Ports-Used-for-Communication-by-Various-Ch...

Now my quest continues, with the queries failing in the view/reports as show below:

SEerror3.png

I see core dump for the SOLR process:

[Expert@SmartEvent:0]# ls -l /var/log/dump/usermode/ | grep solr

-rw-rw---- 1 admin root 197655728 Feb  6 10:47 solr.23729.tar.gz

-rw-rw---- 1 admin root 409921130 Feb  6 10:35 solr.32750.tar.gz

I tried to disable and enable again log indexing (mentionned in this thread https://community.checkpoint.com/t5/Management/Database-Smartevent-Query-Failed/td-p/8630) but it doesn't change much.

I'll keep looking 😁

View solution in original post

0 Kudos
6 Replies
Lesley
Mentor Mentor
Mentor

If you come from an ancient version you need to make sure that the new ports are allowed by the policy. 

https://community.checkpoint.com/t5/Security-Gateways/R8x-Ports-Used-for-Communication-by-Various-Ch...

CPSEMD is for logging into the GUI. 

-------
If you like this post please give a thumbs up(kudo)! 🙂
0 Kudos
the_rock
Legend
Legend

I agree with @Lesley , sounds like config issue to me, specially if you did cpstop/cpstart and reboot.

Best,

Andy

0 Kudos
Josh28
Contributor

Thank you all for your feedback.

The only drop I had was on the TCP/8211 port between the SmartEvent and the CMA. To the best of my knowledge, the port is not listed on the CheckPoint documentation so I hadn't opened it until now... and it works, logs are now collected by the smartEvent.

The port 8211 is mentioned in the comment on this thread too, so it seems to be needed for the smartEvent to work https://community.checkpoint.com/t5/Security-Gateways/R8x-Ports-Used-for-Communication-by-Various-Ch...

Now my quest continues, with the queries failing in the view/reports as show below:

SEerror3.png

I see core dump for the SOLR process:

[Expert@SmartEvent:0]# ls -l /var/log/dump/usermode/ | grep solr

-rw-rw---- 1 admin root 197655728 Feb  6 10:47 solr.23729.tar.gz

-rw-rw---- 1 admin root 409921130 Feb  6 10:35 solr.32750.tar.gz

I tried to disable and enable again log indexing (mentionned in this thread https://community.checkpoint.com/t5/Management/Database-Smartevent-Query-Failed/td-p/8630) but it doesn't change much.

I'll keep looking 😁

0 Kudos
the_rock
Legend
Legend

Thats why Im thinking TAC may need to help you further if you are getting core dumps generated.

Best,

Andy

0 Kudos
Lesley
Mentor Mentor
Mentor

Try to make the scope smaller (1 hour). Now you are requesting data that is not there. This because logging only started to work recently. 

-------
If you like this post please give a thumbs up(kudo)! 🙂
Josh28
Contributor

Just to let you know that the last issue, "query failed", fixed itself after a few days when SOLR process stopped crashing.

TAC recommanded to change the heap size value just in case the issue occurs again if there is too much logs to handle.

0 Kudos

Leaderboard

Epsum factorial non deposit quid pro quo hic escorol.

Upcoming Events

    CheckMates Events