- Products
Network & SASE IoT Protect Maestro Management OpenTelemetry/Skyline Remote Access VPN SASE SD-WAN Security Gateways SmartMove Smart-1 Cloud SMB Gateways (Spark) Threat PreventionCloud Cloud Network Security CloudMates General CloudGuard - WAF Talking Cloud Podcast Weekly ReportsSecurity Operations Events External Risk Management Incident Response Infinity AI Infinity Portal NDR Playblocks SOC XDR/XPR Threat Exposure Management
- Learn
- Local User Groups
- Partners
- More

This website uses Cookies. Click Accept to agree to our website's cookie use as described in our Privacy Policy. Click Preferences to customize your cookie settings.
- Products
- AI Security
- Developers & More
- Check Point Trivia
- CheckMates Toolbox
- General Topics
- Products Announcements
- Threat Prevention Blog
- Upcoming Events
- Americas
- EMEA
- Czech Republic and Slovakia
- Denmark
- Netherlands
- Germany
- Sweden
- United Kingdom and Ireland
- France
- Spain
- Norway
- Ukraine
- Baltics and Finland
- Greece
- Portugal
- Austria
- Kazakhstan and CIS
- Switzerland
- Romania
- Turkey
- Belarus
- Belgium & Luxembourg
- Russia
- Poland
- Georgia
- DACH - Germany, Austria and Switzerland
- Iberia
- Africa
- Adriatics Region
- Eastern Africa
- Israel
- Nordics
- Middle East and Africa
- Balkans
- Italy
- Bulgaria
- Cyprus
- APAC
CheckMates Fest 2026
Join the Celebration!
AI Security Masters
E1: How AI is Reshaping Our World
MVP 2026: Submissions
Are Now Open!
What's New in R82.10?
Watch NowOverlap in Security Validation
Help us to understand your needs better
CheckMates Go:
Maestro Madness
Turn on suggestions
Auto-suggest helps you quickly narrow down your search results by suggesting possible matches as you type.
Showing results for
- CheckMates
- :
- Products
- :
- Network & SASE
- :
- Management
- :
- Creating reports with tracking "per connection"
Options
- Subscribe to RSS Feed
- Mark Topic as New
- Mark Topic as Read
- Float this Topic for Current User
- Bookmark
- Subscribe
- Mute
- Printer Friendly Page
Turn on suggestions
Auto-suggest helps you quickly narrow down your search results by suggesting possible matches as you type.
Showing results for
Are you a member of CheckMates?
×
Sign in with your Check Point UserCenter/PartnerMap account to access more great content and get a chance to win some Apple AirPods! If you don't have an account, create one now for free!
- Mark as New
- Bookmark
- Subscribe
- Mute
- Subscribe to RSS Feed
- Permalink
- Report Inappropriate Content
Creating reports with tracking "per connection"
Hi,
Is it possible to create views (and reports) solely based on logs based on "Track" configured "per connection" and not "per session"?
If yes, how? If not, why not?
Thanks.
18 Replies
- Mark as New
- Bookmark
- Subscribe
- Mute
- Subscribe to RSS Feed
- Permalink
- Report Inappropriate Content
Not sure on the report side, but I assume you'd want to make sure that you are not using Detailed or Extended logging for the relevant rules as these options will automatically consolidate logs.
Even when you use "Log" you should disable "per Session."
What's the problem you're trying to solve here?
- Mark as New
- Bookmark
- Subscribe
- Mute
- Subscribe to RSS Feed
- Permalink
- Report Inappropriate Content
I want to obtain reports with only the Firewall blade active. Views however only seem to display data based on the session logging (AppControl + URL Filtering blade), not connection log (Firewall blade).
- Mark as New
- Bookmark
- Subscribe
- Mute
- Subscribe to RSS Feed
- Permalink
- Report Inappropriate Content
You mean something like this?
- Mark as New
- Bookmark
- Subscribe
- Mute
- Subscribe to RSS Feed
- Permalink
- Report Inappropriate Content
Yeah but that doesn't work with ONLY the Firewall blade, does it?
The manual says this:
Generating a Network Activity Report
The Network Activity report shows important firewall connections. For example, top sources,
destinations, and services. To create this report, SmartEvent must first index the firewall logs.
To enable the Network Activity Report for R80.10 and higher Gateways:
In SmartConsole, in the Access Control Policy rule, add per Session to the Track settings
In any case the Firewall blade alone wouldn't be giving you rx/tx bytes, neither will it provide session tracking.
It would be great if one could produce reports when ONLY the firewall blade is active
1) source of most accepted connections
2) source of most rejected connections
3) destination of most rejected connections
4) destination with least number of accepted connections
etc.
- Mark as New
- Bookmark
- Subscribe
- Mute
- Subscribe to RSS Feed
- Permalink
- Report Inappropriate Content
Log + Accounting, to the best of my knowledge, does not require "Per Session" tracking.
That does not require App Control/URL Filtering (though on my system, I am using it).
And notice my filter only shows Firewall logs.
When you create a filter like I've shown and log with Accounting enabled, what do you see? (feel free to mask sensitive data)
Also, top talkers/blocked can be found easily enough just using the log viewer: Drop Logs Analyzer
- Mark as New
- Bookmark
- Subscribe
- Mute
- Subscribe to RSS Feed
- Permalink
- Report Inappropriate Content
Goto one of your views or reports and double-click on one of the bars of a histogram. It will take you to the actual log view:

(That is on an environment with AppControl enabled, which is why there was a result)
So I assume it will always filter by Sessions Only. Which is also what documentation states.
Therefore my question: Can you disable this?
Would be too bad if you couldn't create reports based on simple firewall / access control logs...
- Mark as New
- Bookmark
- Subscribe
- Mute
- Subscribe to RSS Feed
- Permalink
- Report Inappropriate Content
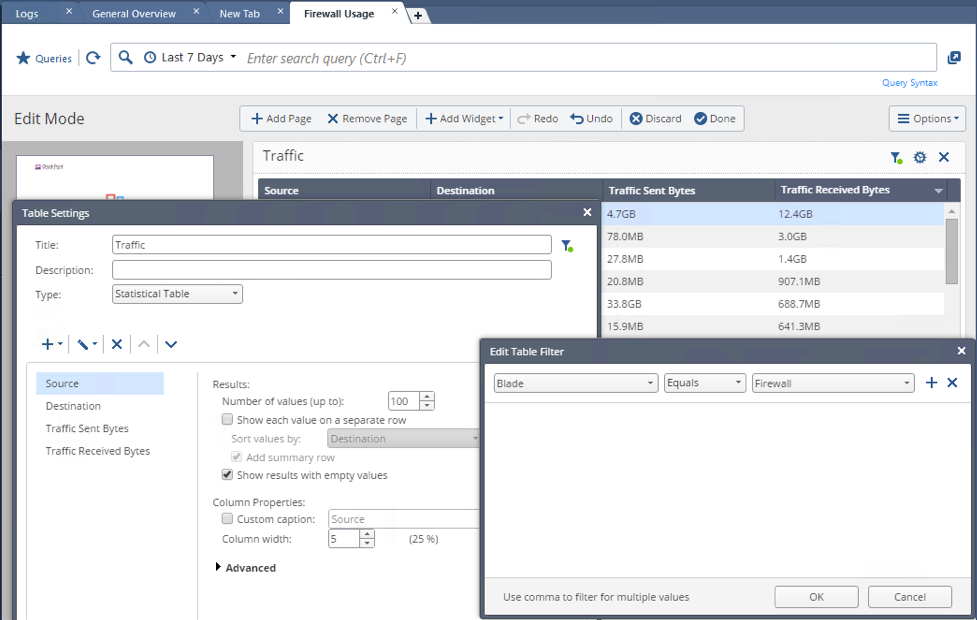
I built a brand new report rather than try and reuse any of the existing ones.
I changed one of my firewalls (running off a mirror port) to only use the Firewall blade.
The filters for this particular report are ONLY the Firewall blade and ONLY from this specific gateway.
I also made sure only to include logs since I changed the policy/blade configuration, which looks like the following:
The layer only has Firewall blade enabled and I'm only using regular logs with accounting enabled.
Sure enough, it's providing statistics:
I presume you can build your own report with whatever data/graphs you're looking for.
- Mark as New
- Bookmark
- Subscribe
- Mute
- Subscribe to RSS Feed
- Permalink
- Report Inappropriate Content
I'm not so sure.
To me it looks like you have to distinguish between the blade, the type of stuff it logs, and whether you've been using AppControl from the beginning or not.
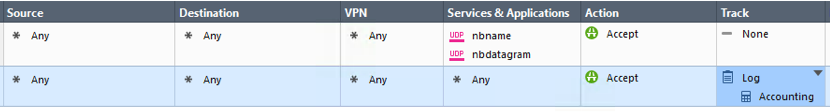
The firewall blade apparently can log both connection and session information. Session logging however either is not available or not enabled by default when using only the firewall blade. It's easy to check: Create a new policy with only access control enabled and only the firewall blade enabled. Add a rule, select "log" in the logging column, then right-click and select "More". You'll see Session logging is not activated there.
Once AppControl is enabled and a rule is added which contains some AppControl feature, session information is logged too.
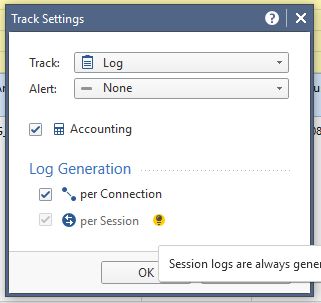
For other rules, you have to enable manually.
If you take a rulebase that already contains a rule logging session information (because AppControl was previously enabled), it will stay enabled. On the other hand, enabled AppControl does NOT enable session logging for all the rules that were created before AppControl was added. You'd have to go through all rules and enable by hand?
So make sure that the reports you're seeing are correct since some data might be missing for those rules were session logging is not enabled 😉
The question remains: Why would the product not allow to generate reports solely on connection (and not session) data? And why is this so obscure?
- Mark as New
- Bookmark
- Subscribe
- Mute
- Subscribe to RSS Feed
- Permalink
- Report Inappropriate Content
Probably because your exact use case wasn't considered.
I'm curious why this is a relevant metric but like, say, data transferred to/from a host is not (which can be done, as demonstrated).
Regardless of whether I understand the relevance of the use case or not, there does seem to be an issue.
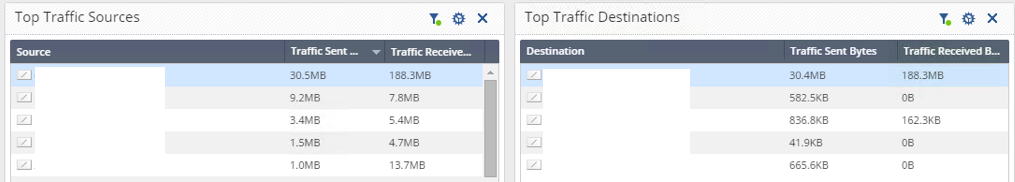
I was logging both sessions and connections, which I believe is required if you want accounting logs.
Clearly I've got Connection logs:

If you look off to the right, you'll see the top talkers.
Perhaps that's enough for you.
If you're trying to create a report saying host X initiated Y connections, I don't see a way to do this, or at least it's not working the way I would expect.
Maybe https://community.checkpoint.com/people/dados1c5b14ae-3a0e-30b3-8774-7305f45a41dc has an idea.
I'm creating a chart that looks like:

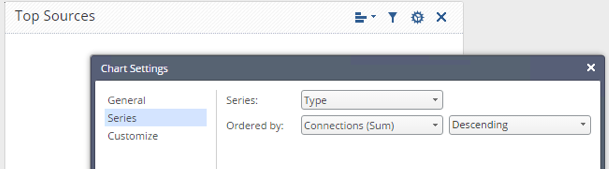
Which I would think would pull in all the connection logs, count them, and tell me how many times a source initiated a connection.
Instead, I get an empty result.
- Mark as New
- Bookmark
- Subscribe
- Mute
- Subscribe to RSS Feed
- Permalink
- Report Inappropriate Content
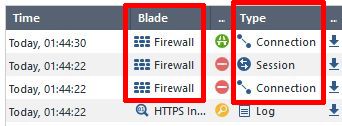
I guess the answer to that would answer my initial question. Let me illustrate again:
I tried defining a similar view as you did:
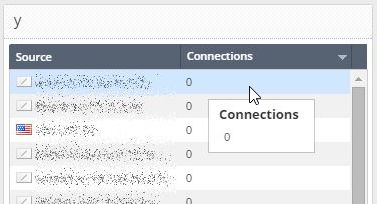
Now if you double-click on one of those rows (you'll have to get out of editing mode first), you'll see the filter constructed:

So it seems that it is implicitly ignoring connection data.
All I'm saying is that customers without the bright and shiny features enabled should also be able to pull stats (on the data they have).
- Mark as New
- Bookmark
- Subscribe
- Mute
- Subscribe to RSS Feed
- Permalink
- Report Inappropriate Content
You can pull stats, just not the specific one you're asking about.
Hopefully Kfir Dadosh can help clarify whether this is a bug or a feature.
Help us understand why the specific metric you're looking for (counting number of connections to or from host X) is even relevant.
- Mark as New
- Bookmark
- Subscribe
- Mute
- Subscribe to RSS Feed
- Permalink
- Report Inappropriate Content
Conversely I could ask why there is a connection log if infos about connections are deemed irrelevant.
I believe both metrics have their value.
Some prefer to look at "higher layer" information only (sessions), possibly because they don't understand what a connection is. Maybe I'm too old school and additionally don't understand what a "session" exactly is. However I prefer to know why certain people would generate a gazillion connections per day which would finally bring the firewall to a grinding halt while the other users do fine with only a fraction of that. Usually that is a sign of impending trouble that I'd like to see coming.
Most of all I'd want to proactively track outliers. That becomes difficult with sessions because that aggregation smoothes everything. Maybe it would reflect in a session count, maybe not. These reports may be great for management but not for the technicians.
- Mark as New
- Bookmark
- Subscribe
- Mute
- Subscribe to RSS Feed
- Permalink
- Report Inappropriate Content
The fact "connection" info is offered in the reports and you can't generate a report on it is an issue, agreed.
A "session" is really an aggregation of information about one or more connections (of either the TCP or the "virtual" UDP variety).
An obvious example is when you browse a website, it often requires multiple TCP connections to multiple servers to render a single web page.
Connections that occur over a given period of time (I believe within 15 minutes) are aggregated into a session and summarized.
This allows you to answer questions like "how long did Joe Roberts spend on Facebook and how much bandwidth did that waste."
I guess at a bits and bytes level, knowing the number of connections is useful.
- Mark as New
- Bookmark
- Subscribe
- Mute
- Subscribe to RSS Feed
- Permalink
- Report Inappropriate Content
Hi,
I tried adding a separate report regarding the logs for traffic sent/received and it wasn't working. Basically we would like to have a report which would show these statistics, prior to the upgrade (R77.30 -> 80.10) these were logged. We are running take_169 on the gateway cluster and logs are sent to management
On the report I added a table with src, dst ,traffic sent/received and traffic total. For some reason the report shows null for sent/received. Is this a bug or will it not work with active-active setup in R80.10? I've checked that there all log settings are in place and on tracking we've enabled log & accounting. Blades in use are IPS, App Control, Monitoring.
I noticed someone else has the same problem(link below)..Any ideas?
https://community.checkpoint.com/t5/Logging-and-Reporting/R80-10-traffic-bytes-not-logged/td-p/25005

- Mark as New
- Bookmark
- Subscribe
- Mute
- Subscribe to RSS Feed
- Permalink
- Report Inappropriate Content
Hi,
The simple reason why we cannot run reports on connections is scale. There are too many connections to be able to index them all.
Prior to R80.10 Gateway, in order to run reports on FW connections you should have activate the FW log correlation rule on the SmartEvent policy. Since we introduced the High Level Logs (Sessions) in R80.10, there is no need for the correlation unit, and the session can be created by simple activating the "per session". You don't need additional blade for it, and Firewall blade is sufficient for that matter.
Moreover, if one doesn't need the granularity of all the connections logs, he can keep only the "per session" track option.
Hope it is more clear now.
- Mark as New
- Bookmark
- Subscribe
- Mute
- Subscribe to RSS Feed
- Permalink
- Report Inappropriate Content
Thanks for your reply. Hmm, ok, but haven't the connection logs already been indexed since I can search them? Or does reporting require more/different indexing?
Anyway, if "sessions" are the way to go to have any kind of reporting at all, how would I enable session logging on my entire rulebase without having to go through each rule?
- Mark as New
- Bookmark
- Subscribe
- Mute
- Subscribe to RSS Feed
- Permalink
- Report Inappropriate Content
I've now updated our entire rulebase to log sessions using the Management API and using Python. We'll see what data this will give.
Here is how, in case someone needs to do the same (I'm not responsible if it goes wrong).
In any case, I'd suggest using a different account to perform the settings via the API, then Take Over that session from SmartDashboard and review the changes made.
If all ok, publish and install.
You may want to adapt
* the server name
* the layer name
* the rule-number range
(This is Python 3.4)
#!/usr/bin/python3
import requests, json, getpass, sys, time
import cpapi

if len(sys.argv)==2:
  sid = sys.argv[1]
else:
  user = input("Smartcenter User: ")
  password = getpass.getpass("Password: ")
  sid = cpapi.login(user, password)
print("Session id: " + sid)

for k in range(11,325):
  print()
  print ('------------------------- rule id: ' + str(k) + ' ----------------------------')
  print()
  req = {'layer': 'Unified',
    'rule-number': k,
    'track': {'per-session': True}}
  print(json.dumps(cpapi.api_call('set-access-rule', req, sid), indent=4, sort_keys=True))
  time.sleep(1)

cpapi.logout(sid)
And here is my "cpapi" module imported above (inspired from the Management API website)
#!/usr/bin/python3
import requests, json

def api_call(command, json_payload, sid):
  return _api_call('smartcenter', 443, command, json_payload, sid)

def _api_call(ip_addr, port, command, json_payload, sid):
  url = 'https://' + ip_addr + ':' + str(port) + '/web_api/' + command
  if sid == '':
    request_headers = {'Content-Type' : 'application/json'}
  else:
    request_headers = {'Content-Type' : 'application/json', 'X-chkp-sid' : sid}
  req = requests.post(url, data=json.dumps(json_payload), headers=request_headers, verify=False)
  #print(vars(req))
  return req.json()

def login(user, password):
  payload = {'user':user, 'password':password}
  response = api_call('login', payload, '')
  return response["sid"]

def logout(sid):
  response = api_call('logout', {}, sid)
  print (response)
- Mark as New
- Bookmark
- Subscribe
- Mute
- Subscribe to RSS Feed
- Permalink
- Report Inappropriate Content
Same issue for us, and nothing in the documentation specifies that you have to enable the per session option to get reports.
If you are not familial with Python like me, you can use the API commands and make a txt file with all the commands and load it.
The command are:
- show access-layers to get the layer name
- set access-rule rule-number 123 layer "My Layer" track.per.session True track.accounting True
Accounting also allows to get the volume of data in reports, not compatible with icmp.
You have to publish&insatll after that.
Leaderboard
Epsum factorial non deposit quid pro quo hic escorol.
| User | Count |
|---|---|
| 22 | |
| 13 | |
| 9 | |
| 6 | |
| 5 | |
| 5 | |
| 5 | |
| 5 | |
| 4 | |
| 4 |
Upcoming Events
Thu 08 Jan 2026 @ 05:00 PM (CET)
AI Security Masters Session 1: How AI is Reshaping Our WorldThu 22 Jan 2026 @ 05:00 PM (CET)
AI Security Masters Session 2: Hacking with AI: The Dark Side of InnovationThu 12 Feb 2026 @ 05:00 PM (CET)
AI Security Masters Session 3: Exposing AI Vulnerabilities: CP<R> Latest Security FindingsThu 26 Feb 2026 @ 05:00 PM (CET)
AI Security Masters Session 4: Powering Prevention: The AI Driving Check Point’s ThreatCloudThu 08 Jan 2026 @ 05:00 PM (CET)
AI Security Masters Session 1: How AI is Reshaping Our WorldThu 22 Jan 2026 @ 05:00 PM (CET)
AI Security Masters Session 2: Hacking with AI: The Dark Side of InnovationThu 26 Feb 2026 @ 05:00 PM (CET)
AI Security Masters Session 4: Powering Prevention: The AI Driving Check Point’s ThreatCloudAbout CheckMates
Learn Check Point
Advanced Learning
YOU DESERVE THE BEST SECURITY
©1994-2025 Check Point Software Technologies Ltd. All rights reserved.
Copyright
Privacy Policy
About Us
UserCenter