- Products
Network & SASE IoT Protect Maestro Management OpenTelemetry/Skyline Remote Access VPN SASE SD-WAN Security Gateways SmartMove Smart-1 Cloud SMB Gateways (Spark) Threat PreventionCloud Cloud Network Security CloudMates General CloudGuard - WAF Talking Cloud Podcast Weekly ReportsSecurity Operations Events External Risk Management Incident Response Infinity AI Infinity Portal NDR Playblocks SOC XDR/XPR Threat Exposure Management
- Learn
- Local User Groups
- Partners
- More

This website uses Cookies. Click Accept to agree to our website's cookie use as described in our Privacy Policy. Click Preferences to customize your cookie settings.
- Products
- AI Security
- Developers & More
- Check Point Trivia
- CheckMates Toolbox
- General Topics
- Products Announcements
- Threat Prevention Blog
- Upcoming Events
- Americas
- EMEA
- Czech Republic and Slovakia
- Denmark
- Netherlands
- Germany
- Sweden
- United Kingdom and Ireland
- France
- Spain
- Norway
- Ukraine
- Baltics and Finland
- Greece
- Portugal
- Austria
- Kazakhstan and CIS
- Switzerland
- Romania
- Turkey
- Belarus
- Belgium & Luxembourg
- Russia
- Poland
- Georgia
- DACH - Germany, Austria and Switzerland
- Iberia
- Africa
- Adriatics Region
- Eastern Africa
- Israel
- Nordics
- Middle East and Africa
- Balkans
- Italy
- Bulgaria
- Cyprus
- APAC
CheckMates Fest 2026
Join the Celebration!
AI Security Masters
E1: How AI is Reshaping Our World
MVP 2026: Submissions
Are Now Open!
What's New in R82.10?
Watch NowOverlap in Security Validation
Help us to understand your needs better
CheckMates Go:
Maestro Madness
Turn on suggestions
Auto-suggest helps you quickly narrow down your search results by suggesting possible matches as you type.
Showing results for
- CheckMates
- :
- Products
- :
- Network & SASE
- :
- Management
- :
- Re: CPViewer - visualize your cpview/cpinfo files ...
Options
- Subscribe to RSS Feed
- Mark Topic as New
- Mark Topic as Read
- Float this Topic for Current User
- Bookmark
- Subscribe
- Mute
- Printer Friendly Page
Turn on suggestions
Auto-suggest helps you quickly narrow down your search results by suggesting possible matches as you type.
Showing results for
Are you a member of CheckMates?
×
Sign in with your Check Point UserCenter/PartnerMap account to access more great content and get a chance to win some Apple AirPods! If you don't have an account, create one now for free!
- Mark as New
- Bookmark
- Subscribe
- Mute
- Subscribe to RSS Feed
- Permalink
- Report Inappropriate Content
Jump to solution
CPViewer - visualize your cpview/cpinfo files in 5 minutes
What is CPViewer?
CPViewer is an open-source community tool which simplifies the way to get a very detailed visual insights into:
1) Exported cpview histories with charts related to CPU, memory, connections and packet rates, throughputs, RX&TX drops etc. using the visualization metrics tool called Grafana;
2) OS analysis (.info file) - healthcheck (sk121447) report for "known issues" and "things not to miss";
The tool comes within an .ova (exported VM) with everything already preconfigured.
The main benefits are:
-
analyzing and identifying performance bottlenecks in minutes
-
user-friendly: just upload it to web-site (no docker or other components needed)
-
Integrated OS analysis tool for richer results (healthcheck script)
-
available to both customers and partners
CPViewer .ova file download - HERE.
CPViewer guide - HERE.
How to use it?
Video below explains all you need to do to get CPViewer up and running - 5 simple steps:
Written step by step guide:
1. Import the VM:
a. Download and import OVA image into your VMWare environment – DOWNLOAD LINK.
b. VM’s network adapter is set to NAT, it has IPv4 – 10.8.0.15, default gw – 10.8.0.2 and DNS – 8.8.8.8 predefined already, but you can adjust this by your needs;
c. Adjust your VMWare NAT adapter;
d. Credentials:
- OS: root/vpn123
- Grafana: admin/Vpn123!
*NOTE: Your VM must have internet access if you want to use GDrive download functionality.
2. Working with CPViewer portal:
a. CPViewer portal can process two types of data:
1) CPInfo files (contains cpinfo and cpview files) -> you will get 2 reports, grafana cpview insights and cpinfo OS analysis report (in separate tab);
2) CPView (.dat or .gz – with .dat in it) files only;
*NOTE: In case you are using type 1, please be aware that you need to either configure your browser to allow pop-ups for http://10.8.0.15:80 in order to get the CPInfo healthcheck report. Other option is just to go to http://10.8.0.15/healthcheck_reports manually and select a report you need.
b. After setting up the VM, open any browser and go to CPViewer portal -> http://10.8.0.15.
Select upload method:
1) Manual/attachment upload: you can submit .dat or .gz file (which contains .dat);
2) Google link (server will automatically download file from GDrive). In this case solid upload link is highly recommended;
*NOTE: You can pick one of the two methods, not both at the same time;
c. Enter customer`s name (this will be used for name db and datasource of cpview; d. Select version from which cpview was exported – R77.30 – R80.10 or R80.20+;
e. If you did all of the above, select the submit button and wait for your reports to get created;
*NOTE: Speed of the processing will depetend on the size of the file (upload time + querying/healthcheck.sh execution through the .dat/.info and taking all the relevant info).
3. After you get redirected to Grafana you will be able to see your cpview visualized through graphs focused on different parameters. In case you uploaded CPInfo file you will also get GW`s healthcheck report in a separate tab.
Few useful GrafanaUI details:
- Top left corner – selected datasource (datasources will automatically be deleted on weekly basis);
- On menu at the far left you will be able to see possible dashboards (do not need to be changed since everything related to your cpview is automatically provisioned);
- Top right corner – time span which we are looking into (this is also automatically set from the first to the last timestmmp from your cpview);
- When clicking on different views you will be able to adjust some parameters or queries according to your needs;
*NOTE: All datasources – their dbs and healthcheck reports are being automatically deleted every Monday at midnight. If you do not want this – enter crontab using command crontab – e from CLI, erase the camm of deleteALL.php and/or delete_hc.sh script/s and save it.
*DISCLAIMER - This open source tool is provided “As Is”. No representations or warranties are provided with the use of this tool.
110 Replies
- Mark as New
- Bookmark
- Subscribe
- Mute
- Subscribe to RSS Feed
- Permalink
- Report Inappropriate Content
Thanks for the graph, we can try to do something like this.
Can you share me the "root" "OID" to get this graph? And also we need the query to execute in Grafana
Remember we have a 64000 Chasis with a lot a lot of vlan in two bonds.
Thanks !!!!
- Mark as New
- Bookmark
- Subscribe
- Mute
- Subscribe to RSS Feed
- Permalink
- Report Inappropriate Content
root?
Within the platform, we are not getting any of the info based on OIDs.
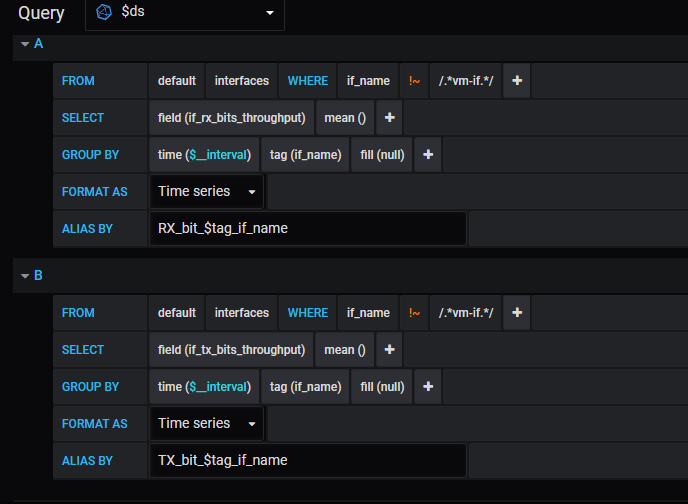
We are using the following query for extraction of interface name, RX and TX throughput from cpview.dat file:
sqlite3 -noheader -csv $DB "SELECT if_name,if_tx_bits_throughput,if_tx_packets_throughput,Timestamp FROM UM_STAT_UM_HW_UM_IF_TX_STATISTICS_TABLE WHERE if_name NOT LIKE 'TOTAL'"
Results example which query above returns attached.
In Grafana you are able to see the query if you go to "edit" button on "Interfaces throughput" (while having a graph populated) -> query ss attached.
- Mark as New
- Bookmark
- Subscribe
- Mute
- Subscribe to RSS Feed
- Permalink
- Report Inappropriate Content
Thanks again !!
With the Cpviewer can we get the information in time real? Historic its very useful but we need to know if can get boths
-------------------------------------------------------------------------------------------------------------------------
Offtopic (Sory but maybe you can help me):
We have a similar scenary but our Grafana get the information from SNMP Query to the firewall. We can get all the information from this method but the only we cant get the RIGHT information its about the Throughut/RX/TX Interfaces.We suspect from the "OID" but we are trying with a lot of them and the result its the same. I attach some files, maybe you can give some information to fix the problem.
Thanks very much!
- Mark as New
- Bookmark
- Subscribe
- Mute
- Subscribe to RSS Feed
- Permalink
- Report Inappropriate Content
Okay, I see. CPViewer is able to work only with historic cpview.dat files. You can`t get the real time info with the existing platform.
I understand what you`re going for and this is possible, but wouldn`t be much easier to have exported cpview.dat file for specific time period which you`re looking to examine ?? During that period you could do all the test you want, so after that you can simply use CPViewer to get the details which you want 🙂
- Mark as New
- Bookmark
- Subscribe
- Mute
- Subscribe to RSS Feed
- Permalink
- Report Inappropriate Content
How about skyline? That is a nice one
Thanks and Regards,
Blason R
CCSA,CCSE,CCCS
Blason R
CCSA,CCSE,CCCS
- Mark as New
- Bookmark
- Subscribe
- Mute
- Subscribe to RSS Feed
- Permalink
- Report Inappropriate Content
Why not involve TAC if this is an important issue ?
CCSP - CCSE / CCTE / CTPS / CCME / CCSM Elite / SMB Specialist
- Mark as New
- Bookmark
- Subscribe
- Mute
- Subscribe to RSS Feed
- Permalink
- Report Inappropriate Content
I tried that and it seems it is not possible to get RT info from cpview. I assume it doesn't write the RT info to the DB, only the history summary.
- Mark as New
- Bookmark
- Subscribe
- Mute
- Subscribe to RSS Feed
- Permalink
- Report Inappropriate Content
Nice tool @Petar_Markota .
I reported in my lab on vCenter and changed the IP accordingly to access it.
The tool is working perfectly fine, only the popup for the healthcheck reports are not working. Currently I have to open the path /healthcheck_reports manually. I don't see any popup being blocked as well. I tested with Chrome, Firefox and IE.
Any idea why?
- Mark as New
- Bookmark
- Subscribe
- Mute
- Subscribe to RSS Feed
- Permalink
- Report Inappropriate Content
Thank you Norbert, glad you like it!
Regarding the automatic pop-up - it should be configured in the browser. Browsers by default will not allow JS to do any new tab pop-ups.
For example in case of Google Chrome - go to settings (top right corner) -> in the search bar type pop-up and then go to pop-ups and redirects button -> there you can allow them. After that it should be working good.
- Mark as New
- Bookmark
- Subscribe
- Mute
- Subscribe to RSS Feed
- Permalink
- Report Inappropriate Content
You are right, I thought I would get a notification that the pop-up was blocked, but didn't. With the manual exception it is working 😉
- Mark as New
- Bookmark
- Subscribe
- Mute
- Subscribe to RSS Feed
- Permalink
- Report Inappropriate Content
Hi,
i have a quesion,
can you add a feature that generate report on remote GWs that i can choose from a list for a cpinfo/other supported files, and even schedule it so it runs automatically and send it to my email once a week?
i found this tool very helpful, but to run cpinfo everytime, and upload it manually through the web, gw after gw, seems a bit of overhead..
Thanks!
- Mark as New
- Bookmark
- Subscribe
- Mute
- Subscribe to RSS Feed
- Permalink
- Report Inappropriate Content
Hi Amir,
I`m not sure If I understand your question..
Writing you a DM on CheckMates.
- Mark as New
- Bookmark
- Subscribe
- Mute
- Subscribe to RSS Feed
- Permalink
- Report Inappropriate Content
This is the type of functionality that should be built into the platform not something where we have to make VMs export files do a bunch of things.
Dont get me wrong, this is helpful. But is should be built into the management station and something that could scale for people who have 1000+ gateways.
- Mark as New
- Bookmark
- Subscribe
- Mute
- Subscribe to RSS Feed
- Permalink
- Report Inappropriate Content
This is brilliant work. I've span this up on our VMware infrastructure and will be left running for the team to utilise.
Thank you for allowing the community to use it.
Thanks
Thank you for allowing the community to use it.
Thanks
- Mark as New
- Bookmark
- Subscribe
- Mute
- Subscribe to RSS Feed
- Permalink
- Report Inappropriate Content
Thanks a lot! 🙂
- Mark as New
- Bookmark
- Subscribe
- Mute
- Subscribe to RSS Feed
- Permalink
- Report Inappropriate Content
Hi Petar
Excellent work!
Any chance that this might be made available as a docker container?
D
- Mark as New
- Bookmark
- Subscribe
- Mute
- Subscribe to RSS Feed
- Permalink
- Report Inappropriate Content
Hi fwmeister,
Thank you 🙂
We are not planning to transfer it to the docker container anytime soon, but It should be relatively easy&quick if you want to do it.
Basically the whole frontend&backend is in /var/www/html/.
Other than copy/pasting this directory you would need to install Apache v2.4, PHP v7.3, SQLite3, Grafana v6.5.1, InfluxDB V1.7.9 Python3 and GDown v3.8.3. These are the version which are installed on current CPViewer release.
Regards,
Petar
- Mark as New
- Bookmark
- Subscribe
- Mute
- Subscribe to RSS Feed
- Permalink
- Report Inappropriate Content
Firstly I would like to thank everyone for making this tool available
I would like to point out that in this version in /var/www/html on the VM appliance there is an upload.php script.
If the ip address of the VM is not in the RFC1918 range the script jumps to here:
if(checkIP_range($client_ip) == true){
$ip = $local_IP;
}else{
$ip = "90.181.248.159";
}
The net effect is - when you browse to the appliance in this case and upload your data, the browser gets redirected to an external ip address and will not render any output
In my case I am using and RFC 6598 address and got caught by this.
I was able to modify the script to work around it.
Please be aware that depending on the IP address you assign to the VM (e.g., if it is a public IP address or CGNAT) you may have to make adjustments to upload.php also
- Mark as New
- Bookmark
- Subscribe
- Mute
- Subscribe to RSS Feed
- Permalink
- Report Inappropriate Content
Hi Andrew,
Since first deployment of the tool was in CP office in CZ this was hardcoded in order to allow our users to remotely (using VPN) connect to the Gateway, access the CPViewer which is running in the office and upload&analyze data without a need to install the tool in their own environment. There is no any kind of data exfiltration here.
If you go through the code you will see that there are 2 possible cases. The first one where if you are using private IP you are being redirected to that particular IP and second one if you are hosting the tool for people to use it remotely (in this case this hardcoded public IP would be changed to the one applicable for your case).
The tool was not released by Check Point (we mentioned this in the post) but it was rather an effort to make something which can be useful for people who need their cpviews/cpinfos analyzed.
Thank you for observation! I will remove the IP in the next release.
- Mark as New
- Bookmark
- Subscribe
- Mute
- Subscribe to RSS Feed
- Permalink
- Report Inappropriate Content
Thanks Petar,
I modified the upload.php file to add RFC6598 and was able to use the tool.
function checkIP_range($ip) {
$pri_addrs = array (
'10.0.0.0|10.255.255.255.255', // single class A network
'100.64.0.0|100.127.255.255', // RFC6598 <====
'172.16.0.0|172.31.255.255', // 16 contiguous class B network
'192.168.0.0|192.168.255.255', // 256 contiguous class C network
'169.254.0.0|169.254.255.255', // Link-local address also refered to as Automatic Priv$
'127.0.0.0|127.255.255.255', // localhost
);
- Mark as New
- Bookmark
- Subscribe
- Mute
- Subscribe to RSS Feed
- Permalink
- Report Inappropriate Content
Hello.
Very nice tool. Congratulations for building it. I am sure it took a lot of effort.
What I am really interested is the commands themselves. What are you running to get the info from cpview or the device itself (CLI)?
I would be interested to be able to pick specific attributes to get back values like the used & free memory and the cpu.
Are there any commands you used to get the info that can be run through cli? I don't mean to run cpview. I mean single commands that return the values not some binary that puts you in another screen.
I am trying to build something for my team at work and it's rather urgent.
Thank you.
Best Regards,
Yannis Theodoridis
- Mark as New
- Bookmark
- Subscribe
- Mute
- Subscribe to RSS Feed
- Permalink
- Report Inappropriate Content
Hi Yannis,
Thank you, glad you like it!
Here, we are only extracting specific info from cpview.dat files which we get from gateways.
If you want to check out how different parameters are being extracted -> /var/www/html/bash/CPview_influx77.sh&CPview_influx80.sh contain all the code regarding the queries which are applied on .dat files.
None of the CP commands are being used here.
- Mark as New
- Bookmark
- Subscribe
- Mute
- Subscribe to RSS Feed
- Permalink
- Report Inappropriate Content
If you are inserting the data in InfluxDB you are probably generating json data.
I was really looking for a quicker way to reach the data without deploying the tool.
I will give it a try if that's what you are saying. We are using 80.3 version.
- Mark as New
- Bookmark
- Subscribe
- Mute
- Subscribe to RSS Feed
- Permalink
- Report Inappropriate Content
The quickest way to reach data (from cpview.dat) is to query it out of the .dat file.
Here is an example of a query for CPU data and how it`s being passed to InfluxDB -> LINK
I would suggest using DBPlot to inspect the .dat tables structure and naming. From there you can figure out what exactly you need to query out in order to get the data you want.
- Mark as New
- Bookmark
- Subscribe
- Mute
- Subscribe to RSS Feed
- Permalink
- Report Inappropriate Content
Thanks so much for this - it's really useful as a partner, professional services consultant to have a tool like this available to us that's easy to use.
I have found an issue though, I cannot get any data from a cpinfo taken from an all-in-one R80.40 device. Same issue even after updating the JHF and the cpinfo build.
- Mark as New
- Bookmark
- Subscribe
- Mute
- Subscribe to RSS Feed
- Permalink
- Report Inappropriate Content
Hi Daniel,
I`m glad you find it useful!
All the cpinfo file analysis has been done by health check script - sk121447 (advanced access level required) which is integrated in CPViewer. Based on the SK mentioned - support for R80.40 version has been added in v7.09 while the CPViewer has v7.07 of HC integrated.
As a workaround for now I would do the analysis with the current version of health check script (v7.12 - download link is within sk121447).
Thanks for pointing this one out, I`ll update the download link with new version of health check script soon.
- Mark as New
- Bookmark
- Subscribe
- Mute
- Subscribe to RSS Feed
- Permalink
- Report Inappropriate Content
Hi @Petar_Markota, thanks for the effort of creating and sharing this great, powerful and very useful tool.
I was wondering if it can handle CPViewDB.dat created by R80.20SP (either Maestro and/or 64k SGMs).
Thanks again.
- Mark as New
- Bookmark
- Subscribe
- Mute
- Subscribe to RSS Feed
- Permalink
- Report Inappropriate Content
Hi @rrbranco ,
Thanks for the feedback! 😊
This depends on the DB structure of R80.20SP. In other words - in case R80.20SP has the same DB structure of the relevant tables like in R80.10-40 versions, then yes, it can be handled. I never tried this out on the CPViewDB.dat from R80.20SP so I'm not sure. If the DB structure of the parameters which we are querying is not the same (which is highly possible), then some adjustments need to be done in the queries which are being processed in "CPview_influx80.sh" bash script located within "/var/www/html/bash" directory. The best way would be comparing the queries from the "CPview_influx80.sh" to the DB structure of relevant parameters from R80.20SP's .dat (you can use DBPlot for this) and then change the queries from the script accordingly.
- Mark as New
- Bookmark
- Subscribe
- Mute
- Subscribe to RSS Feed
- Permalink
- Report Inappropriate Content
Hi Petar,
Thanks for the tool! I am going to have to play around with this a little more and see all it can do.
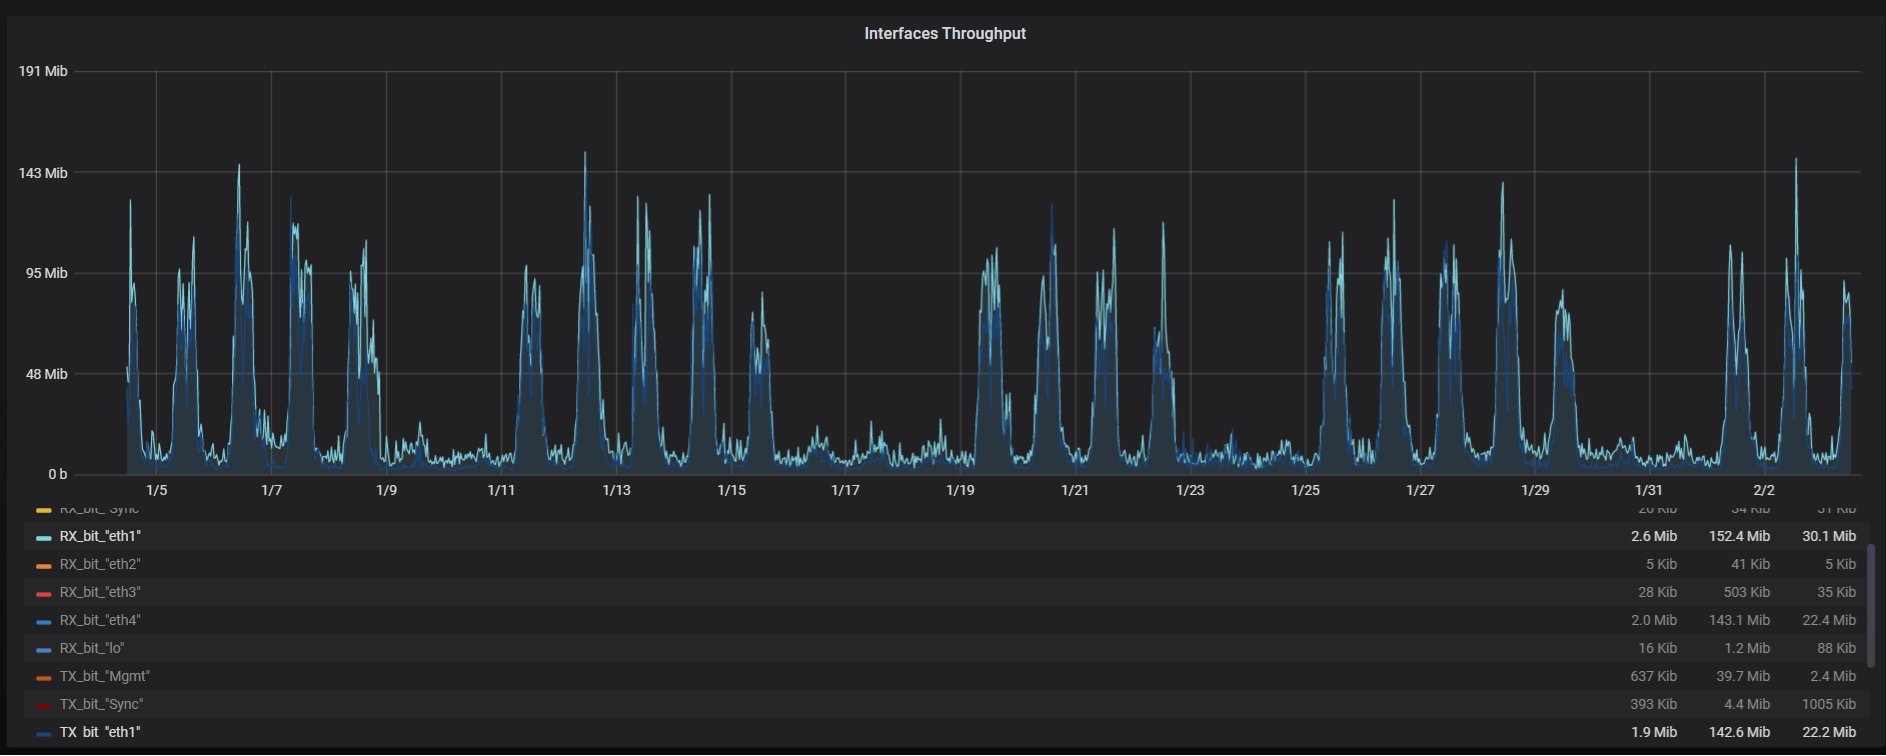
Just a quick question, is there a way for Mib measurement to be in Mbps or other measurements?
I probably just need to make sure I'm converting correctly. 143 Mib = is 149 Mbps but the ISP reports shows this number as 200 (Mbps, I believe), but the graph looks similar.
Thank you!
- Mark as New
- Bookmark
- Subscribe
- Mute
- Subscribe to RSS Feed
- Permalink
- Report Inappropriate Content
Leaderboard
Epsum factorial non deposit quid pro quo hic escorol.
| User | Count |
|---|---|
| 22 | |
| 13 | |
| 13 | |
| 6 | |
| 5 | |
| 5 | |
| 5 | |
| 5 | |
| 4 | |
| 4 |
Upcoming Events
Thu 08 Jan 2026 @ 05:00 PM (CET)
AI Security Masters Session 1: How AI is Reshaping Our WorldThu 22 Jan 2026 @ 05:00 PM (CET)
AI Security Masters Session 2: Hacking with AI: The Dark Side of InnovationThu 12 Feb 2026 @ 05:00 PM (CET)
AI Security Masters Session 3: Exposing AI Vulnerabilities: CP<R> Latest Security FindingsThu 26 Feb 2026 @ 05:00 PM (CET)
AI Security Masters Session 4: Powering Prevention: The AI Driving Check Point’s ThreatCloudThu 08 Jan 2026 @ 05:00 PM (CET)
AI Security Masters Session 1: How AI is Reshaping Our WorldThu 22 Jan 2026 @ 05:00 PM (CET)
AI Security Masters Session 2: Hacking with AI: The Dark Side of InnovationThu 26 Feb 2026 @ 05:00 PM (CET)
AI Security Masters Session 4: Powering Prevention: The AI Driving Check Point’s ThreatCloudAbout CheckMates
Learn Check Point
Advanced Learning
YOU DESERVE THE BEST SECURITY
©1994-2025 Check Point Software Technologies Ltd. All rights reserved.
Copyright
Privacy Policy
About Us
UserCenter