- Products
- Learn
- Local User Groups
- Partners
- More

This website uses Cookies. Click Accept to agree to our website's cookie use as described in our Privacy Policy. Click Preferences to customize your cookie settings.
- Products
- Learn
- Local User Groups
- Upcoming Events
- Americas
- EMEA
- Czech Republic and Slovakia
- Denmark
- Netherlands
- Germany
- Sweden
- United Kingdom and Ireland
- France
- Spain
- Norway
- Ukraine
- Baltics and Finland
- Greece
- Portugal
- Austria
- Kazakhstan and CIS
- Switzerland
- Romania
- Turkey
- Belarus
- Belgium & Luxembourg
- Russia
- Poland
- Georgia
- DACH - Germany, Austria and Switzerland
- Iberia
- Africa
- Adriatics Region
- Eastern Africa
- Israel
- Nordics
- Middle East and Africa
- Balkans
- Italy
- Bulgaria
- Cyprus
- APAC
- Partners
- More
- ABOUT CHECKMATES & FAQ
- Sign In
- Leaderboard
- Events
On-Premises SD-WAN Management
Register HereThe industry's first AI Network Firewall
Securing AI traffic, everywhere
AI Security Masters E8:
Claude Mythos: New Era in Cyber Security
CheckMates Go:
No Attack Required
Turn on suggestions
Auto-suggest helps you quickly narrow down your search results by suggesting possible matches as you type.
Showing results for
- CheckMates
- :
- Products
- :
- General Topics
- :
- Re: My Top 3 Check Point CLI commands
Options
- Subscribe to RSS Feed
- Mark Topic as New
- Mark Topic as Read
- Float this Topic for Current User
- Bookmark
- Subscribe
- Mute
- Printer Friendly Page
Turn on suggestions
Auto-suggest helps you quickly narrow down your search results by suggesting possible matches as you type.
Showing results for
Are you a member of CheckMates?
×
Sign in with your Check Point UserCenter/PartnerMap account to access more great content and get a chance to win some Apple AirPods! If you don't have an account, create one now for free!
- Mark as New
- Bookmark
- Subscribe
- Mute
- Subscribe to RSS Feed
- Permalink
- Report Inappropriate Content
My Top 3 Check Point CLI commands
Just had a fun geeky conversation with Dameon Welch Abernathy (AKA Phoneboy) Jony Fischbein , Jeff Schwartz and Michael Poublon (over 100 accumulated years of experience in Check Point products) , on what are our favorite & most useful commands in a Check Point environment.
Below are my 3 , plz add yours in the comments (we will do a poll for the top 5 after getting your feedback ... ).
1) fw ctl zdebug drop
used to quickly see all dropped connections and more importantly the reason (e.g. anti-spoofing, IPS , FW rule , ....)
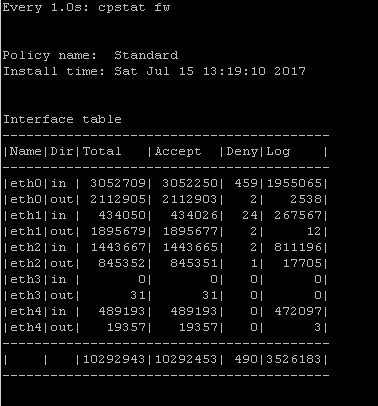
2) cpstat fw
quickly see stats of number of connections (accepted,denied,logged) with a breakdown
if the FW was under a high load i would usually run " watch --interval=1 'cpstat fw' " (would see a real-time to see the interface that is causing this)
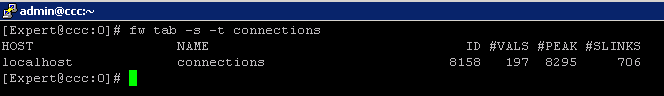
3) fw tab -s -t connections
allowed me to quickly see how much load is (and was i.e "peak" ) on the FW
that's it (i have more , but i want to hear yours ...)
plz add yours in the comments (we will do a poll for the top 5 after getting your feedback ... )
195 Replies
- Mark as New
- Bookmark
- Subscribe
- Mute
- Subscribe to RSS Feed
- Permalink
- Report Inappropriate Content
I love that hidden command! Why is it hidden? It is very helpful!
- Mark as New
- Bookmark
- Subscribe
- Mute
- Subscribe to RSS Feed
- Permalink
- Report Inappropriate Content
show routed cluster-state detailed is super useful! What do the columns "Cluster State SIGQUIT History " indicate? Because I've got a lot of entries!
- Mark as New
- Bookmark
- Subscribe
- Mute
- Subscribe to RSS Feed
- Permalink
- Report Inappropriate Content
>show asset all
from clish mode,
that shows information about system, disk, memory etc
- Mark as New
- Bookmark
- Subscribe
- Mute
- Subscribe to RSS Feed
- Permalink
- Report Inappropriate Content
I like this. I found that you can get the actual IP address in decimal format with this:
Destination
fw tab -u -t connections -f | awk -F\; '{ print $5 }' | sort -n | uniq -c | sort -nr | head -10
Source
fw tab -u -t connections -f | awk -F\; '{ print $3 }' | sort -n | uniq -c | sort -nr | head -10
- Mark as New
- Bookmark
- Subscribe
- Mute
- Subscribe to RSS Feed
- Permalink
- Report Inappropriate Content
Right, but as I noted in my original post with a very large connection table using -f can take a very long time and use up quite a bit of CPU in the process.
--
My book "Max Power: Check Point Firewall Performance Optimization"
now available via http://maxpowerfirewalls.com.
New Book: "Max Power 2026" Coming Soon
Check Point Firewall Performance Optimization
Check Point Firewall Performance Optimization
- Mark as New
- Bookmark
- Subscribe
- Mute
- Subscribe to RSS Feed
- Permalink
- Report Inappropriate Content
Using this scriptshowtable.sh - it shows statistics of the connections, fxw_cache and sam_blocked_ips tables you could simplify the previous queries:
1) fw tab -u -t connections | awk '{ print $2 }' | sort -n | uniq -c | sort -nr | head -10 by
./showtable.sh connections global list:20:s
2) List of hide NAT ports in use for all your NAT and sorted from top to down
./showtable.sh connections global list:20:lnm:203.0.113.1
if you don't include the <l> flag the scripts connects to the gateway to dump the database data
with the <l> flag, the script runs your query on the local data dumped the last time you run the script without the <l> flag
and you contrast the information of the connections table with the fwx_alloc table
./showtable.sh fwx_alloc global list:20:slm:203.0.113.1
Or you could get a table with all your NATs
./showtable.sh connections global list:20:ln
- Mark as New
- Bookmark
- Subscribe
- Mute
- Subscribe to RSS Feed
- Permalink
- Report Inappropriate Content
Whilst using the commands you detailed, I've got results I don't understand - hoping you or someone could help.
To put this in context, I have a busy proxy with a one-to-one NAT public IP and connecting to and internet service on HTTPs. The traffic is permitted one way and the internet service never initiates connection to my NAT IP.
Only the proxy uses this NAT and only the proxy connects to this internet service.
As expected, the internet service appears at the top of the top 10 sources:
[Expert@my-firewall:0]# fw tab -u -t connections |awk '{ print $2 }'|sort -n |uniq -c|sort -nr|head -10
24594 0a0b0c0d0e [sanitized HEX value of IP],
it's also the top value of the top 10 destinations:
[Expert@my-firewall:0]# fw tab -u -t connections | awk '{ print $4 }' | sort -n | uniq -c | sort -nr | head -10
16404 0a0b0c0d0e [sanitized HEX value of IP],
...and when I run the following to check, it looks to be roughly the sum of the source value and destination (accepting any discrepancy in the sum may be a result of the time taken to process the commands).
[Expert@my-firewall:0]# fw tab -u -t connections | grep -ci 0a0b0c0d0e [sanitized HEX value of IP],
39915
Running the same command to look at the HIDE NAT IP connections
[Expert@my-firewall:0]# fw tab -u -t connections | grep -ci 1a1b1c1d1e [sanitized HEX value of IP],
7942
Q.1 Why is there a difference between the number of source connections and destination connections
Q.2 Why don't I see a matching number when I examine the Hide NAT address
Thanks in advance.
- Mark as New
- Bookmark
- Subscribe
- Mute
- Subscribe to RSS Feed
- Permalink
- Report Inappropriate Content
First off, remember that every working connection that is NATted will be shown four separate times in the output of fw tab.
For question 2, do you have no-NATs or anti-NAT manual rules defined for DMZ access? That would explain why you don't see nearly as many connection flows referencing the NAT address as total connections coming from your proxy server.
For question 1, I'm wondering if you have a quantity of outbound NATed connection attempts by the proxy server to the Internet but they are not successfully connecting. In that case there would be two c2s source flows counted (one pre-NAT and one post-NAT), but no corresponding two s2c (destination) flows. Might explain the discrepancy between source and destination counts.
--
"IPS Immersion Training" Self-paced Video Class
Now Available at http://www.maxpowerfirewalls.com
New Book: "Max Power 2026" Coming Soon
Check Point Firewall Performance Optimization
Check Point Firewall Performance Optimization
- Mark as New
- Bookmark
- Subscribe
- Mute
- Subscribe to RSS Feed
- Permalink
- Report Inappropriate Content
I think I understand what you mean when you say that every working connection that is NAT'd will be shown four separate time in fw tab and I didn't take into consideration I was GREPing the target internet IP so would capture my internal and NAT sources there as well. - Thanks.
REF: Q2 - I do have no-NAT rules for access to and from the proxy for internally but I was GREPing based on target internet IP so didn't think fw tab would count those.
REF: Q1 - The concern that a quantity of connection attempts by the proxy server to the Internet are not successfully connecting is why I'm troubleshooting at this level but I have a packet capture running outside of the firewall and I'm seeing (almost) all SYNs leaving the firewall getting a SYN-ACK and going on to complete the HTTPS transactions.So what's leaving the firewall looks healthy. What I'm seeing from the Proxy point of view is unpredictable, intermittent times when the proxy cannot connect to the target and I see a flurry of "NAT Hide failure - there are currently no available ports for hide operation" (sometimes with log counts of up to 20,000 in a single second showing in the SmartLog Query Results Timeline).
As I have the dynamic NAT port allocation feature enabled and working, I wanted to understand the fw tab output to check I wasn't blowing the 50K limit and each time I've run the fw tab -u -t connections | grep -ci command, the result stays under 10,000 connections.
Thanks again for your help.
- Mark as New
- Bookmark
- Subscribe
- Mute
- Subscribe to RSS Feed
- Permalink
- Report Inappropriate Content
Based on that error message it would indicate that you are running out of Hide NAT ports somewhere, whether it is in the 10,000-60,000 range assigned to "regular" connections or some of the special NAT situations that utilize ports 60,001 through 65,536. If it is the 50k limit consider setting up a "many to fewer" hide NAT as I detail in this posting (and in my book):
R80.10 - Hide behind many question
For the special NAT situations north of port 60,000 (called "Extra" or "Global") see these SKs:
--
"IPS Immersion Training" Self-paced Video Class
Now Available at http://www.maxpowerfirewalls.com
New Book: "Max Power 2026" Coming Soon
Check Point Firewall Performance Optimization
Check Point Firewall Performance Optimization
- Mark as New
- Bookmark
- Subscribe
- Mute
- Subscribe to RSS Feed
- Permalink
- Report Inappropriate Content
1. cpview - Great tool to review statistics and history of your security devices. Constantly getting improved.
2. cpview - because it's so great
3. cpinfo -y all - because I remember how difficult it used to be, to get this information.
- Mark as New
- Bookmark
- Subscribe
- Mute
- Subscribe to RSS Feed
- Permalink
- Report Inappropriate Content
fw getifs - shows interfaces, IP addresses and subnet masks in quick easy format. I do this almost everytime I login to quickly orient myself.
gw-14cf1f> fw getifs
localhost eth0 203.0.113.2 255.255.255.0
localhost eth1 10.1.1.2 255.255.255.0
localhost eth2 192.168.12.2 255.255.255.0
fw ctl multik stat - shows multi-kernel connections and peak connections
gw-14cf1f> fw ctl multik stat
ID | Active | CPU | Connections | Peak
----------------------------------------------
0 | Yes | 0 | 4 | 6
1 | Yes | 0 | 2 | 17
ping 4.2.2.2 - ![]()
- Mark as New
- Bookmark
- Subscribe
- Mute
- Subscribe to RSS Feed
- Permalink
- Report Inappropriate Content
having fun to automate Check Point , easy ![]()
Check Point Packet Injector
The utility is executed on the Security Gateway, simulating packets arriving from the sender on their way to the target host. After the packets are sent, Packet Injector listens for response packets from the target host back to the sender passing through the Security Gateway, letting the user know they arrived.
(sk110865)
#./pinj --sport 3333 --dport 6666 -I eth1 10.10.10.10 22.22.22.22
CDT:
The Central Deployment Tool (CDT) is a utility that runs on an R77 / R77.X / R80 / R80.10 Security Management Server / Multi-Domain Security Management Server (running Gaia OS).
It allows the administrator to automatically install CPUSE Offline packages (Hotfixes, Jumbo Hotfix Accumulators (Bundles), Upgrade to a Minor Version, Upgrade to a Major Version) on multiple managed Security Gateways and Cluster Members at the same time.
(sk111158)
#./CentralDeploymentTool -generate Candidates_List.csv
VSX Provisioning Tool:
The VSX Provisioning Tool allows the VSX administrator to add and remove Virtual Devices (VS, VR, VSW), interfaces and routes from the command line of a Security Management Server / Multi-Domain Security Management Server. This allows the automation of the required VSX Provisioning operations in the environment.
(sk100645)
#./vsx_provisioning_tool -s localhost -u user -p pwd -o add vd name VSW1 vsx VSX1 type vsw
- Mark as New
- Bookmark
- Subscribe
- Mute
- Subscribe to RSS Feed
- Permalink
- Report Inappropriate Content
Gotta agree with the little-known packet injector tool (pinj), especially when used with the -D option. Can be a bit tricky properly crafting a sent packet to elicit a successful response, but well worth the effort.
--
My book "Max Power: Check Point Firewall Performance Optimization"
now available via http://maxpowerfirewalls.com.
New Book: "Max Power 2026" Coming Soon
Check Point Firewall Performance Optimization
Check Point Firewall Performance Optimization
- Mark as New
- Bookmark
- Subscribe
- Mute
- Subscribe to RSS Feed
- Permalink
- Report Inappropriate Content
pinj provides security device log file , you can monitor the logs ( CLI : sk118521 / SmartLog) to track action .
I use lea connection (FW1-Loggrabber download | SourceForge.net ) to verify response message and automate pinj ( CDT script mode / cprrid_util / API run script command/ Python command and etc.. )
- Mark as New
- Bookmark
- Subscribe
- Mute
- Subscribe to RSS Feed
- Permalink
- Report Inappropriate Content
Thx, never knew it existed !
https://www.linkedin.com/in/yurislobodyanyuk/
- Mark as New
- Bookmark
- Subscribe
- Mute
- Subscribe to RSS Feed
- Permalink
- Report Inappropriate Content
cpwd_admin start -name <application name> -path <executable path> -command <command line>
cpwd_admin stop -name <application name> [-path <executable path> -command <command line>
Great to get reset processes without cpstop/cpstart/reboot.
- Mark as New
- Bookmark
- Subscribe
- Mute
- Subscribe to RSS Feed
- Permalink
- Report Inappropriate Content
I had my team use these commands as a technical project lead to rebuilt a whole new redundant Provider-1 environment with 70 GWs for a financial (bank) org's project without a moment worth of any 'hiccup'/'downtime' even when all 70 GWs had to be 're-sic'd' to each of respective new CMAs. It was bank's pre-condition 'NO DOWNTIME'. I was at Verizon and these commands were given to us as part of a 'unsupported' solution which I thoroughly tested in a lab simulating bank's env. I had the support of an EXCELLENT Diamond engineer. The execution was flawless, took 24 hours and a team of 8 engineers in rotation but when it was finished, we got standing ovation from the bank and of course, from the Verizon management team. The bank still recognizes it as a legendary work. Hence, I love these commands and will give a you 'Celebration' badge for it :-)!
- Mark as New
- Bookmark
- Subscribe
- Mute
- Subscribe to RSS Feed
- Permalink
- Report Inappropriate Content
Rajeev - Just curious. What commands where you issuing to the remote gateway during your project?
- Mark as New
- Bookmark
- Subscribe
- Mute
- Subscribe to RSS Feed
- Permalink
- Report Inappropriate Content
I really like the fw unloadlocal command, it's saved my butt more times then not when I've accidentally blocked access via an incorrect FW policy. Also if you spend a lot of time administering remote GW's in far away places, this command plus the LOM console is basically a "get out of jail free" card, when it comes to saving you from a bad policy push.
If you use threat emulation and want to see a breakdown of files scanned by file type (helpful in tuning your TE policy) you can use: cpstat threat-emulation -f file_type_stat_file_scanned
And, while it may not be a CLISH command, my favorite Endpoint command has to be:
C:\Program Files (x86)\CheckPoint\Endpoint Security\EFR\cpefrcli.exe file:[filename.extension]
Because running manual forensic reports on various files to see how they're interacting with the OS is awesome.
- Mark as New
- Bookmark
- Subscribe
- Mute
- Subscribe to RSS Feed
- Permalink
- Report Inappropriate Content
I can't tell you how many times I've used fw unloadlocal (or it's predecessor fw unload localhost) over the last 20 years ![]()
I didn't realize you could run a manual forensics report on a file, that's pretty neat functionality! Nice work to https://community.checkpoint.com/people/arzile9338099-64b6-3d9b-be29-fc67dc1788f6 and his team!
- Mark as New
- Bookmark
- Subscribe
- Mute
- Subscribe to RSS Feed
- Permalink
- Report Inappropriate Content
manual forensics report:
R77.30.03 Endpoint Security Administration Guide 193-194
It is available since R77.20.02 : Aug-2016
Manual Analysis with CLI:
You can configure the Forensics blade to analyze incidents that are detected by a third party Anti-Malware solution. To use this, after an incident is triggered you can run analysis manually on the client computer or use a dedicated tool.
To run analysis manually on a client computer with CLI:
Use the command: C:\Program Files (x86)\CheckPoint\Endpoint Security\EFR\cpefrcli.exe <Type>:<Malicious resource> [options]
Examples:
1. C:\Program Files (x86)\CheckPoint\Endpoint Security\EFR\cpefrcli.exe file:c:\test\test.doc url:www.test.com -r
2. C:\Program Files (x86)\CheckPoint\Endpoint Security\EFR\cpefrcli.exe file:test.doc -r -q
3. C:\Program Files (x86)\CheckPoint\Endpoint Security\EFR\cpefrcli.exe ip:170.12.1.180 file:test.doc
4. C:\Program Files (x86)\CheckPoint\Endpoint Security\EFR\cpefrcli.exe HYPERLINK "url:www.Malicious.com" md5:10010010010010010010010010010010 -q -b c:\ backupToFile.txt
5. C:\Program Files (x86)\CheckPoint\Endpoint Security\EFR\cpefrcli.exe -b c:\backupToFile.txt
Notes:
1. All combination between optional parameters are allowed, the order is not important.
2. Backup option does not require Mandatory parameters (example 5).
- Mark as New
- Bookmark
- Subscribe
- Mute
- Subscribe to RSS Feed
- Permalink
- Report Inappropriate Content
a simple one.watch -d
for arp, df, du, session table, cluster state, endless usage.
grep is really useful ... and competitors doesn't have it ![]()
#massive import ![]()
set clienv on-failure continue
load configuration /home/admin/gaiaconfiguration
set clienv on-failure stop
save config
#lsof -i or netstat
For checking process networking communication.
- Mark as New
- Bookmark
- Subscribe
- Mute
- Subscribe to RSS Feed
- Permalink
- Report Inappropriate Content
Hi Moti,
instead of
watch --interval=1 cpstat fw"
you could simply use
cpstat fw -o 1
My favourites are:
[Expert@Management:0]# fw tab -t connections -s ClusterNode1 ClusterNode2
[Expert@Management:0]# cprlic print ClusterNode1
[Expert@Policyserver:0]# fw tab -t om_assigned_ips -f
[Expert@Firewall:0]# echo sh vr | iclid
One very interesting command is "nmon" followed by "l" (lowercase "L") for "Long-term CPU Usage". Try that and you will be astonished. The same is true for the letter "d" for disk usage. All the Switches are self-explanatory. ENJOY!
Yasushi
- Mark as New
- Bookmark
- Subscribe
- Mute
- Subscribe to RSS Feed
- Permalink
- Report Inappropriate Content
Unfortunately while nmon is a quite useful tool, Check Point has explicitly disclaimed support for it:
sk108122: Using the monitoring tool 'nmon' is not supported
--
My book "Max Power: Check Point Firewall Performance Optimization"
now available via http://maxpowerfirewalls.com.
New Book: "Max Power 2026" Coming Soon
Check Point Firewall Performance Optimization
Check Point Firewall Performance Optimization
- Mark as New
- Bookmark
- Subscribe
- Mute
- Subscribe to RSS Feed
- Permalink
- Report Inappropriate Content
Oh boy...
fw ctl zdebug is something that should not been even mentioned. It is a very nice debug macros for developers, thanks to Tamis Zegman, but not so much for production environment.
It is a very tempting and absolutely not best practices command. Sad part of the story is it becomes more and more popular. It is partially on you, Moti, lol.
I will be talking about kernel debug best practices on Sunday during CPET session, and some time is reserved for explaining zdebug use implications.
Detail are here, if you want to join: CCMA's blog: CPET session 3 - it is on!
- Mark as New
- Bookmark
- Subscribe
- Mute
- Subscribe to RSS Feed
- Permalink
- Report Inappropriate Content
To be fair Valeri, any debug command has the potential to create impact (see Heisenberg effect).
That said, fw ctl zdebug can be impactful if used improperly.
- Mark as New
- Bookmark
- Subscribe
- Mute
- Subscribe to RSS Feed
- Permalink
- Report Inappropriate Content
Correct.
However, the issue with this particular command is that it can be applied without any understanding of kernel debug and appropriate preparations. Same effect is hardly achievable if regular kernel debug process is applied.
That fact is mostly ignored, as this command pops up all over SecureKnowledge cases these days. This is negligence at best.
- Mark as New
- Bookmark
- Subscribe
- Mute
- Subscribe to RSS Feed
- Permalink
- Report Inappropriate Content
please don't confuse us with the facts 
- Mark as New
- Bookmark
- Subscribe
- Mute
- Subscribe to RSS Feed
- Permalink
- Report Inappropriate Content
lol, gotcha
Leaderboard
Epsum factorial non deposit quid pro quo hic escorol.
| User | Count |
|---|---|
| 13 | |
| 7 | |
| 5 | |
| 3 | |
| 2 | |
| 1 | |
| 1 | |
| 1 | |
| 1 | |
| 1 |
Upcoming Events
Tue 28 Jul 2026 @ 11:00 AM (EDT)
Under the Hood - Check Point and Illumio – Modern Network Defense Against AI-Based ThreatsWed 29 Jul 2026 @ 12:00 PM (SGT)
The AI Security Report 2026: A Turning Point for Enterprise Defense - SGTWed 29 Jul 2026 @ 02:00 PM (IDT)
The AI Security Report 2026: A Turning Point for Enterprise Defense - AMERWed 29 Jul 2026 @ 03:00 PM (CEST)
The AI Security Report 2026: A Turning Point for Enterprise Defense EMEATue 28 Jul 2026 @ 11:00 AM (EDT)
Under the Hood - Check Point and Illumio – Modern Network Defense Against AI-Based ThreatsWed 29 Jul 2026 @ 12:00 PM (SGT)
The AI Security Report 2026: A Turning Point for Enterprise Defense - SGTWed 29 Jul 2026 @ 02:00 PM (IDT)
The AI Security Report 2026: A Turning Point for Enterprise Defense - AMERWed 29 Jul 2026 @ 03:00 PM (CEST)
The AI Security Report 2026: A Turning Point for Enterprise Defense EMEAThu 30 Jul 2026 @ 10:00 AM (PDT)
AI Security Masters E12: READY OR NOT: Securing the AI Enterprise 4/5 - AI GatewayThu 20 Aug 2026 @ 08:30 AM (COT)
Medellin: Workspace Evolution: Hybrid Mesh Management - Visibilidad, Automatización e IAThu 20 Aug 2026 @ 06:00 PM (COT)
Medellin: Workspace Intelligence: IA Generativa en Acción para Equipos de SeguridadAbout CheckMates
Learn Check Point
Advanced Learning
YOU DESERVE THE BEST SECURITY

©1994-2026 Check Point Software Technologies Ltd. All rights reserved.
Copyright
Privacy Policy
About Us
UserCenter