- Products
- Learn
- Local User Groups
- Partners
- More

This website uses Cookies. Click Accept to agree to our website's cookie use as described in our Privacy Policy. Click Preferences to customize your cookie settings.
- Products
- Learn
- Local User Groups
- Upcoming Events
- Americas
- EMEA
- Czech Republic and Slovakia
- Denmark
- Netherlands
- Germany
- Sweden
- United Kingdom and Ireland
- France
- Spain
- Norway
- Ukraine
- Baltics and Finland
- Greece
- Portugal
- Austria
- Kazakhstan and CIS
- Switzerland
- Romania
- Turkey
- Belarus
- Belgium & Luxembourg
- Russia
- Poland
- Georgia
- DACH - Germany, Austria and Switzerland
- Iberia
- Africa
- Adriatics Region
- Eastern Africa
- Israel
- Nordics
- Middle East and Africa
- Balkans
- Italy
- Bulgaria
- Cyprus
- APAC
- Partners
- More
- ABOUT CHECKMATES & FAQ
- Sign In
- Leaderboard
- Events
On-Premises SD-WAN Management
Register HereThe industry's first AI Network Firewall
Securing AI traffic, everywhere
AI Security Masters E8:
Claude Mythos: New Era in Cyber Security
CheckMates Go:
No Attack Required
Turn on suggestions
Auto-suggest helps you quickly narrow down your search results by suggesting possible matches as you type.
Showing results for
- CheckMates
- :
- Products
- :
- General Topics
- :
- Re: My Top 3 Check Point CLI commands
Options
- Subscribe to RSS Feed
- Mark Topic as New
- Mark Topic as Read
- Float this Topic for Current User
- Bookmark
- Subscribe
- Mute
- Printer Friendly Page
Turn on suggestions
Auto-suggest helps you quickly narrow down your search results by suggesting possible matches as you type.
Showing results for
Are you a member of CheckMates?
×
Sign in with your Check Point UserCenter/PartnerMap account to access more great content and get a chance to win some Apple AirPods! If you don't have an account, create one now for free!
- Mark as New
- Bookmark
- Subscribe
- Mute
- Subscribe to RSS Feed
- Permalink
- Report Inappropriate Content
My Top 3 Check Point CLI commands
Just had a fun geeky conversation with Dameon Welch Abernathy (AKA Phoneboy) Jony Fischbein , Jeff Schwartz and Michael Poublon (over 100 accumulated years of experience in Check Point products) , on what are our favorite & most useful commands in a Check Point environment.
Below are my 3 , plz add yours in the comments (we will do a poll for the top 5 after getting your feedback ... ).
1) fw ctl zdebug drop
used to quickly see all dropped connections and more importantly the reason (e.g. anti-spoofing, IPS , FW rule , ....)
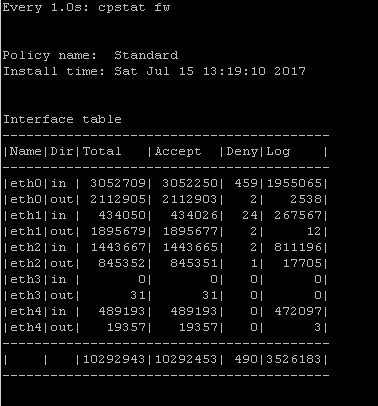
2) cpstat fw
quickly see stats of number of connections (accepted,denied,logged) with a breakdown
if the FW was under a high load i would usually run " watch --interval=1 'cpstat fw' " (would see a real-time to see the interface that is causing this)
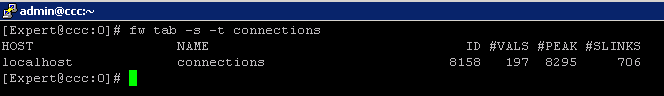
3) fw tab -s -t connections
allowed me to quickly see how much load is (and was i.e "peak" ) on the FW
that's it (i have more , but i want to hear yours ...)
plz add yours in the comments (we will do a poll for the top 5 after getting your feedback ... )
195 Replies
- Mark as New
- Bookmark
- Subscribe
- Mute
- Subscribe to RSS Feed
- Permalink
- Report Inappropriate Content
Some useful ones:
1. fw ctl pstat
2. cphaprob stat
- Mark as New
- Bookmark
- Subscribe
- Mute
- Subscribe to RSS Feed
- Permalink
- Report Inappropriate Content
cphparob stat is my favorite and fw ctl -d setsync start (this is a life savor when you try to bring up a fw and it keeps saying "down"
- Mark as New
- Bookmark
- Subscribe
- Mute
- Subscribe to RSS Feed
- Permalink
- Report Inappropriate Content
Here some:
- fwaccel stats -s
why? to check acceleration status on FW - cphaprob -a if
why? when troubleshooting cluster, i verify all interfaces are UP and the Virtual IP address for the cluster interfaces. - cpwd_admin list
why? great way to explain the CP watchdog- run the command with watch -d, and from another terminal terminate one of the PID, and observe how the watchdog bring it back.
and its also a great way to see that everything is up
- Mark as New
- Bookmark
- Subscribe
- Mute
- Subscribe to RSS Feed
- Permalink
- Report Inappropriate Content
cphaprob stat
Cpview
Top
- Mark as New
- Bookmark
- Subscribe
- Mute
- Subscribe to RSS Feed
- Permalink
- Report Inappropriate Content
cpview -t
I use this often to review mem, core usage at any snapshot in time. When getting a checkup device back or reviewing a DAT file.
example: cpview -t Oct 2 14:02:00
use + / - keys to advance forward or backwards in 1 minute increments.
- Mark as New
- Bookmark
- Subscribe
- Mute
- Subscribe to RSS Feed
- Permalink
- Report Inappropriate Content
Over 20 years, I've probably forgotten more CLI commands than I remember at this point ![]()
But here are a few of the ones I still use from time to time:
fw stat
Shows what policy is loaded on the current gateway and what interfaces it has seen traffic on.
If it's DefaultFilter, then your gateway isn't running a real policy and is probably blocking all traffic ![]()
Example:
[Expert@oscar:0]# fw stat
HOST POLICY DATE
localhost IntFW 18Jul2017 19:11:16 : [>eth0] [<eth0] [>eth1] [<eth1] [>eth2] [<eth2]
fw fetch mastername
Fetches the policy from the management station named mastername. You can also use localhost as a way to reload the previously installed policy on the gateway. Note this is not to be confused with fw fetchlocal -d directory which is used in troubleshooting policy installation issues.
push_cert –s Cust_CMA –u admin –p adminpw –o examplegw –k test123
This is probably a command you haven't seen before and there's not even a public SK on it ![]()
It is used on the management to establish SIC with a newly installed security gateway without using SmartConsole or SmartDashboard, making it extremely useful in automation scenarios.
Arguments are as follows:
| Switch | Description |
|---|---|
| –s Cust_CMA | Management or CMA IP/hostname (can be localhost) |
| –u admin | Username of admin user in SmartConsole/SmartDashboard |
| –p adminpw | Password of admin user specified above |
| –o examplegw | Name (in SmartConsole/SmartDashboard) of gateway to establish SIC with |
| –k test123 | SIC one-time-password (should match what was specified on the gateway during first-time wizard) |
Looking forward to see what everyone else comes up with.
- Mark as New
- Bookmark
- Subscribe
- Mute
- Subscribe to RSS Feed
- Permalink
- Report Inappropriate Content
back in the mid 1990's a client asked me to help them add changes to their firewall. That was the first time I saw checkpoint.
the client had no license, another contractor had install Checkpoint and, with the clients money, put the license in his own name. Well I hacked and searched and came across a guy calling himself PhoneBoy. on your site I learned what I needed to know. Over the years I got a checkpoint certification, then moved away from firewalls for a few years and now I'm back to 100% networking. I sure am glad to see you still here... god bless
- Mark as New
- Bookmark
- Subscribe
- Mute
- Subscribe to RSS Feed
- Permalink
- Report Inappropriate Content
config_system - never having to use the FTW via web browser ![]()
any clish command - ability to completely script the configuration of an appliance
upgrade_export/ migrate export - best backup method - easiest to recover when you have it!
- Mark as New
- Bookmark
- Subscribe
- Mute
- Subscribe to RSS Feed
- Permalink
- Report Inappropriate Content
1) cphaprob state / cphaprob -a if / cphaprob -l list
To view Cluster health status
2) cpview (with top)
To troubleshoot gateway performance (cpu, memory, connections,...)
3) cpwd_admin list
To check the CP process status
4) fw ctl zdebug drop
To search for any "silent" drop (such as IPS)
5) fw monitor
To do a live packet capture
- Mark as New
- Bookmark
- Subscribe
- Mute
- Subscribe to RSS Feed
- Permalink
- Report Inappropriate Content
1. mgmt_cli show groups Check Point - Management API reference
2. mgmt_cli add access-rule Check Point - Management API reference
3. mgmt_cli install-policy Check Point - Management API reference

- Mark as New
- Bookmark
- Subscribe
- Mute
- Subscribe to RSS Feed
- Permalink
- Report Inappropriate Content
I would expect you to pick management commands ![]()
- Mark as New
- Bookmark
- Subscribe
- Mute
- Subscribe to RSS Feed
- Permalink
- Report Inappropriate Content
Tomer Sole Dameon Welch Abernathy
show diff between dates:
mgmt_cli show changes from-date "2017-02-01T08:20:50" to-date "2017-02-21" --format jsonshow unused objects:
mgmt_cli show unused-objects offset 0 limit 50 details-level "standard" --format jsonrun script:
mgmt_cli run-script script-name "ifconfig" script "ifconfig" targets.1 "corporate-gateway" --format json
- Mark as New
- Bookmark
- Subscribe
- Mute
- Subscribe to RSS Feed
- Permalink
- Report Inappropriate Content
Surprised no one picked 'cp_merge'
And also though not a part of Gaia/splat
ofiller /odumper by Martin Hoz saved me precious hours in long nights
Valeri Loukine curious , what's yours ?
- Mark as New
- Bookmark
- Subscribe
- Mute
- Subscribe to RSS Feed
- Permalink
- Report Inappropriate Content
Did you know? cp_merge was dropped in R80 and above and replaced with the much more capable:
- import_export_package Python tool for exporting/importing a policy package or parts of it
- import_export_objects Python tool for exporting types of objects from the management server
- command-line support for gradually upgrading globally assigned domains is there an easy way to upgrade large-scale environments to R80.10?
- Mark as New
- Bookmark
- Subscribe
- Mute
- Subscribe to RSS Feed
- Permalink
- Report Inappropriate Content
Hard to pick just 3, I am afraid.
Lately using mostly those:
1. watch cphaprob stat
2. vsx stat - l
3. cphaprob -a list
- Mark as New
- Bookmark
- Subscribe
- Mute
- Subscribe to RSS Feed
- Permalink
- Report Inappropriate Content
fw ctl affinity -l -v -r
multik stat + cphaprob stat
cplic print
cpview
fw ctl zdebug drop
- Mark as New
- Bookmark
- Subscribe
- Mute
- Subscribe to RSS Feed
- Permalink
- Report Inappropriate Content
Peter Sandkuijl what does the first one achieve?
- Mark as New
- Bookmark
- Subscribe
- Mute
- Subscribe to RSS Feed
- Permalink
- Report Inappropriate Content
fw ctl affinity -l -v -r is a useful command when you're attempting to finetune the affinity of an IRQ to an interface. This is especially useful when looking at the amount of traffic received by an interface that deserves more "horsepower" and should not be sharing CPU time with other interfaces. This command will list what interface is connected to what IRQ to what core. "fw ctl affinity -s" will subsequently allow you to set the values.
Note that Multi Queue enabled interfaces will not show up as they are assigned "automagically"
- Mark as New
- Bookmark
- Subscribe
- Mute
- Subscribe to RSS Feed
- Permalink
- Report Inappropriate Content
plus
netstat -ni - check drop on interfaces;
and
ps axwf -o pid,cpuid,pcpu,pmem,time,comm - processes and daemons utilization by cpu-core, mem;
it's all for multicore performance tuning.
regards,
--
ak.
- Mark as New
- Bookmark
- Subscribe
- Mute
- Subscribe to RSS Feed
- Permalink
- Report Inappropriate Content
I will prefer below commands.
fw ctl zdebug drop
cpview
fw tab -s -t connections
fw ctl pstat
- Mark as New
- Bookmark
- Subscribe
- Mute
- Subscribe to RSS Feed
- Permalink
- Report Inappropriate Content
1. cpstat mg - (SMS/CMA) Shows connected clients and status.
2. cpstat ha -f all - (GW) Shows sync details.
3. cpstat blades - (GW) Shows packets accepted, dropped, peak connections, and top rule hits.
- Mark as New
- Bookmark
- Subscribe
- Mute
- Subscribe to RSS Feed
- Permalink
- Report Inappropriate Content
- Mark as New
- Bookmark
- Subscribe
- Mute
- Subscribe to RSS Feed
- Permalink
- Report Inappropriate Content
This command allowed me to execute commands, transfer files etc with a remote gateway without needing credentials. I was able to use it to copy a new shadow file to the remote gateway when password was lost/corrupted.
cprid_util (--help)
- Mark as New
- Bookmark
- Subscribe
- Mute
- Subscribe to RSS Feed
- Permalink
- Report Inappropriate Content
I found that if the remote gateway is not running the cprid process, this will not work.
At remote host, do to check and enable, if not running.
[Expert@xxxxx]# netstat -an|grep 18208
[Expert@xxxxx]# $CPDIR/bin/cpridstart
cpridstart: Starting cprid
[1] 11285
[Expert@xxxxx]# netstat -an|grep 18208
tcp 0 0 0.0.0.0:18208 0.0.0.0:* LISTEN
- Mark as New
- Bookmark
- Subscribe
- Mute
- Subscribe to RSS Feed
- Permalink
- Report Inappropriate Content
1) I created a "watch" command with many tecli commands to monitor TE (deployed on Cloud) live emulations:
watch -d -n 1 "echo \_______________________;echo TE Engine Status:;echo \_______________________;tecli control status;tecli show statistics | grep -E '(engine version is)';echo;echo \_______________________;echo VM Cloud Images;echo \_______________________;tecli ca du al | grep -E '(Image UID)';echo;echo \_______________________;echo Live Cloud Queue:;echo \_______________________;tecli show cloud queue;echo;echo \_______________________;echo History Malicious:;echo \_______________________;echo;tecli ca du al | grep -E '(-----|sha1|malicious)';echo;echo \_______________________;echo TE Cloud Quota Stats:;echo \_______________________;tecli show statistics | grep -E '(day)';echo .......................................................................................................;tecli show statistics | grep -E '(Scanned files:|static analysis|local cache|cloud cache|cloud process time)';echo .......................................................................................................;echo;tecli show cloud quota| grep -E '(Quota identifier|Quota subscription:|Usage for gw:|Remain:|Exceeded:)'"
The outcome would be something like this:

2) cpview
Definitely, the most complete clish command.
3) fw monitor
Very helpful debugging tool.
- Mark as New
- Bookmark
- Subscribe
- Mute
- Subscribe to RSS Feed
- Permalink
- Report Inappropriate Content
Lots of good ones so far, but just to be different the following commands are somewhat obscure but certainly come in handy occasionally (yes I'm well aware of the -f option for #1 and #2 but using it makes the commands take forever to execute):
1) fw tab -u -t connections | awk '{ print $2 }' | sort -n | uniq -c | sort -nr | head -10
This will show the top ten source IPs hogging slots in the connection table in descending order, however you will need to manually convert the IP addresses displayed from hex to decimal like so: 0a1e0b53 = 10.30.11.83. For the top 10 destinations, substitute $4 for $2 in the awk command above.
2) How many concurrent connections are currently using a particular Hide NAT address and how close are we to the 50k concurrent connection limit? Going over the 50k limit causes the new traffic to be dropped and the infamous "NAT Hide failure - there are currently no available ports for hide operation" message. Edit: The 50k limit can be surpassed by setting up what I call a "many to fewer" NAT, see my post in the following thread:
https://community.checkpoint.com/message/6516-r8010-hide-behind-many-question
Assume the Hide NAT address in question is 203.0.113.1:
fw tab -u -t connections | grep -ci cb007101
Divide the number reported by 2, and you have your answer. The result must be divided by 2 because each post-NATted connection is represented by 2 flows, one outbound (c2s) and one inbound (s2c). Also the NAT IP address must be converted from the dotted quad format to hexadecimal as shown.
3) show routed cluster-state detailed
An undocumented clish command introduced in R77.30 that shows a concise timeline of ClusterXL failover events in a single display. Very handy when trying to correlate unexpected ClusterXL failovers to external network events, or trying to determine if unexplained failovers occur with any suspicious regularity that may point to the real culprit. Definitely beats trying to pore through a sea of Control events (grey wrench icon) in the firewall logs!
--
My book "Max Power: Check Point Firewall Performance Optimization"
now available via http://maxpowerfirewalls.com.
New Book: "Max Power 2026" Coming Soon
Check Point Firewall Performance Optimization
Check Point Firewall Performance Optimization
- Mark as New
- Bookmark
- Subscribe
- Mute
- Subscribe to RSS Feed
- Permalink
- Report Inappropriate Content
Nice !
- Mark as New
- Bookmark
- Subscribe
- Mute
- Subscribe to RSS Feed
- Permalink
- Report Inappropriate Content
Nice indeed!
- Mark as New
- Bookmark
- Subscribe
- Mute
- Subscribe to RSS Feed
- Permalink
- Report Inappropriate Content
Gold as always. Tim!
Leaderboard
Epsum factorial non deposit quid pro quo hic escorol.
| User | Count |
|---|---|
| 16 | |
| 6 | |
| 5 | |
| 3 | |
| 2 | |
| 2 | |
| 1 | |
| 1 | |
| 1 | |
| 1 |
Trending Discussions
Upcoming Events
Tue 28 Jul 2026 @ 11:00 AM (EDT)
Under the Hood - Check Point and Illumio – Modern Network Defense Against AI-Based ThreatsWed 29 Jul 2026 @ 12:00 PM (SGT)
The AI Security Report 2026: A Turning Point for Enterprise Defense - SGTWed 29 Jul 2026 @ 02:00 PM (IDT)
The AI Security Report 2026: A Turning Point for Enterprise Defense - AMERWed 29 Jul 2026 @ 03:00 PM (CEST)
The AI Security Report 2026: A Turning Point for Enterprise Defense EMEATue 28 Jul 2026 @ 11:00 AM (EDT)
Under the Hood - Check Point and Illumio – Modern Network Defense Against AI-Based ThreatsWed 29 Jul 2026 @ 12:00 PM (SGT)
The AI Security Report 2026: A Turning Point for Enterprise Defense - SGTWed 29 Jul 2026 @ 02:00 PM (IDT)
The AI Security Report 2026: A Turning Point for Enterprise Defense - AMERWed 29 Jul 2026 @ 03:00 PM (CEST)
The AI Security Report 2026: A Turning Point for Enterprise Defense EMEAThu 30 Jul 2026 @ 10:00 AM (PDT)
AI Security Masters E12: READY OR NOT: Securing the AI Enterprise 4/5 - AI GatewayThu 20 Aug 2026 @ 08:30 AM (COT)
Medellin: Workspace Evolution: Hybrid Mesh Management - Visibilidad, Automatización e IAThu 20 Aug 2026 @ 06:00 PM (COT)
Medellin: Workspace Intelligence: IA Generativa en Acción para Equipos de SeguridadAbout CheckMates
Learn Check Point
Advanced Learning
YOU DESERVE THE BEST SECURITY

©1994-2026 Check Point Software Technologies Ltd. All rights reserved.
Copyright
Privacy Policy
About Us
UserCenter