- Products
Network & SASE IoT Protect Maestro Management OpenTelemetry/Skyline Remote Access VPN SASE SD-WAN Security Gateways SmartMove Smart-1 Cloud SMB Gateways (Spark) Threat PreventionCloud Cloud Network Security CloudMates General CloudGuard - WAF Talking Cloud Podcast Weekly ReportsSecurity Operations Events External Risk Management Incident Response Infinity AI Infinity Portal NDR Playblocks SOC XDR/XPR Threat Exposure Management
- Learn
- Local User Groups
- Partners
- More

This website uses Cookies. Click Accept to agree to our website's cookie use as described in our Privacy Policy. Click Preferences to customize your cookie settings.
- Products
- AI Security
- Developers & More
- Check Point Trivia
- CheckMates Toolbox
- General Topics
- Products Announcements
- Threat Prevention Blog
- Upcoming Events
- Americas
- EMEA
- Czech Republic and Slovakia
- Denmark
- Netherlands
- Germany
- Sweden
- United Kingdom and Ireland
- France
- Spain
- Norway
- Ukraine
- Baltics and Finland
- Greece
- Portugal
- Austria
- Kazakhstan and CIS
- Switzerland
- Romania
- Turkey
- Belarus
- Belgium & Luxembourg
- Russia
- Poland
- Georgia
- DACH - Germany, Austria and Switzerland
- Iberia
- Africa
- Adriatics Region
- Eastern Africa
- Israel
- Nordics
- Middle East and Africa
- Balkans
- Italy
- Bulgaria
- Cyprus
- APAC
CheckMates Fest 2026
Join the Celebration!
AI Security Masters
E1: How AI is Reshaping Our World
MVP 2026: Submissions
Are Now Open!
What's New in R82.10?
Watch NowOverlap in Security Validation
Help us to understand your needs better
CheckMates Go:
Maestro Madness
Turn on suggestions
Auto-suggest helps you quickly narrow down your search results by suggesting possible matches as you type.
Showing results for
- CheckMates
- :
- Products
- :
- Network & SASE
- :
- Management
- :
- Generate report on individual percentage usage of ...
Options
- Subscribe to RSS Feed
- Mark Topic as New
- Mark Topic as Read
- Float this Topic for Current User
- Bookmark
- Subscribe
- Mute
- Printer Friendly Page
Turn on suggestions
Auto-suggest helps you quickly narrow down your search results by suggesting possible matches as you type.
Showing results for
Are you a member of CheckMates?
×
Sign in with your Check Point UserCenter/PartnerMap account to access more great content and get a chance to win some Apple AirPods! If you don't have an account, create one now for free!
- Mark as New
- Bookmark
- Subscribe
- Mute
- Subscribe to RSS Feed
- Permalink
- Report Inappropriate Content
Jump to solution
Generate report on individual percentage usage of specific applications
Hey guys,
Apologies if this was answered before, but wondering if there is any way to generate report (on dedicated smart event server) that would clearly show % usage for say certain period (week, month, 3 months etc) for any given app people use? For example...teams, webex, jitsi, zoom and so on?
TAC is telling us thats not possible and I find it hard to believe.
If anyone has an idea/suggestion, would be appreciated, as always.
Thank you in advance!
Best,
Andy
Andy
3 Solutions
Accepted Solutions
- Mark as New
- Bookmark
- Subscribe
- Mute
- Subscribe to RSS Feed
- Permalink
- Report Inappropriate Content
I'm not sure it's exactly what you're looking for, but there is an out-of-the-box SmartEvent report for High Bandwidth Applications.
It looks like this:

If this doesn't cover what you need, can you clarify what else you'd like to see?
- Mark as New
- Bookmark
- Subscribe
- Mute
- Subscribe to RSS Feed
- Permalink
- Report Inappropriate Content
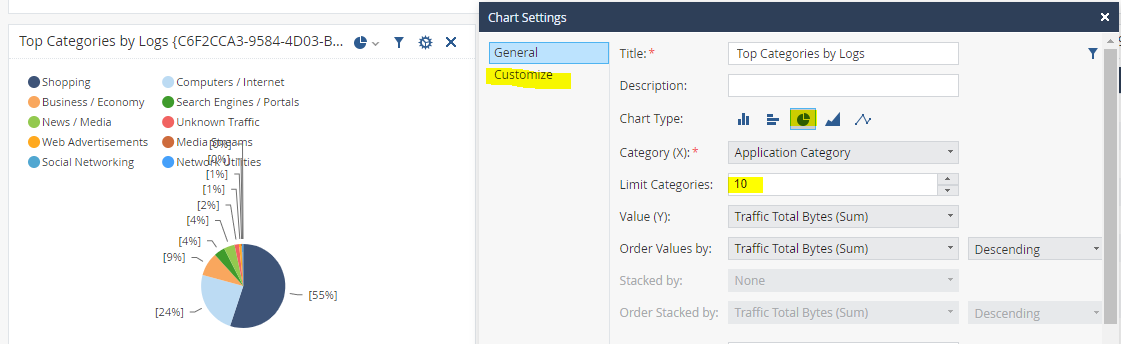
You can change chart type to pie chart and in the customize section you will be able to choose percentage.
But as @Tomer_Noy said, this data may be misleading, all 3 points he made are valid.
For the top application - you can try to keep the limit very high and this will cause to include most traffic. You can create an infographic widget to show you how many different applications are in use and keep the limit number above it. Another thing you check is the amount of traffic to the least used application and determine a number that above it all the contribution of those application are neglectable.
I think the better solution is doing this by category and check distribution inside leading categories.
Kind regards, Amir Senn
- Mark as New
- Bookmark
- Subscribe
- Mute
- Subscribe to RSS Feed
- Permalink
- Report Inappropriate Content
I did an experiment, you can extract the view from zip attached and import it.
I entered the filters for categories manually.
Kind regards, Amir Senn
22 Replies
- Mark as New
- Bookmark
- Subscribe
- Mute
- Subscribe to RSS Feed
- Permalink
- Report Inappropriate Content
Nearest thing i know of is the SMB report:

CCSP - CCSE / CCTE / CTPS / CCME / CCSM Elite / SMB Specialist
- Mark as New
- Bookmark
- Subscribe
- Mute
- Subscribe to RSS Feed
- Permalink
- Report Inappropriate Content
Man, that would be PERFECT if it can be done on regular mgmt (smart event)...
Andy
Best,
Andy
Andy
- Mark as New
- Bookmark
- Subscribe
- Mute
- Subscribe to RSS Feed
- Permalink
- Report Inappropriate Content
What about SmartView Access Control views and reports ?
CCSP - CCSE / CCTE / CTPS / CCME / CCSM Elite / SMB Specialist
- Mark as New
- Bookmark
- Subscribe
- Mute
- Subscribe to RSS Feed
- Permalink
- Report Inappropriate Content
My colleague worked with TAC on it and no luck.
Best,
Andy
Andy
- Mark as New
- Bookmark
- Subscribe
- Mute
- Subscribe to RSS Feed
- Permalink
- Report Inappropriate Content
I'm not sure it's exactly what you're looking for, but there is an out-of-the-box SmartEvent report for High Bandwidth Applications.
It looks like this:
If this doesn't cover what you need, can you clarify what else you'd like to see?
- Mark as New
- Bookmark
- Subscribe
- Mute
- Subscribe to RSS Feed
- Permalink
- Report Inappropriate Content
Thanks @Tomer_Noy , I believe that would suffice, BUT, any way to see those apps by % usage?
Best,
Andy
Andy
- Mark as New
- Bookmark
- Subscribe
- Mute
- Subscribe to RSS Feed
- Permalink
- Report Inappropriate Content
I checked a bit and couldn't find an option to show it by %, but anyway showing % could be misleading.
Is it a % of the presented top applications? (that is easy to calculate, but not sure that it's useful)
Is it a % of all application traffic? (could be confusing with rules that matched on the service without identifying the application)
Is it a % of all traffic going through the gateway? (we don't always know from the logs what is the total traffic since not all rules have accounting enabled, and the performance of such a query will be challenging)
I understand the benefit of showing %, but I'm not sure that we can do it accurately in such a case.
- Mark as New
- Bookmark
- Subscribe
- Mute
- Subscribe to RSS Feed
- Permalink
- Report Inappropriate Content
Hey Tomer,
Really appreciate your willingness and efforts here 🙌🙌
I will build R81.20 dedicated smart event today in the lab and see how far I get...will keep you posted.
Andy
Best,
Andy
Andy
- Mark as New
- Bookmark
- Subscribe
- Mute
- Subscribe to RSS Feed
- Permalink
- Report Inappropriate Content
You can change chart type to pie chart and in the customize section you will be able to choose percentage.
But as @Tomer_Noy said, this data may be misleading, all 3 points he made are valid.
For the top application - you can try to keep the limit very high and this will cause to include most traffic. You can create an infographic widget to show you how many different applications are in use and keep the limit number above it. Another thing you check is the amount of traffic to the least used application and determine a number that above it all the contribution of those application are neglectable.
I think the better solution is doing this by category and check distribution inside leading categories.
Kind regards, Amir Senn
- Mark as New
- Bookmark
- Subscribe
- Mute
- Subscribe to RSS Feed
- Permalink
- Report Inappropriate Content
- Mark as New
- Bookmark
- Subscribe
- Mute
- Subscribe to RSS Feed
- Permalink
- Report Inappropriate Content
Thats mate!! I like the name...the_rock view lol, good one 🙂
By the way, I assume you just exported the template from your lab?
Andy
Best,
Andy
Andy
- Mark as New
- Bookmark
- Subscribe
- Mute
- Subscribe to RSS Feed
- Permalink
- Report Inappropriate Content
Yes, imported from my lab. I can't attach files with CPR extension here so I archived it.
Kind regards, Amir Senn
- Mark as New
- Bookmark
- Subscribe
- Mute
- Subscribe to RSS Feed
- Permalink
- Report Inappropriate Content
Thanks again, great help from both of you, I learned a lot about this from all your responses. I dont deal sadly much with Smart event, so this is definitely great experience. I will talk to my colleague and once she logs into customer's environment, we will make changes you suggested and I will update. Again, super grateful for the help, as always 🙌🙌💪
Cheers,
Andy
Best,
Andy
Andy
- Mark as New
- Bookmark
- Subscribe
- Mute
- Subscribe to RSS Feed
- Permalink
- Report Inappropriate Content
We changed below and thats perfect...thank you! Quick question @Amir_Senn ...is there any way to actually also get % usage on applications customer wants to see, rather than default CP ones listed in the report? We changed limit to 30 apps from the settings, but not sure if thats only way?
Andy

Best,
Andy
Andy
- Mark as New
- Bookmark
- Subscribe
- Mute
- Subscribe to RSS Feed
- Permalink
- Report Inappropriate Content
I'm not sure I fully understood the question but I'll try to answer.
The widget will show top X results matching the query and filters. If you want to see only specific applications or hide specific applications I recommend adding them as filter to specific widgets or the entire report, depends on if you want to apply it on the entire view.
1. If you want to filter out some application, I suggest using right click and filtering out all the widgets you don't want to see, then copy the query line that was created by filtering out and add it as a custom filter to the widget/view, this will filter them out permanently.
2. If you want to filter in only specific applications you can either go the other way (filter in) or create a user category that includes all the application you want to see and use that category as a filter (which would be the easier way IMO).
Kind regards, Amir Senn
- Mark as New
- Bookmark
- Subscribe
- Mute
- Subscribe to RSS Feed
- Permalink
- Report Inappropriate Content
Thanks Amir, so that was my question, related to point 2 you made...where would you create such a filter? Thats what we could not figure out...
Cheers and tx again for all the help! 🙌
Andy
Best,
Andy
Andy
- Mark as New
- Bookmark
- Subscribe
- Mute
- Subscribe to RSS Feed
- Permalink
- Report Inappropriate Content
I tried to create custom application group but it doesn't filter it in SmartView so unfortunately the only sure thing I can think about at this moment is creating a long query like " appi_name:"app_name_1" AND "appi_name:"app_name_2" ... AND "appi_name:"app_name_n" " and then apply it as a custom filter.
There's another possible option, if they are all on the same rule in the rulebase you can filter by rule number. Most likely that in currently there are other applications on the same rule as well. In theory you can create a rule just before this rule and select all the desired applications on that rule and then filter by it. This could be risky so I don't necessarily recommend this.
Kind regards, Amir Senn
- Mark as New
- Bookmark
- Subscribe
- Mute
- Subscribe to RSS Feed
- Permalink
- Report Inappropriate Content
Hey @Amir_Senn ...I think we can close off this topic, my colleague gave customer report with all you guys provided us, so thats perfect. THANKS SO MUCH AGAIN 🙌🙌
Have a great weekend.
Andy
Best,
Andy
Andy
- Mark as New
- Bookmark
- Subscribe
- Mute
- Subscribe to RSS Feed
- Permalink
- Report Inappropriate Content
Hey @Tomer_Noy ...so I built brand new R81.20 dedicated smart event server, but this report is not there by default. I did this on esxi server, so not sure what I might be missing?
Cheers,
Andy
Best,
Andy
Andy
- Mark as New
- Bookmark
- Subscribe
- Mute
- Subscribe to RSS Feed
- Permalink
- Report Inappropriate Content
Nm, layer 8 issue on my end LOL...I found it, so let me work with my colleague that was helping them and see how far we get.
Tx again.
Andy
Best,
Andy
Andy
- Mark as New
- Bookmark
- Subscribe
- Mute
- Subscribe to RSS Feed
- Permalink
- Report Inappropriate Content
Just another quick update...my colleague and I tried high bandwidth report and showed absolutely nothing on customer's end. Not sure why, as we know there are bunch of applications consuming high bandwidth, so will verify with TAC.
Best,
Andy
Andy
- Mark as New
- Bookmark
- Subscribe
- Mute
- Subscribe to RSS Feed
- Permalink
- Report Inappropriate Content
K, had my colleague change this on customer's side and we get what you sent...THANK YOU!!

Best,
Andy
Andy
Leaderboard
Epsum factorial non deposit quid pro quo hic escorol.
| User | Count |
|---|---|
| 22 | |
| 14 | |
| 8 | |
| 7 | |
| 5 | |
| 5 | |
| 5 | |
| 5 | |
| 4 | |
| 4 |
Upcoming Events
Thu 08 Jan 2026 @ 05:00 PM (CET)
AI Security Masters Session 1: How AI is Reshaping Our WorldThu 22 Jan 2026 @ 05:00 PM (CET)
AI Security Masters Session 2: Hacking with AI: The Dark Side of InnovationThu 12 Feb 2026 @ 05:00 PM (CET)
AI Security Masters Session 3: Exposing AI Vulnerabilities: CP<R> Latest Security FindingsThu 26 Feb 2026 @ 05:00 PM (CET)
AI Security Masters Session 4: Powering Prevention: The AI Driving Check Point’s ThreatCloudThu 08 Jan 2026 @ 05:00 PM (CET)
AI Security Masters Session 1: How AI is Reshaping Our WorldThu 22 Jan 2026 @ 05:00 PM (CET)
AI Security Masters Session 2: Hacking with AI: The Dark Side of InnovationThu 26 Feb 2026 @ 05:00 PM (CET)
AI Security Masters Session 4: Powering Prevention: The AI Driving Check Point’s ThreatCloudAbout CheckMates
Learn Check Point
Advanced Learning
YOU DESERVE THE BEST SECURITY
©1994-2025 Check Point Software Technologies Ltd. All rights reserved.
Copyright
Privacy Policy
About Us
UserCenter