- Products
- Learn
- Local User Groups
- Partners
- More

This website uses Cookies. Click Accept to agree to our website's cookie use as described in our Privacy Policy. Click Preferences to customize your cookie settings.
- Products
- Learn
- Local User Groups
- Upcoming Events
- Americas
- EMEA
- Czech Republic and Slovakia
- Denmark
- Netherlands
- Germany
- Sweden
- United Kingdom and Ireland
- France
- Spain
- Norway
- Ukraine
- Baltics and Finland
- Greece
- Portugal
- Austria
- Kazakhstan and CIS
- Switzerland
- Romania
- Turkey
- Belarus
- Belgium & Luxembourg
- Russia
- Poland
- Georgia
- DACH - Germany, Austria and Switzerland
- Iberia
- Africa
- Adriatics Region
- Eastern Africa
- Israel
- Nordics
- Middle East and Africa
- Balkans
- Italy
- Bulgaria
- Cyprus
- APAC
- Partners
- More
- ABOUT CHECKMATES & FAQ
- Sign In
- Leaderboard
- Events
Stop Babysitting Rules.
Go Agentic
Step Into the Future of
AI-Powered Cyber Security
The State of Ransomware Q1 2026
Key Trends and Their Impact
AI Security Masters E8:
Claude Mythos: New Era in Cyber Security
Blueprint Architecture for Securing
The AI Factory & AI Data Center
Call For Papers
Your Expertise. Our Stage
CheckMates Go:
CheckMates Fest
Turn on suggestions
Auto-suggest helps you quickly narrow down your search results by suggesting possible matches as you type.
Showing results for
- CheckMates
- :
- Products
- :
- General Topics
- :
- Re: Problem with 5400 device after firmware upgrad...
Options
- Subscribe to RSS Feed
- Mark Topic as New
- Mark Topic as Read
- Float this Topic for Current User
- Bookmark
- Subscribe
- Mute
- Printer Friendly Page
Turn on suggestions
Auto-suggest helps you quickly narrow down your search results by suggesting possible matches as you type.
Showing results for
Are you a member of CheckMates?
×
Sign in with your Check Point UserCenter/PartnerMap account to access more great content and get a chance to win some Apple AirPods! If you don't have an account, create one now for free!
- Mark as New
- Bookmark
- Subscribe
- Mute
- Subscribe to RSS Feed
- Permalink
- Report Inappropriate Content
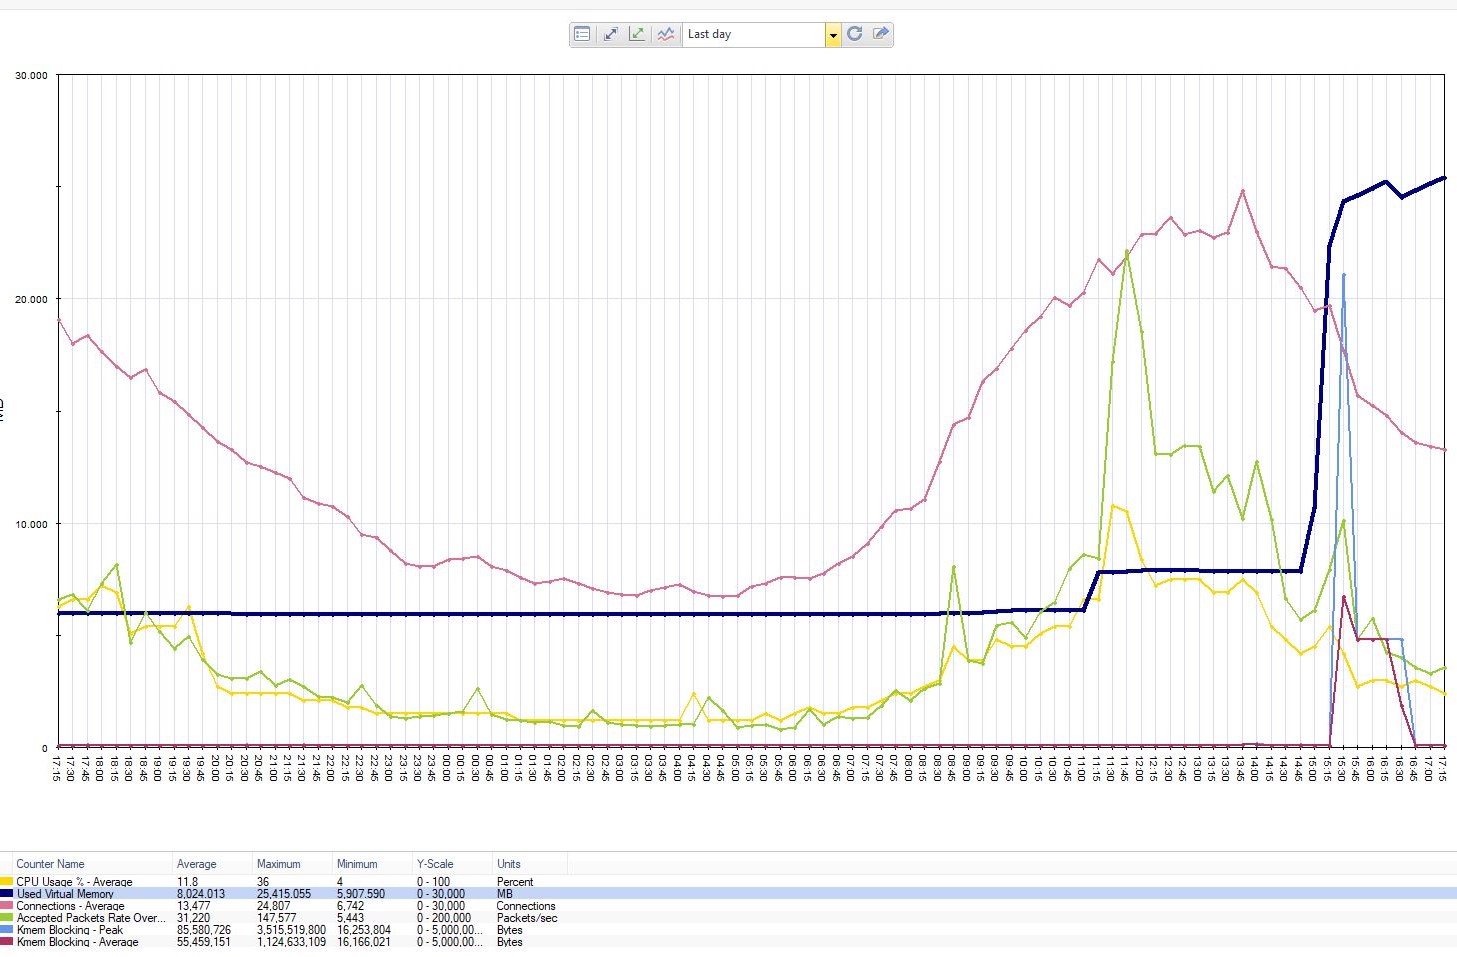
Problem with 5400 device after firmware upgrade to 80.30
Last sunday (22.09) we upgraded firmware on our Checkpoint 5400 to v.80.30 and this night (26.09) this device has stopped to respond. As we see on our monitoring software the device stopped to respond to Ping at 23:23 (local time), same time it had less than 1% of free physical memory. At 1:00 the device back online by itself with a 7% of free physical memory, and next we manually rebooted it at 2:40 with a 75% of memory free.
So, all pointing to a memory leak on this device after the upgrade, because no any problem with any another device part (like CPU or other).
Product version Check Point Gaia R80.30
OS build 200 OS kernel version 2.6.18-92cpx86_64 OS edition 64-bit
Our devices configuration:
1) Two Checkpoint 5400 in HA mode
2) One node has 80.10, another 80.30
3) Node with 80.30 as Active Node
4) Services on 80.10 are stopped
In a clip:
1. Information from the monitoring system
Have you encountered a similar problem? How did you decide?


2. Logs -/ var/log/messages
Sep 27 00:59:00 2019 CPGW-1 kernel: [fw4_0];[192.168.0.122:43493 -> 178.140.2.238:443] [ERROR]: network_classifier_get_zone_by_ifnum: Failed to get ifindex for ifnum=-1
Sep 27 00:59:00 2019 CPGW-1 kernel: [fw4_0];[192.168.0.122:43493 -> 178.140.2.238:443] [ERROR]: network_classifier_notify_clob_by_ifnum: network_classifier_get_zone_by_ifnum failed
Sep 27 00:59:00 2019 CPGW-1 kernel: [fw4_0];[192.168.0.122:43493 -> 178.140.2.238:443] [ERROR]: network_classifier_notify_clob_by_dst_route: network_classifier_notify_clob_by_ifnum failed
Sep 27 00:59:00 2019 CPGW-1 kernel: [fw4_0];[192.168.0.122:43493 -> 178.140.2.238:443] [ERROR]: network_classifier_notify_clob_for_not_incoming_conn: network_classifier_notify_clob_by_dst_route failed
Sep 27 00:59:00 2019 CPGW-1 kernel: [fw4_0];[192.168.0.122:43493 -> 178.140.2.238:443] [ERROR]: network_classifiers_destination_zone_handle_post_syn_context: network_classifier_notify_clob_for_not_incoming_conn failed
Sep 27 00:59:00 2019 CPGW-1 kernel: [fw4_0];[192.168.0.122:43493 -> 178.140.2.238:443] [ERROR]: network_classifier_cmi_handler_match_cb: network_classifiers_destination_zone_handle_post_syn_context failed
Sep 27 00:59:00 2019 CPGW-1 kernel: [fw4_0];[192.168.0.122:43493 -> 178.140.2.238:443] [ERROR]: cmik_loader_fw_context_match_cb: match_cb for CMI APP 20 failed on context 359, executing context 366 and adding the app to apps in exception
Sep 27 00:59:00 2019 CPGW-1 kernel: [fw4_0];[192.168.0.122:43493 -> 178.140.2.238:443] [ERROR]: up_manager_cmi_handler_match_cb: connection not found
Sep 27 00:59:00 2019 CPGW-1 kernel: [fw4_0];[192.168.0.122:43493 -> 178.140.2.238:443] [ERROR]: up_manager_cmi_handler_match_cb: rc FALSE - rejecting conn [192.168.0.122:43493 -> 178.140.2.238:443, IPP 6]
Sep 27 00:59:00 2019 CPGW-1 kernel: [fw4_0];[192.168.0.122:43493 -> 178.140.2.238:443] [ERROR]: up_rulebase_should_drop_possible_on_SYN: conn dir 0, 192.168.0.122:43493 -> 178.140.2.238:443, IPP 6 required_4_match = 0x802, not expected required_4_match = 0x800
Sep 27 00:59:00 2019 CPGW-1 kernel: [fw4_1];mux_buf_create: ERROR: Failed allocate Mux buf.
Sep 27 00:59:00 2019 CPGW-1 kernel: [fw4_1];mux_write_raw_data: ERROR: Failed to create Mux buf.
Sep 27 00:59:00 2019 CPGW-1 kernel: [fw4_1];tls_mux_write: mux_write_raw_data failed
Sep 27 00:59:00 2019 CPGW-1 kernel: [fw4_1];mux_task_handler: ERROR: Failed to handle task. task=ffffc2003cf70e40, app_id=1, mux_state=ffffc20043256a50.
Sep 27 00:59:00 2019 CPGW-1 kernel: [fw4_1];mux_read_handler: ERROR: Failed to handle task queue. mux_opaque=ffffc20043256a50.
Sep 27 00:59:00 2019 CPGW-1 kernel: [fw4_1];mux_active_read_handler_cb: ERROR: Failed to forward data to Mux.
Sep 27 00:59:00 2019 CPGW-1 kernel: [fw4_1];[192.168.218.39:65323 -> 192.168.0.6:53] [ERROR]: cmik_loader_fw_context_match_cb: failed to allocate s_cmik_loader_match_params
Sep 27 00:59:00 2019 CPGW-1 kernel: [fw4_1];cmi_context_exec_from_non_stream: cmik_loader_fw_context_match_cb(context=352, app_id = -1, context_apps=15c0004) failed
Sep 27 00:59:00 2019 CPGW-1 kernel: [fw4_1];[192.168.218.39:65323 -> 192.168.0.6:53] [ERROR]: up_manager_fw_handle_first_packet: cmi_exec_from_first_packet() failed
Sep 27 00:59:00 2019 CPGW-1 kernel: [fw4_1];[192.168.218.39:65323 -> 192.168.0.6:53] [ERROR]: up_manager_fw_handle_first_packet: failed to execute first packet context
Sep 27 00:59:00 2019 CPGW-1 kernel: [fw4_1];mux_buf_create: ERROR: Failed allocate Mux buf.
Sep 27 00:59:00 2019 CPGW-1 kernel: [fw4_1];mux_write_raw_data: ERROR: Failed to create Mux buf.
Sep 27 00:59:00 2019 CPGW-1 kernel: [fw4_1];tls_mux_write: mux_write_raw_data failed
Sep 27 00:59:00 2019 CPGW-1 kernel: [fw4_1];mux_task_handler: ERROR: Failed to handle task. task=ffffc2003cf70e40, app_id=1, mux_state=ffffc2019cbca6f0.
Sep 27 00:59:00 2019 CPGW-1 kernel: [fw4_1];mux_read_handler: ERROR: Failed to handle task queue. mux_opaque=ffffc2019cbca6f0.
Sep 27 00:59:00 2019 CPGW-1 kernel: [fw4_1];mux_active_read_handler_cb: ERROR: Failed to forward data to Mux.
Sep 27 00:59:00 2019 CPGW-1 kernel: [fw4_0];FW-1: h_getvals: fw_kmalloc (496) failed
Sep 27 00:59:00 2019 CPGW-1 kernel: [fw4_1];tcp_input: failed to alloc pkt buf at line :1259
Sep 27 00:59:01 2019 CPGW-1 kernel: [fw4_0];FW-1: h_getvals: fw_kmalloc (496) failed
Sep 27 00:59:01 2019 CPGW-1 kernel: [fw4_1];pslip_get_buf: failed to alloc packet_buf
Sep 27 00:59:01 2019 CPGW-1 kernel: [fw4_1];psl_handle_packet: psl_allocate_packet_buf failed, len=264
Sep 27 00:59:01 2019 CPGW-1 kernel: [fw4_0];cpaq_cbuf_alloc_rcv_buf_info: buf_id=88362620 unable to allocate buffer sz=1712
Sep 27 00:59:01 2019 CPGW-1 kernel: [fw4_0];cphwd_handle_send_cphwd_stats: NULL cphwd_stats_buf buffer
Sep 27 00:59:01 2019 CPGW-1 kernel: [fw4_0];mux_write_raw_data: ERROR: Failed to allocate buf data.
Sep 27 00:59:01 2019 CPGW-1 kernel: [fw4_0];tls_mux_write: mux_write_raw_data failed
Sep 27 00:59:01 2019 CPGW-1 kernel: [fw4_0];mux_task_handler: ERROR: Failed to handle task. task=ffffc2003b40a370, app_id=1, mux_state=ffffc200417ca8a0.
Sep 27 00:59:01 2019 CPGW-1 kernel: [fw4_0];mux_read_handler: ERROR: Failed to handle task queue. mux_opaque=ffffc200417ca8a0.
Sep 27 00:59:01 2019 CPGW-1 kernel: [fw4_0];mux_active_read_handler_cb: ERROR: Failed to forward data to Mux.
Sep 27 00:59:01 2019 CPGW-1 kernel: [fw4_0];mux_write_raw_data: ERROR: Failed to allocate buf data.
Sep 27 00:59:01 2019 CPGW-1 kernel: [fw4_0];tls_mux_write: mux_write_raw_data failed
Sep 27 00:59:01 2019 CPGW-1 kernel: [fw4_0];mux_task_handler: ERROR: Failed to handle task. task=ffffc2003b40a4b0, app_id=1, mux_state=ffffc2003822b1e0.
Sep 27 00:59:01 2019 CPGW-1 kernel: [fw4_0];mux_read_handler: ERROR: Failed to handle task queue. mux_opaque=ffffc2003822b1e0.
Sep 27 00:59:01 2019 CPGW-1 kernel: [fw4_0];mux_active_read_handler_cb: ERROR: Failed to forward data to Mux.
Sep 27 00:59:01 2019 CPGW-1 kernel: [fw4_1];mux_write_raw_data: ERROR: Failed to allocate buf data.
Sep 27 00:59:01 2019 CPGW-1 kernel: [fw4_1];tls_mux_write: mux_write_raw_data failed
Sep 27 00:59:01 2019 CPGW-1 kernel: [fw4_1];mux_task_handler: ERROR: Failed to handle task. task=ffffc20052afe1b0, app_id=1, mux_state=ffffc2001e526c00.
Sep 27 00:59:01 2019 CPGW-1 kernel: [fw4_1];mux_read_handler: ERROR: Failed to handle task queue. mux_opaque=ffffc2001e526c00.
Sep 27 00:59:01 2019 CPGW-1 kernel: [fw4_1];mux_active_read_handler_cb: ERROR: Failed to forward data to Mux.
29 Replies
- Mark as New
- Bookmark
- Subscribe
- Mute
- Subscribe to RSS Feed
- Permalink
- Report Inappropriate Content
Going through something similar with new Open servers on R80.30. Memory gradually starts increasing to the point where the cluster fails over. TAC is having us run a memory leak test, which I will be doing over the weekend and having it run until the memory runs out again.
Ryan
- Mark as New
- Bookmark
- Subscribe
- Mute
- Subscribe to RSS Feed
- Permalink
- Report Inappropriate Content
Are you using R80.30 vanilla, or have you loaded any Jumbo HFAs? Do you have Priority Queues turned on? See these:
sk149413: R80.20 / R80.30 Security Gateway freezes when Priority Queue is enabled
Based on the logs you provided it looks like possibly a kernel memory leak, see this SK:
sk35496: How to detect a kernel memory leak on Security Gateway with SecurePlatform OS / Gaia OS
New Book: "Max Power 2026" Coming Soon
Check Point Firewall Performance Optimization
Check Point Firewall Performance Optimization
- Mark as New
- Bookmark
- Subscribe
- Mute
- Subscribe to RSS Feed
- Permalink
- Report Inappropriate Content
As stated before it looks like a memory leak.
There are some posts in the last weeks regarding R80.30 and R80.20 and similar behaviors.
I'm really eager to see which is the RCA of these memory leaks. Did you opened a SR with the TAC?
Also as advised, install the latest JHF (Take 50)
____________
https://www.linkedin.com/in/federicomeiners/
https://www.linkedin.com/in/federicomeiners/
- Mark as New
- Bookmark
- Subscribe
- Mute
- Subscribe to RSS Feed
- Permalink
- Report Inappropriate Content
Yes we opened a SR. Hotfix installed. JHF (Take 50)
- Mark as New
- Bookmark
- Subscribe
- Mute
- Subscribe to RSS Feed
- Permalink
- Report Inappropriate Content
Hello!
We have a similar issue.
Node 1 openserverhardware - HP Proliant DL380G8p - Fresh installation R80.30 with Take 50 and deactivated priority queue -> off
Node 2 openserverhardware - HP Proliant DL380G8p - R80.10 (cphastop)
Installation R80.30 Sep. 26th 2019
Today Oct. 2nd 2019 in the early moring -> FW Kernel - Total 24.012 -> Used MB 24.012 -> Free 0
PRTG monitoring -> see attached file
To time we started a leak_detection on this R80.30 node and watch additionally whit the cli-command
while true; do ps -eo pid,tid,class,rtprio,stat,vsz,rss,comm --sort vsz; sleep 1; done
how much memory is consumed and compare it
- Mark as New
- Bookmark
- Subscribe
- Mute
- Subscribe to RSS Feed
- Permalink
- Report Inappropriate Content
Have either of you had any update on this? We just had a memory exhaustion event happen over the weekend and sent CheckPoint support the results of the memory leak test.
- Mark as New
- Bookmark
- Subscribe
- Mute
- Subscribe to RSS Feed
- Permalink
- Report Inappropriate Content
Hello.
TAC gave a hotfix, we put it on this weekend. While the flight is normal, but a little time has passed.
It seems like a problem in the IPS, but this is not accurate.
I'll keep you informed
- Mark as New
- Bookmark
- Subscribe
- Mute
- Subscribe to RSS Feed
- Permalink
- Report Inappropriate Content
Thanks!
- Mark as New
- Bookmark
- Subscribe
- Mute
- Subscribe to RSS Feed
- Permalink
- Report Inappropriate Content
Hello! We have still the problem that the memory run full. Between we have sent two cpinfos of the leakdetection to checkpoint, but still no answer.
Between I manually switch daily the checkpointservices from clusternode 1 to 2 or 2 to 1 and restart the machine after the switch.
It is goot to hear, that checkpoint have a fix for you. Maybe we get also a fix in the next days. Please can you tell me, if the fix help to solve the problem.
Thanks
- Mark as New
- Bookmark
- Subscribe
- Mute
- Subscribe to RSS Feed
- Permalink
- Report Inappropriate Content
In my case, disabling IPS rules solved the problem. Now all the rules work.
Crash dump helped to quickly solve the problem. Before the crash, the problem was solved for a long time. Do you have a crash dump? /var/log/crash
Crash dump helped to quickly solve the problem. Before the crash, the problem was solved for a long time. Do you have a crash dump? /var/log/crash
- Mark as New
- Bookmark
- Subscribe
- Mute
- Subscribe to RSS Feed
- Permalink
- Report Inappropriate Content
Which patch was this? We're also experiencing this issue.
- Mark as New
- Bookmark
- Subscribe
- Mute
- Subscribe to RSS Feed
- Permalink
- Report Inappropriate Content
The patch did not help solve the problem, continue to understand
- Mark as New
- Bookmark
- Subscribe
- Mute
- Subscribe to RSS Feed
- Permalink
- Report Inappropriate Content
Hello,
we received this patch "fw1_wrapper_HOTFIX_R80_30_JHF_T111_010_MAIN_GA_FULL.tgz".
it helped to reduce the memory leaking by some percentage, but we encountered firewall crashes when we run NMAP scans...
the active member gets totaly unresponsive when we scanned the firewall with a "low nmap portscan"
is anybody else facing the same issues?
we are still investigating with TAC to find a solution.
best regards
Thomas.
- Mark as New
- Bookmark
- Subscribe
- Mute
- Subscribe to RSS Feed
- Permalink
- Report Inappropriate Content
We’ve had the same issue for a few months with a 5400 after upgrading to r80.30. Check Point support has been utterly useless with helping us and almost impossible to get ahold of sometimes. We upgraded from r80.20 to resolve an ssl issue which also took several months to find out was a bug that had no timeframe for a fix and was resolved in r80.30. Our 3200 don’t have this issue which is strange because they aren’t as powerful.
Has anyone had any luck resolving this? We’re a couple of days from tossing CP in the garbage and going with another solution. I can’t believe how bad support has gotten.
- Mark as New
- Bookmark
- Subscribe
- Mute
- Subscribe to RSS Feed
- Permalink
- Report Inappropriate Content
@Greg_Mandiola hi,
Your feedback is extremely valuable. I did not find any open SRs with the symptoms you have described. Please send me your SR via a personal message, thanks
Val
- Mark as New
- Bookmark
- Subscribe
- Mute
- Subscribe to RSS Feed
- Permalink
- Report Inappropriate Content
Just sent you a message. Thanks for your help.
- Mark as New
- Bookmark
- Subscribe
- Mute
- Subscribe to RSS Feed
- Permalink
- Report Inappropriate Content
@Greg_Mandiola received and answered.
- Mark as New
- Bookmark
- Subscribe
- Mute
- Subscribe to RSS Feed
- Permalink
- Report Inappropriate Content
Hello,
what blades are enabled on your plattform?
Is HTTPS Inspection enabled?
i have heard some rumors when TAC was investigating our case, which is still pending.
what blades are enabled on your plattform?
Is HTTPS Inspection enabled?
i have heard some rumors when TAC was investigating our case, which is still pending.
- Mark as New
- Bookmark
- Subscribe
- Mute
- Subscribe to RSS Feed
- Permalink
- Report Inappropriate Content
Hello
Waiting for a hotfix from R&D. I hope he helps.

- Mark as New
- Bookmark
- Subscribe
- Mute
- Subscribe to RSS Feed
- Permalink
- Report Inappropriate Content
Hello folks,
Have you got any update on this subject from CP?
Namely, we are having the same problem on 15600 Cluster with R80.30 Take 111 (downgraded from Take 140 on CP recomm.).
There is the case on CP sitting for us, but so far, there is no resolution.
Anything new on your side?
Thanks!
- Mark as New
- Bookmark
- Subscribe
- Mute
- Subscribe to RSS Feed
- Permalink
- Report Inappropriate Content
Hello
Similar problems in a customer. After upgrade to R80.20+JHF140
A memory peak related to Fw Kernel and Kmem Blocking.
Reviewing traffic in interfaces we see a strange pattern: a big increase in TX traffic in External interface but not reflected in other interface, so it seems not to be crossinf the firewall, but instead being generated by the fw
Have you had any reposnse from TAC? I have a ticket opened.
- Mark as New
- Bookmark
- Subscribe
- Mute
- Subscribe to RSS Feed
- Permalink
- Report Inappropriate Content
We installed a lot of hotfixes, nothing helps. Support deals with this case. What helped After increasing the memory from 16 to 32 GB, 3 weeks how to keep the memory in the region of 42 percent
- Mark as New
- Bookmark
- Subscribe
- Mute
- Subscribe to RSS Feed
- Permalink
- Report Inappropriate Content
We upgraded from 8 to 32GB RAM also. Seeing utilization around 30% as opposed to 85% before.
- Mark as New
- Bookmark
- Subscribe
- Mute
- Subscribe to RSS Feed
- Permalink
- Report Inappropriate Content
I wish it were.
But we have already 32GB Ram and getting 0 Free Fw Kernel Memory when the issue arises
Normally yes, around 80-85% Free Memory
- Mark as New
- Bookmark
- Subscribe
- Mute
- Subscribe to RSS Feed
- Permalink
- Report Inappropriate Content
We are still waiting for R&D. They narrowed it down to a kernel table called static_hh_dst_cache. It appears to consume all of the RAM until it is exhausted.
Ryan
- Mark as New
- Bookmark
- Subscribe
- Mute
- Subscribe to RSS Feed
- Permalink
- Report Inappropriate Content
Hello,
the problem by us has been solved through checkpoint TAC.
Cause:
Some information regarding the cause of the issue - From the code owners we know this is bug related:
delete mux_buf from stream after receiving close_notify
When we receive the close_notify alert from a peer, it means that it would no longer accept any traffic from us. We should ignore buffers we receive for encryption to that peer in this state by deleting them from the egress stream. If we don't delete them, they are accumulated unnecessarily in the stream and aren't released until the connection is closed. This can cause excessive memory usage.
Hotfix for R80.30 Take 111
accel_HOTFIX_R80_30_JHF_T111_343_MAIN_GA_FULL.tgz
fw1_wrapper_HOTFIX_R80_30_JHF_T111_343_MAIN_GA_FULL.tgz
Hotfix for R80.30 Take 155
accel_HOTFIX_R80_30_JHF_T155_738_MAIN_GA_FULL.tgz
fw1_wrapper_HOTFIX_R80_30_JHF_T155_738_MAIN_GA_FULL.tgz
best regards, Erich Abraham
- Mark as New
- Bookmark
- Subscribe
- Mute
- Subscribe to RSS Feed
- Permalink
- Report Inappropriate Content
Is the fix you mention included in one of the hotfixes?
- Mark as New
- Bookmark
- Subscribe
- Mute
- Subscribe to RSS Feed
- Permalink
- Report Inappropriate Content
Hello, I discussed with a checkpoint developer and he had before a quick inofficial solution to replace (after backup) following file through a patched one in path:
/opt/CPsuite-R80.30/fw1/boot/modules/fw_kern_64.o /opt/CPsuite-R80.30/fw1/boot/modules/
Filename:
fw_kern_64.o (patched version for R80.30 Take 111 - 2.6 kernel)
After a reboot, there problem was gone. A week later have we got the official patch for R80.30 - Take 111 (two files as I mentioned before) -> in summary the the two hotfixes make the same necessarily changes
best regards, Erich Abraham
- Mark as New
- Bookmark
- Subscribe
- Mute
- Subscribe to RSS Feed
- Permalink
- Report Inappropriate Content
Hello!
An additional information for you, if we have the same issue.
Please check following:
Execute on the node where the problem exist:
fw ctl pstat -h | grep "Size 2000:"
Acutal I get following output:
Size 2000: Blocks: 242 Full blocks: 237 Nitems: 479 unused memory 2%
during the problem the Blocks: counter rise and rise and rise until there is no memory.
When there is no memory left, the there is no HA switchover -> the active nodes stops working, but the standbye node didn't takover.
best regards, Erich Abraham
Leaderboard
Epsum factorial non deposit quid pro quo hic escorol.
| User | Count |
|---|---|
| 7 | |
| 6 | |
| 6 | |
| 2 | |
| 2 | |
| 2 | |
| 2 | |
| 2 | |
| 2 | |
| 1 |
Upcoming Events
Fri 29 May 2026 @ 09:00 AM (EDT)
Caracas: Executive Breakfast: Innovación en Ciberseguridad – IA y Threat IntelligenceTue 02 Jun 2026 @ 10:00 AM (AEST)
The Cloud Architect Series: Check Point WAF. The next generation of AI-Powered Protection - APACTue 02 Jun 2026 @ 06:00 PM (IDT)
Under the Hood | Check Point SASE: Identity Integration & Access Policy Design Best PracticesTue 02 Jun 2026 @ 10:00 AM (AEST)
The Cloud Architect Series: Check Point WAF. The next generation of AI-Powered Protection - APACTue 02 Jun 2026 @ 06:00 PM (IDT)
Under the Hood | Check Point SASE: Identity Integration & Access Policy Design Best PracticesThu 04 Jun 2026 @ 02:00 PM (CEST)
Deep Dive Webinar: New CloudGuard GWLB Deployment Without NAT Gateways - EuropeThu 04 Jun 2026 @ 07:00 PM (IDT)
Deep Dive Webinar: New CloudGuard GWLB Deployment Without NAT Gateways - AmericaFri 29 May 2026 @ 09:00 AM (EDT)
Caracas: Executive Breakfast: Innovación en Ciberseguridad – IA y Threat IntelligenceAbout CheckMates
Learn Check Point
Advanced Learning
YOU DESERVE THE BEST SECURITY

©1994-2026 Check Point Software Technologies Ltd. All rights reserved.
Copyright
Privacy Policy
About Us
UserCenter