- Products
- Learn
- Local User Groups
- Partners
- More
This website uses Cookies. Click Accept to agree to our website's cookie use as described in our Privacy Policy. Click Preferences to customize your cookie settings.
- Products
- Learn
- Local User Groups
- Upcoming Events
- Americas
- EMEA
- Czech Republic and Slovakia
- Denmark
- Netherlands
- Germany
- Sweden
- United Kingdom and Ireland
- France
- Spain
- Norway
- Ukraine
- Baltics and Finland
- Greece
- Portugal
- Austria
- Kazakhstan and CIS
- Switzerland
- Romania
- Turkey
- Belarus
- Belgium & Luxembourg
- Russia
- Poland
- Georgia
- DACH - Germany, Austria and Switzerland
- Iberia
- Africa
- Adriatics Region
- Eastern Africa
- Israel
- Nordics
- Middle East and Africa
- Balkans
- Italy
- Bulgaria
- Cyprus
- APAC
- Partners
- More
- ABOUT CHECKMATES & FAQ
- Sign In
- Leaderboard
- Events
AI Security Masters E7:
How CPR Broke ChatGPT's Isolation and What It Means for You
Blueprint Architecture for Securing
The AI Factory & AI Data Center
Call For Papers
Your Expertise. Our Stage
Good, Better, Best:
Prioritizing Defenses Against Credential Abuse
Ink Dragon: A Major Nation-State Campaign
Watch HereCheckMates Go:
CheckMates Fest
Turn on suggestions
Auto-suggest helps you quickly narrow down your search results by suggesting possible matches as you type.
Showing results for
- CheckMates
- :
- Products
- :
- Hybrid Mesh
- :
- Firewall and Security Management
- :
- High CPU using for 4 cores (microsoft-ds)
Options
- Subscribe to RSS Feed
- Mark Topic as New
- Mark Topic as Read
- Float this Topic for Current User
- Bookmark
- Subscribe
- Mute
- Printer Friendly Page
Turn on suggestions
Auto-suggest helps you quickly narrow down your search results by suggesting possible matches as you type.
Showing results for
Are you a member of CheckMates?
×
Sign in with your Check Point UserCenter/PartnerMap account to access more great content and get a chance to win some Apple AirPods! If you don't have an account, create one now for free!
- Mark as New
- Bookmark
- Subscribe
- Mute
- Subscribe to RSS Feed
- Permalink
- Report Inappropriate Content
High CPU using for 4 cores (microsoft-ds)
Hello !
Since several days, we're trying to optimize/tunne a virtual FW (4 cores, 8Go RAM), which use to treat arround 100mo/s in term of throughput.
This is our missunderstanding point, we're using arround 1/3 of each CPU (3), only for treating arround 100mo throughput...Doesn't make sense for us... (At the beginning, we had only 2 cores, and due to high CPU, we decided to add 2 additionnal to solve the issue quickly as we were in migration).
-----------------------------------------------------------------------------------------------------------------------------
About core assignement :
fw ctl affinity -l -v
Interface eth0 (irq 75): CPU 0
Interface eth1 (irq 91): CPU 0
Interface eth2 (irq 107): CPU 0
Interface eth3 (irq 115): CPU 0
Kernel fw_0: CPU 3
Kernel fw_1: CPU 2
Kernel fw_2: CPU 1
Daemon mpdaemon: CPU 1 2 3
Daemon lpd: CPU 1 2 3
Daemon in.asessiond: CPU 1 2 3
Daemon fwd: CPU 1 2 3
Daemon in.acapd: CPU 1 2 3
Daemon cpd: CPU 1 2 3
Daemon cprid: CPU 1 2 3
-----------------------------------------------------------------------------------------------------------------------------
show version all :
Product version Check Point Gaia R80.30
OS build 200
OS kernel version 2.6.18-92cpx86_64
OS edition 64-bit
-----------------------------------------------------------------------------------------------------------------------------
cpinfo -y all
This is Check Point CPinfo Build 914000202 for GAIA
[IDA]
No hotfixes..
[MGMT]
HOTFIX_R80_30_JUMBO_HF_MAIN Take: 155
[CPFC]
HOTFIX_R80_30_JUMBO_HF_MAIN Take: 155
[FW1]
HOTFIX_MAAS_TUNNEL_AUTOUPDATE
HOTFIX_R80_30_JUMBO_HF_MAIN Take: 155
FW1 build number:
This is Check Point's software version R80.30 - Build 001
kernel: R80.30 - Build 135
[SecurePlatform]
HOTFIX_R80_30_JUMBO_HF_MAIN Take: 155
[CPinfo]
No hotfixes..
[DIAG]
No hotfixes..
[PPACK]
HOTFIX_R80_30_JUMBO_HF_MAIN Take: 155
[CVPN]
No hotfixes..
[CPUpdates]
BUNDLE_MAAS_TUNNEL_AUTOUPDATE Take: 25
BUNDLE_INFRA_AUTOUPDATE Take: 25
BUNDLE_DEP_INSTALLER_AUTOUPDATE Take: 13
BUNDLE_R80_30_JUMBO_HF_MAIN Take: 155
[CPDepInst]
No hotfixes..
[AutoUpdater]
No hotfixes..
[CPPinj]
HOTFIX_R80_10
-----------------------------------------------------------------------------------------------------------------------------
Regarding acceleration statistic :
fwaccel stats -s
Accelerated conns/Total conns : 1524/19166 (7%) => Too low, should be higher
Accelerated pkts/Total pkts : 2103698529/4306719728 (48%) => Not so bad
F2Fed pkts/Total pkts : 292614545/4306719728 (6%) => Full path (not accelerated)
F2V pkts/Total pkts : 44209469/4306719728 (1%)
CPASXL pkts/Total pkts : 0/4306719728 (0%)
PSLXL pkts/Total pkts : 1910406654/4306719728 (44%) => Medium Path
QOS inbound pkts/Total pkts : 0/4306719728 (0%)
QOS outbound pkts/Total pkts : 0/4306719728 (0%)
Corrected pkts/Total pkts : 0/4306719728 (0%)
-----------------------------------------------------------------------------------------------------------------------------
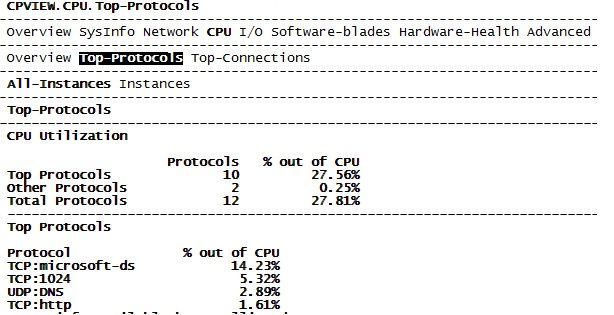
Most of the CPU used is related to "microsoft-ds" (default service defined in Checkpoint)
----------------------------------------------------------------------------------------------------------------------
----------------------------------------------------------------------------------------------------------------------
https://community.checkpoint.com/t5/General-Topics/High-Performance-Gateways-and-Tuning/td-p/33076
We gave a look to the following very interesting post above, thinking that we will be able to improve performance, remplacing microsoft-ds services by a "manual one" (Protocol : None option), then it will be accelerated and by consequence, improving CPU. Fail 😛
----------------------------------------------------------------------------------------------------------------------
We tried to build our own acceleration rules (see below) : We had good results regarding DNS & increasing from the following statistics :
Accelerated conns/Total conns : 1524/19166 (7%) to 50%.
But regarding CPU, it remained exactly the same... In kind of CPU utilization, no changes has noticed (CPU remains the same, and protocol CPU utilization also...)
Regarding port 1024, why it has been never matched, as counter remained to 0 ?
When we compiled the Firewall, looks like the table rule acceleration has been removed and created a lot of mess, FW has rebooted and switched on other member. But this is another point and issue.
----------------------------------------------------------------------------------------------------------------------
cat table_connex_accel.txt | grep 445 | wc -l
7658
cat table_connex_accel.txt | grep 53 | wc -l
18532
cat table_connex_accel.txt | grep 1024 | wc -l
10
Thanks in advance for your help on this 😉
Best regards,
Robin.
12 Replies
- Mark as New
- Bookmark
- Subscribe
- Mute
- Subscribe to RSS Feed
- Permalink
- Report Inappropriate Content
A lot to unpack here, but I don't see any flagrant red flags based on what you have provided so far, your acceleration statistics seem about right. A few points:
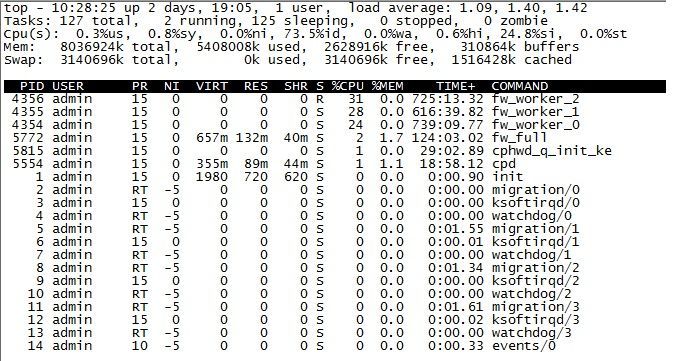
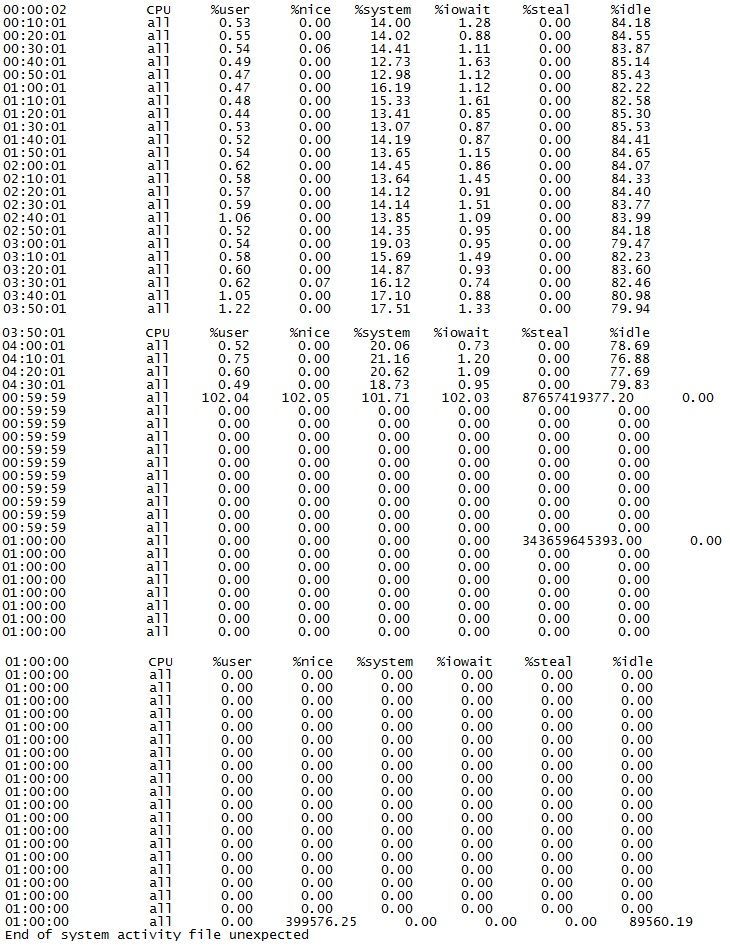
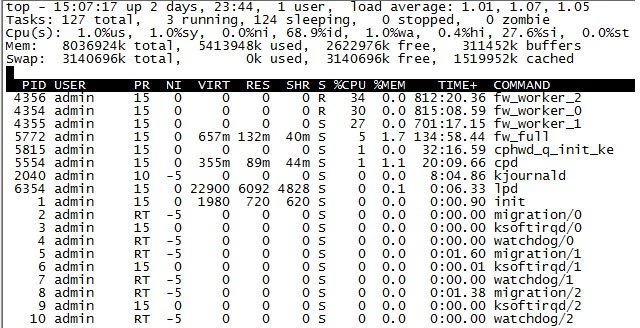
1) Check your "steal" (st) percentage reported by top and sar. If nonzero your firewall is being denied access to a virtual CPU by the Hypervisor and it is having to wait for CPU availability. This can cause what appears to be consistent CPU load even when the firewall is idle.
2) Please provide output of enabled_blades command. Whether the CPU load you are seeing is appropriate will depend on how much you are asking the firewall to do.
3) Please provide output of netstat -ni to ensure you aren't dropping frames.
4) Please provide output of fwaccel stat.
New Book: "Max Power 2026" Coming Soon
Check Point Firewall Performance Optimization
Check Point Firewall Performance Optimization
- Mark as New
- Bookmark
- Subscribe
- Mute
- Subscribe to RSS Feed
- Permalink
- Report Inappropriate Content
Hey Timothy,
as usual, thanks for your prompt reply and the ways that you're trying to help 😉 Appreciate !
You're right, regarding accel statistics it looks well !
But we still can't understanding about CPU, after have been in touch with a colleague who has worked a long time with CheckPoint, it should not use all this CPU o as you said : "firewall is being denied access to a virtual CPU".
enabled_blades
fw ips mon
netstat -ni
fwaccel stat
+-----------------------------------------------------------------------------+
|Id|Name |Status |Interfaces |Features |
+-----------------------------------------------------------------------------+
|0 |SND |enabled |eth0,eth1,eth2,eth3 |Acceleration,Cryptography |
| | | | |Crypto: Tunnel,UDPEncap,MD5, |
| | | | |SHA1,NULL,3DES,DES,CAST, |
| | | | |CAST-40,AES-128,AES-256,ESP, |
| | | | |LinkSelection,DynamicVPN, |
| | | | |NatTraversal,AES-XCBC,SHA256 |
+-----------------------------------------------------------------------------+
Accept Templates : enabled
Drop Templates : disabled
NAT Templates : enabled
tar
top
- Mark as New
- Bookmark
- Subscribe
- Mute
- Subscribe to RSS Feed
- Permalink
- Report Inappropriate Content
Steal is only relevant when you are running the firewall in VMWare and there are not enough CPU cycles to go around to all the VMs asking for them, so the Hypervisor starts limiting CPU access for the VMs. It doesn't look like you have that happening in your case, although there seem to be some weird glitches in your sar output, coincidentally involving the steal (st) percentage in a few cases.
Based on enabled blades, you almost certainly need to tune your IPS to reduce CPU load, which is probably inspecting all traffic with a large number of performance-impacting signatures. Try this test:
1) Baseline firewall CPU load
2) Run command ips off
3) Wait 90 seconds
4) Baseline new firewall CPU load
5) Run command ips on
This test tells you how much CPU load is being caused by the IPS blade, and gives you a "preview" of the potential amount of CPU load that can be saved by IPS tuning. The basics of IPS, and tuning it for performance is heavily covered in the third edition of my book since IPS is so frequently the culprit for high CPU load and traffic not being fully accelerated.
New Book: "Max Power 2026" Coming Soon
Check Point Firewall Performance Optimization
Check Point Firewall Performance Optimization
- Mark as New
- Bookmark
- Subscribe
- Mute
- Subscribe to RSS Feed
- Permalink
- Report Inappropriate Content
Hey Timothy !
ips off
IPS is disabled
Please note that for the configuration to apply for connections from existing templates, you have to run this command with -n flag which deletes existing templates.
Without '-n', it will fully take effect in a few minutes.
CPU before with arround 70-120Mo throughput & CPU after change (waiting a cuple of minutes).
Unfortunatelty, we're not able to notice a big difference in term of CPU (with/without ips)
Best regards,
Robin.
- Mark as New
- Bookmark
- Subscribe
- Mute
- Subscribe to RSS Feed
- Permalink
- Report Inappropriate Content
You‘re getting no hits counter for tcp port 1024, because this is not what it looks like in cpview.
TCP/1024 in cpview means all ports above 1024 (1024-65xxx). There is only one entry for all these ports.
How about your underlying hardware, which server vendor and type? Your firewall is running virtualised, is your virtual machine alone on the host, are there enough CPUs available for these virtual machine or are you sharing with a lot of other VMs?
One of the problem with virtualized servers will be the „power profile“ of the hardware host. Most vendors have profiles to save power consumption enabled by default. Change it to maximum performance.
Wolfgang
- Mark as New
- Bookmark
- Subscribe
- Mute
- Subscribe to RSS Feed
- Permalink
- Report Inappropriate Content
Hey Wolfgang,
appreciate your help on this also 😉
Yes it's sharing with a lot of others machines : FWs, servers, LB... (there is a whole team dedicated to manage the virtualization).
After speaking with my colleague in charge of Vmware infra :
- Dell PowerEdge R640
- Power profile : There is no DPM (Distributed power management) & no server profiles.
Best regards,
Robin.
- Mark as New
- Bookmark
- Subscribe
- Mute
- Subscribe to RSS Feed
- Permalink
- Report Inappropriate Content
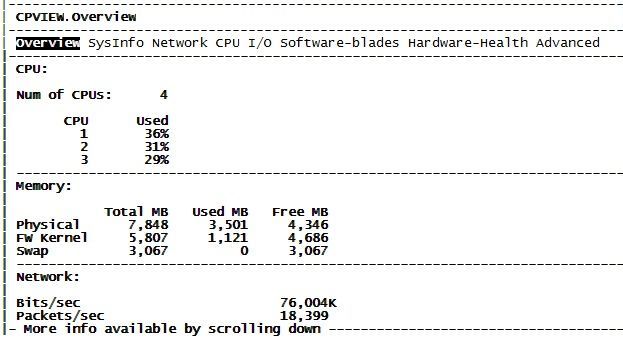
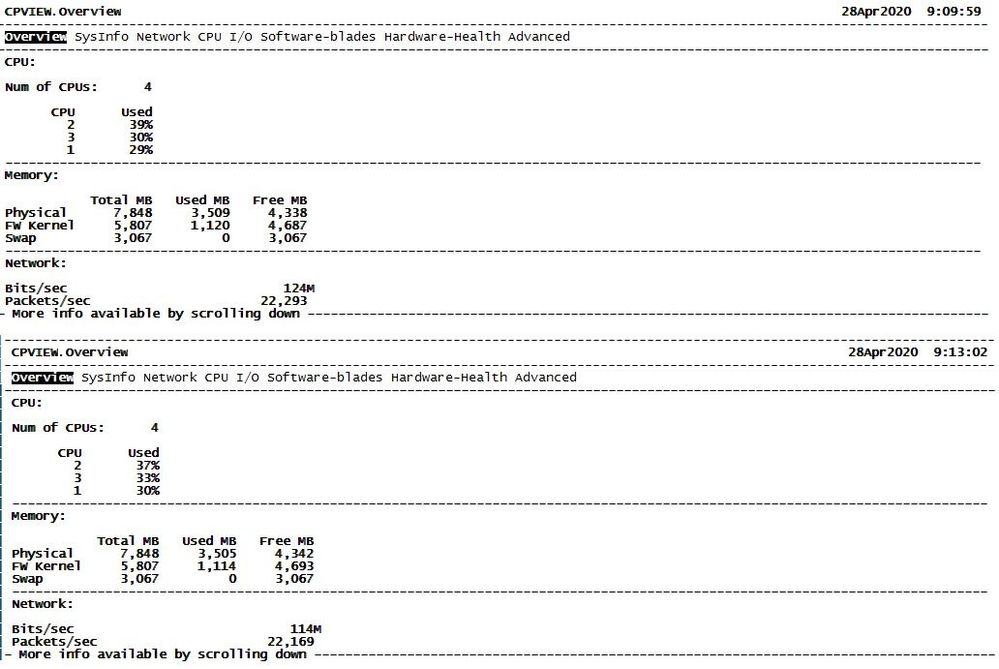
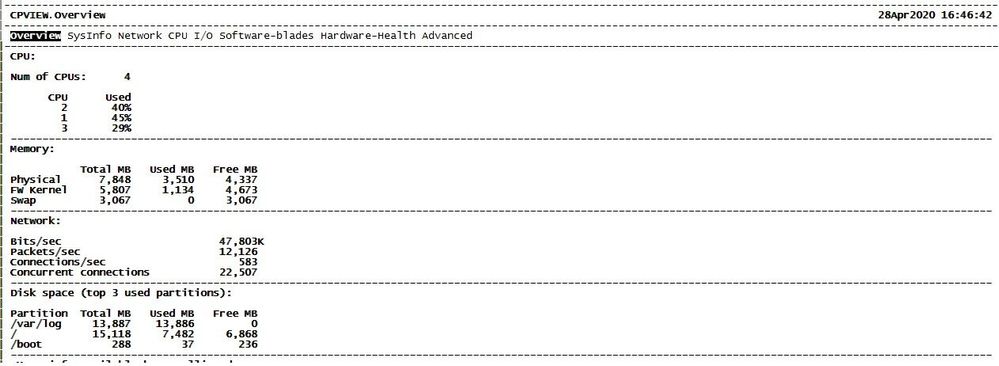
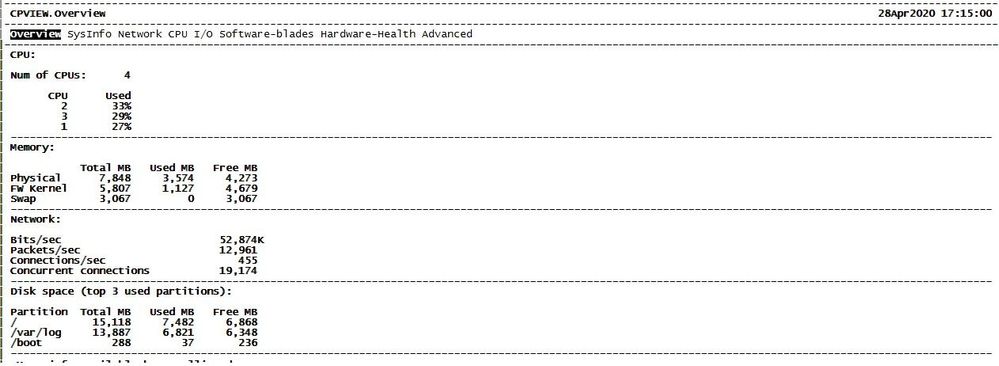
What is your new connection rate? Please show further down the screen on the Overview page of cpview. If you have a high new connection rate that could elevate CPU due to rule base lookup overhead.
Is this firewall a cluster? If so gracefully power off the standby member and see how CPU use changes without the overhead of state sync.
Is this box a perimeter gateway for the Internet? If so what is the drop rate?
New Book: "Max Power 2026" Coming Soon
Check Point Firewall Performance Optimization
Check Point Firewall Performance Optimization
- Mark as New
- Bookmark
- Subscribe
- Mute
- Subscribe to RSS Feed
- Permalink
- Report Inappropriate Content
As you are running on VM, how are you applying the license? Have you set the GW to Cloudguard IAAS model? If so have you used vsec_lic_cli to apply the license from management?
on the gateway can you type: fw ctl affinity-l -a
look for the line The current license....
on the gateway can you type: fw ctl affinity-l -a
look for the line The current license....
Regards, Maarten
- Mark as New
- Bookmark
- Subscribe
- Mute
- Subscribe to RSS Feed
- Permalink
- Report Inappropriate Content
Hey Marteen,
yes we had to apply license through vsec_lic_cli from Management.
On the current gateway firewall :
fw ctl affinity -l -a :
eth0: CPU 0
eth1: CPU 0
eth2: CPU 0
eth3: CPU 0
Kernel fw_0: CPU 3
Kernel fw_1: CPU 2
Kernel fw_2: CPU 1
Daemon mpdaemon: CPU 1 2 3
Daemon lpd: CPU 1 2 3
Daemon in.asessiond: CPU 1 2 3
Daemon fwd: CPU 1 2 3
Daemon in.acapd: CPU 1 2 3
Daemon cpd: CPU 1 2 3
Daemon cprid: CPU 1 2 3
- Mark as New
- Bookmark
- Subscribe
- Mute
- Subscribe to RSS Feed
- Permalink
- Report Inappropriate Content
Oups, sorry sir, please find screenshot complete on cpview below :
Yes this a cluster, I will check if that's possible to shut down the passive one in order to give a look at CPU and inform you 😉
This is our "Internal" Firewall, we have another one as "External" (perimeter gateway) treating traffic from Internet. Regarding his CPU from External one, we have good statistic an CPU using (only 2 cores). Of course there is no microsoft-ds traffic, a lot of publication and browsing traffic (I guess it's working well due to NAT template and acceleration).
That's why I'm still not able to understand, why CPU didn't decrease regarding protocol microsoft-ds on Internal Firewall after applying :
- fast_accell rule related to microsoft-ds traffic
- Changing for a port with "None" protocol to be sure that could be accelerated.
And yes we have another (or related) issue regarding space disk on /var/log...
After cleaning a crash (due to fast_accell / compiling, a core file had been generated)
Thanks for your perseverance on this Timothy, appreciate 😉
- Mark as New
- Bookmark
- Subscribe
- Mute
- Subscribe to RSS Feed
- Permalink
- Report Inappropriate Content
do you guys have any solution?
- Mark as New
- Bookmark
- Subscribe
- Mute
- Subscribe to RSS Feed
- Permalink
- Report Inappropriate Content
Hey Florian,
I opened a case to support, on their point of view, this is a normal behavior and it's working correctly... I think there is something related to VMware behind as this is a VirtualEdition
Best regards,
Robin.
Leaderboard
Epsum factorial non deposit quid pro quo hic escorol.
| User | Count |
|---|---|
| 66 | |
| 19 | |
| 13 | |
| 12 | |
| 11 | |
| 9 | |
| 9 | |
| 7 | |
| 7 | |
| 7 |
Upcoming Events
Tue 28 Apr 2026 @ 06:00 PM (IDT)
Under the Hood: Securing your GenAI-enabled Web Applications with Check Point WAFThu 30 Apr 2026 @ 03:00 PM (PDT)
Hillsboro, OR: Securing The AI Transformation and Exposure ManagementTue 28 Apr 2026 @ 06:00 PM (IDT)
Under the Hood: Securing your GenAI-enabled Web Applications with Check Point WAFTue 12 May 2026 @ 10:00 AM (CEST)
The Cloud Architects Series: Check Point Cloud Firewall delivered as a serviceThu 30 Apr 2026 @ 03:00 PM (PDT)
Hillsboro, OR: Securing The AI Transformation and Exposure ManagementAbout CheckMates
Learn Check Point
Advanced Learning
YOU DESERVE THE BEST SECURITY
©1994-2026 Check Point Software Technologies Ltd. All rights reserved.
Copyright
Privacy Policy
About Us
UserCenter


