- Products
- Learn
- Local User Groups
- Partners
- More
This website uses Cookies. Click Accept to agree to our website's cookie use as described in our Privacy Policy. Click Preferences to customize your cookie settings.
- Products
- AI Security
- Developers & More
- Check Point Trivia
- CheckMates Toolbox
- General Topics
- Products Announcements
- Threat Prevention Blog
- Upcoming Events
- Americas
- EMEA
- Czech Republic and Slovakia
- Denmark
- Netherlands
- Germany
- Sweden
- United Kingdom and Ireland
- France
- Spain
- Norway
- Ukraine
- Baltics and Finland
- Greece
- Portugal
- Austria
- Kazakhstan and CIS
- Switzerland
- Romania
- Turkey
- Belarus
- Belgium & Luxembourg
- Russia
- Poland
- Georgia
- DACH - Germany, Austria and Switzerland
- Iberia
- Africa
- Adriatics Region
- Eastern Africa
- Israel
- Nordics
- Middle East and Africa
- Balkans
- Italy
- Bulgaria
- Cyprus
- APAC
MVP 2026
Inception is On!
What's New in R82.10?
10 December @ 5pm CET / 11am ET
Improve Your Security Posture with
Threat Prevention and Policy Insights
Overlap in Security Validation
Help us to understand your needs better
CheckMates Go:
Maestro Madness
Turn on suggestions
Auto-suggest helps you quickly narrow down your search results by suggesting possible matches as you type.
Showing results for
- CheckMates
- :
- Products
- :
- Network & SASE
- :
- Security Gateways
- :
- CPU Spikes Since January and VPN Disconnections
Options
- Subscribe to RSS Feed
- Mark Topic as New
- Mark Topic as Read
- Float this Topic for Current User
- Bookmark
- Subscribe
- Mute
- Printer Friendly Page
Turn on suggestions
Auto-suggest helps you quickly narrow down your search results by suggesting possible matches as you type.
Showing results for
Are you a member of CheckMates?
×
Sign in with your Check Point UserCenter/PartnerMap account to access more great content and get a chance to win some Apple AirPods! If you don't have an account, create one now for free!
- Mark as New
- Bookmark
- Subscribe
- Mute
- Subscribe to RSS Feed
- Permalink
- Report Inappropriate Content
CPU Spikes Since January and VPN Disconnections
Hi all,
I have a strange issue with VPN clients disconnecting around 11:00am and 3pm each day that has only started happening since the start of January. We have over 3000 users connect via VPN .
We have a pair of 16200's running in Active-Standby. They were rebuilt back in November by professional services but immediately had issues with the SND's not balancing (a single SND would max out) this was resolved with sk165853 and through December we had no issues with performance.
From the 3rd Jan (1st day back after Christmas) at 11am, we had loads of reports that users were disconnected from VPN, at this point we failed over the firewall to the standby and it seemed to resolve the issue. The same thing happened the next day and has been happing each day since. Sometimes at 3pm too.
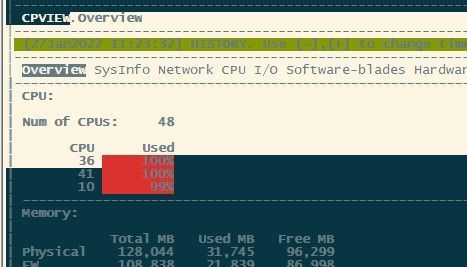
Looking through the logs, I have noticed a few things. At the time of disconnections we get CPU spikes, the spikes seem to happen every 3 hours. Some of the spikes are a couple of minutes but there are a couple that have been running for weeks. Below are a couple from today, both starting before Christmas. The week or so before Christmas a lot of staff break up, therefore this issue could have started before Jan. Both firewalls have been rebooted in the last 10 days.
Jan 25 09:28:02 2022 fwxxxxx spike_detective: spike info: type: thread, thread id: 81691, thread name: fwk0_32, start time: 22/01/22 04:18:12, spike duration (sec): 277789, initial cpu usage: 100, average cpu usage: 97, perf taken: 0
Jan 25 09:32:25 2022 fwxxxxx spike_detective: spike info: type: thread, thread id: 81672, thread name: fwk0_13, start time: 21/01/22 17:00:53, spike duration (sec): 318691, initial cpu usage: 100, average cpu usage: 97, perf taken: 0
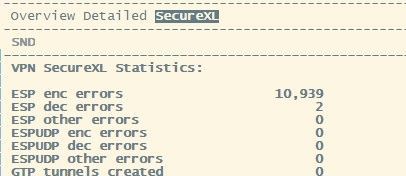
Another anomaly we notice around the time of the disconnections is a massive increase of 'ESP enc Errors' in CPView under VPN > SecureXL. Normally around the 10 - 100 mark, at the time of the CPU spike and disconnections they jump up to 5000+ for a couple of minutes.
Any thoughts or help?
Many thanks
Rich
20 Replies
- Mark as New
- Bookmark
- Subscribe
- Mute
- Subscribe to RSS Feed
- Permalink
- Report Inappropriate Content
what version do you run?
- Mark as New
- Bookmark
- Subscribe
- Mute
- Subscribe to RSS Feed
- Permalink
- Report Inappropriate Content
R81.10 JF Take 22
- Mark as New
- Bookmark
- Subscribe
- Mute
- Subscribe to RSS Feed
- Permalink
- Report Inappropriate Content
This is going to be tough to find, what I would suggest is starting cpview in history mode with -t, moving the timeframe to about 30 minutes before a known problem period, then use + and - to step forward minute-by-minute into the problem period keeping an eye especially on overall throughput, new and concurrent connection rates and packets per second. Seeing what changes during the problem period should help point you in the right direction.
If I had to hazard a guess, I'd say your SND(s) are overloaded during the problem periods even with the sk165853 fix; I don't believe the spike detective reports CPU saturation on the SNDs but I'm not sure. If true this would result in RX-DRPs during the problem period which can be viewed with netstat -ni and sar -n EDEV. Could also be some kind of elephant flow kicking up at those predetermined times (backups?) and stomping the VPNs, run fw ctl multik print_heavy_conn and see if the reported elephant flows correspond to the known problem periods.
Gaia 4.18 (R82) Immersion Tips, Tricks, & Best Practices Video Course
Now Available at https://shadowpeak.com/gaia4-18-immersion-course
Now Available at https://shadowpeak.com/gaia4-18-immersion-course
- Mark as New
- Bookmark
- Subscribe
- Mute
- Subscribe to RSS Feed
- Permalink
- Report Inappropriate Content
Thanks for the reply.
We had another issue today at 11:21am.
Just before the disconnections the ESP errors jump from 1 - 100 to 10,000
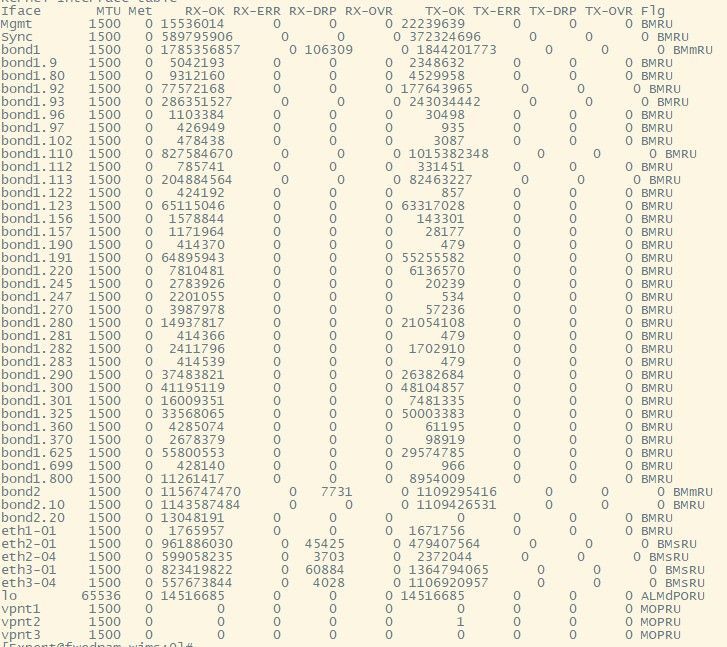
The netstat (and our Solarwinds monitoring) are showing high discards on our internal and external bonds, one day it recorded over 150K. Netstat also shows high RX-DRPs. The core switch and external router shows no errors or drops.
sar -n EDEV doesn't show any abnormal figures, fw ctl multik print_heavy_conn has some entries but not around the time of disconnections. There is no increase in the throughput (in and out around 700mb) and no increase in connections.
Thanks Rich
- Mark as New
- Bookmark
- Subscribe
- Mute
- Subscribe to RSS Feed
- Permalink
- Report Inappropriate Content
Hmm that is strange, looks more like a dispatcher balancing issue than a resource shortage. Almost like the saturated workers are causing a backup into the SNDs and causing the enc errors, although that doesn't make sense since enc errors would be for traffic being encrypted to leave the firewall. Assuming it is related of course. The RX-DRP level is way too low to matter and apparently elephant flows are not the culprit.
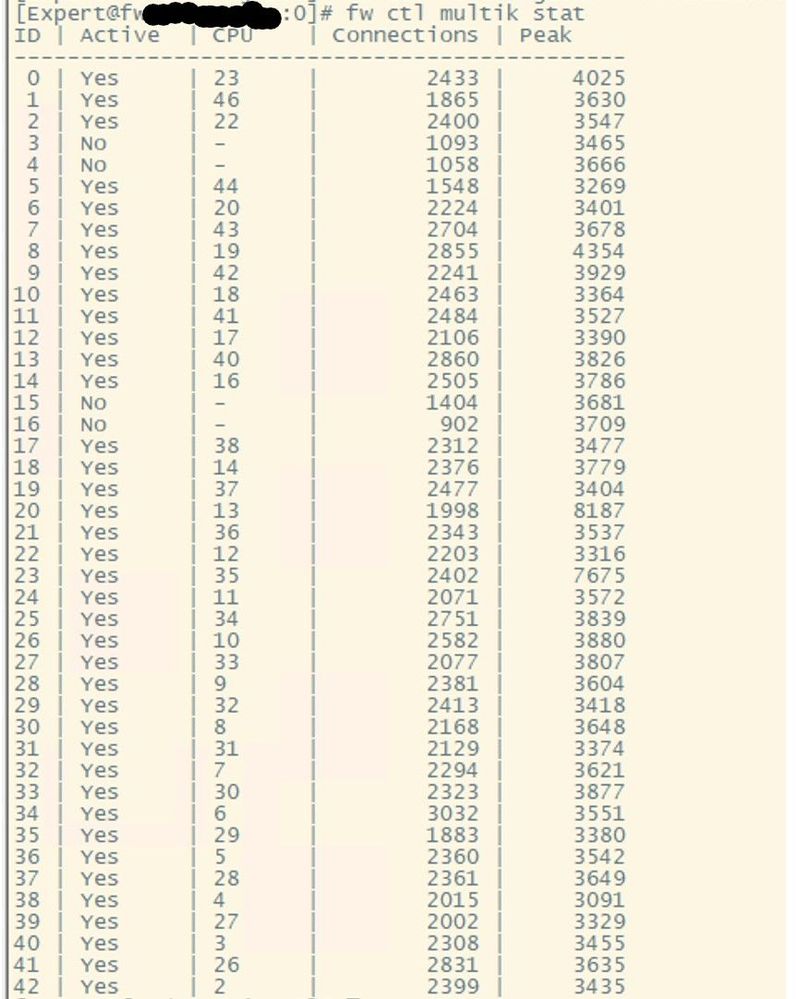
Next time it happens run fw ctl multik stat which will give you a connection count for each worker; would be interesting to see if the connections are properly balanced among all the workers, or those two busy ones were assigned more connections then they should have been. Next run fw ctl multik gconn > filename which will show the attributes of each connection and worker assignment according to the dispatcher, if you massage the filename output you should be able to isolate all connections running on the saturated core(s) via the "Inst" column value. Do they have anything in common? Are certain types of connections inappropriately congregating on the saturated workers? How do those connections differ from connections carried on non-saturated workers?
You could override the dispatcher's CPU load-based algorithm and have it go straight round robin if that algorithm is causing your issue, but I would not advise going down that road unless it is a verified dispatcher problem. The variables to make this change are:
fwmultik_enable_round_robin=1
fwmultik_enable_increment_first=1
After that we are definitely into TAC case territory.
Gaia 4.18 (R82) Immersion Tips, Tricks, & Best Practices Video Course
Now Available at https://shadowpeak.com/gaia4-18-immersion-course
Now Available at https://shadowpeak.com/gaia4-18-immersion-course
- Mark as New
- Bookmark
- Subscribe
- Mute
- Subscribe to RSS Feed
- Permalink
- Report Inappropriate Content
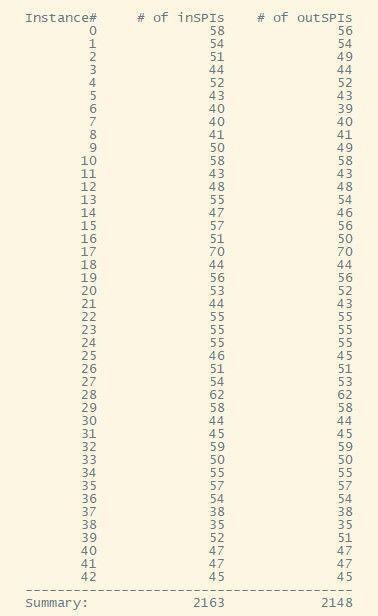
I managed to run fw ctl multik stat when it happened last week.
The vpn tu mstats also shows a balanced split of vpn connections
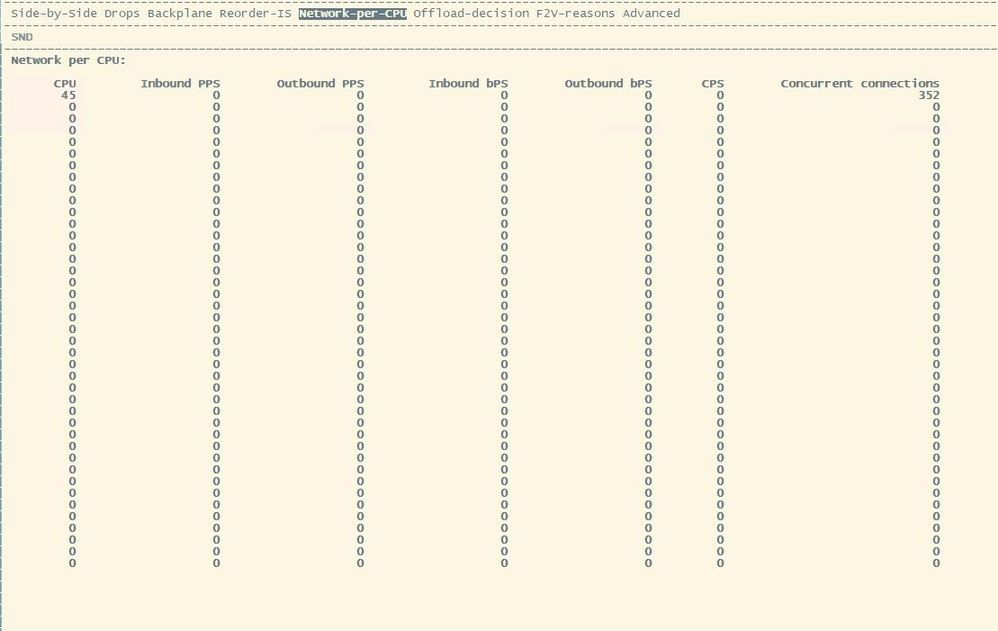
Having a look around cpview, I don't know if this is correct or a bug, but under Advanced, SecureXL and Network-per-CPU is only lists one CPU. This is the same on both gateways.
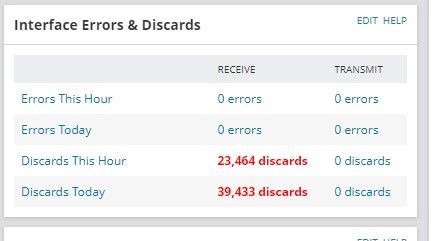
Again, I don't know if this is Solarwards not reporting correctly, but these are the discards for today. They show for our internal and external bonds and the relevant NIC's. I don't know if this has any relevance to the issues we are experiencing.
- Mark as New
- Bookmark
- Subscribe
- Mute
- Subscribe to RSS Feed
- Permalink
- Report Inappropriate Content
Hello,
yes we had also the same issue in the past with R81 Take 44 on a 15600 appliance.
I would say tiny Mickey Mouse traffic rendered the appliance useless, VPN dropped on a daily basis ...
VPN becomes really unstable ...
as you we saw elephant flows filling up the machine and creating spikes.
also we saw "fwaccel stats -s" showed us gruesome results, almost all traffic went F2F.
we searched for the connections in spike detector logs and saw it all goes F2F, alot of the traffic was CIFS ...
SecureXL has some limtiations with CIFS.
TAC told gave to use this kernel parameter "skip_offload_for_active_spii=0", somehow it forces CIFS Traffic to go to Medium Path, in combination with VPN
then we checked if all CIFS Traffic went to Medium Path via "fw_mux all -> output.txt"
Check the output for: CIFS Connection and all other heavy connections!
It should then follow Medium Path!
When the connection is in Medium Path, you can consider using Fast Acceleration to give it some extra boost! sk156672
Since its bypassing some Security Blades, please consider its security impact!
But this has really worked for backup traffic.
but this was still not sufficient ... this 15600 was still a lame duck ...
finally we run the IPS Analyzer, TAC found some very CPU Intensive IPS protections. sk110737
After disabling them it works the lost performance came back!
And still we had some issues left.
when installing a Policy we lost some pings over every VPN S2S connection.
Some would argue you can ignore that, but some costumers dont.
when searching for connections "action:key install" in Smartlog between the firewalls we saw huge gaps, with "Link to X.X.X.X is not responding/ Link to Y.Y.Y.Y is respondig", mostly during policy install ... at most cases the VPN stuck during this time ...
we saw our Link Selection timers where much too short, so we set it back to default.
in the Global Properties, -> Advanced Settings -> Firewall 1 -> Resolver
also we added the Link Selection Probing Port :259 to the PrioQ: SK105762.
in $FWDIR/conf/prioq.conf
add
#RDP259
{ROUTE,any,any,0,259,17}
so finally we made out of a lame duck 15600 with average load of 60% are super relaxed gateway with 10% average load!
for us this was mission solved!
- Mark as New
- Bookmark
- Subscribe
- Mute
- Subscribe to RSS Feed
- Permalink
- Report Inappropriate Content
Hello Again,
soon after that improvement we encountered another nasty thing ... the NIC driver for the 1GB copper module restarted all the time. Sometimes it caused sporadic VPN outages.
in /var/log/messages*
Feb 3 10:47:47 2022 XXXXXXXX kernel: igb 0000:8b:00.1: Detected Tx Unit Hang
Feb 3 10:47:48 2022 XXXXXXXX kernel: Tx Queue <3>
Feb 3 10:47:48 2022 XXXXXXXX kernel: TDH <1f2>
Feb 3 10:47:48 2022 XXXXXXXX kernel: TDT <1f2>
Feb 3 10:47:48 2022 XXXXXXXX kernel: next_to_use <1f2>
Feb 3 10:47:48 2022 XXXXXXXX kernel: next_to_clean <84>
Feb 3 10:47:48 2022 XXXXXXXX kernel: buffer_info[next_to_clean]
Feb 3 10:47:48 2022 XXXXXXXX kernel: time_stamp <1aea56589>
Feb 3 10:47:48 2022 XXXXXXXX kernel: next_to_watch <ffff88071d990850>
Feb 3 10:47:48 2022 XXXXXXXX kernel: jiffies <1aea569c6>
Feb 3 10:47:48 2022 XXXXXXXX kernel: desc.status <1748001>
this little guy is:
ethtool -i eth2-02
driver: igb
version: 5.3.5.20
firmware-version: 1.63, 0x800009fb
expansion-rom-version:
bus-info: 0000:8b:00.1
Line card 2 model: CPAC-8-1C-B
after increasing the RX Ringbuffers, even if it says TX the issue was gone ...
ethtool -g eth2-02
Ring parameters for eth2-02:
Pre-set maximums:
RX: 4096
RX Mini: 0
RX Jumbo: 0
TX: 4096
Current hardware settings:
RX: 2048
RX Mini: 0
RX Jumbo: 0
TX: 1024
This stopped the driver malfunctions ...
Also the VPN outtages which were related to this erros stopped.
And the port errors on the NICs dropped to 0 after that ...
- Mark as New
- Bookmark
- Subscribe
- Mute
- Subscribe to RSS Feed
- Permalink
- Report Inappropriate Content
Thank you for the detailed responses. I expect our disconnections are related to IPS and acceleration. I'm waiting back from TAC to see what they find but this has been going on since the start of Jan and we still have to reboot the firewalls twice a week.
Another thing I can't understand is why we only have only 3% accelerated conns and 96% accelerated pkts.
Accelerated conns/Total conns : 3890/103885 (3%)
Accelerated pkts/Total pkts : 2134734958/2202831265 (96%)
F2Fed pkts/Total pkts : 68096307/2202831265 (3%)
F2V pkts/Total pkts : 22080435/2202831265 (1%)
CPASXL pkts/Total pkts : 375365502/2202831265 (17%)
PSLXL pkts/Total pkts : 1627408500/2202831265 (73%)
- Mark as New
- Bookmark
- Subscribe
- Mute
- Subscribe to RSS Feed
- Permalink
- Report Inappropriate Content
As far as your low accelerated conns percentage, please provide the output of enabled_blades and fwaccel stat.
Gaia 4.18 (R82) Immersion Tips, Tricks, & Best Practices Video Course
Now Available at https://shadowpeak.com/gaia4-18-immersion-course
Now Available at https://shadowpeak.com/gaia4-18-immersion-course
- Mark as New
- Bookmark
- Subscribe
- Mute
- Subscribe to RSS Feed
- Permalink
- Report Inappropriate Content
fw vpn cvpn urlf av appi ips identityServer SSL_INSPECT anti_bot content_awareness mon
+---------------------------------------------------------------------------------+
|Id|Name |Status |Interfaces |Features |
+---------------------------------------------------------------------------------+
|0 |SND |enabled |eth3-01,Mgmt,Sync, |Acceleration,Cryptography |
| | | |eth1-01,eth3-04,eth2-01, | |
| | | |eth2-04 |Crypto: Tunnel,UDPEncap,MD5, |
| | | | |SHA1,3DES,DES,AES-128,AES-256,|
| | | | |ESP,LinkSelection,DynamicVPN, |
| | | | |NatTraversal,AES-XCBC,SHA256, |
| | | | |SHA384,SHA512 |
+---------------------------------------------------------------------------------+
Accept Templates : disabled by Firewall
Layer Policy_Corporate_2020 Security disables template offloads from rule #364
Throughput acceleration still enabled.
Drop Templates : enabled
NAT Templates : disabled by Firewall
Layer Policy_Corporate_2020 Security disables template offloads from rule #364
Throughput acceleration still enabled.
- Mark as New
- Bookmark
- Subscribe
- Mute
- Subscribe to RSS Feed
- Permalink
- Report Inappropriate Content
Check how your Threat Prevention policy is configured for the Anti-bot blade; it should only be scanning traffic to and from the Internet otherwise its reputational checks (which can't be performed by SecureXL) will keep your conns/sec (Accept templates) value very low or even zero.
You probably have a DCE-based service in rule 364 that is halting templating, try to move that service/rule as far down in your rulebase as possible which should improve the templating rate.
Gaia 4.18 (R82) Immersion Tips, Tricks, & Best Practices Video Course
Now Available at https://shadowpeak.com/gaia4-18-immersion-course
Now Available at https://shadowpeak.com/gaia4-18-immersion-course
- Mark as New
- Bookmark
- Subscribe
- Mute
- Subscribe to RSS Feed
- Permalink
- Report Inappropriate Content
The IPS policy's were configured by the previous admin and I'll be honest I don't quite understand how it has been done. Below is both the AV & AntiBot and the IPS only
Yeah we have 3x DCE-based rules at the end of the ruleset before the final drop rule.
- Mark as New
- Bookmark
- Subscribe
- Mute
- Subscribe to RSS Feed
- Permalink
- Report Inappropriate Content
Yeah that AV & ABOT layer is tanking your conns/sec templating rate, especially the last rule.
Make sure that zone "ExternalZone" is associated with your firewall's external interface (it should be by default but double-check it), then I'd recommend disabling all rules in that AV & ABOT layer and adding a new rule like this:
Protected Scope: ExternalZone
Action: _AV_ABOT
Track: All Options
Install On: Policy Targets
Keep in mind that your _AV_ABOT profile will have additional settings for AV that control whether it happens inbound or outbound or both, may want to verify those to ensure they meet your requirements. Once implemented and installed immediately visit http://cpcheckme.com through the firewall and run all tests to verify that AB and AV are still working the way you expect.
Next run fwaccel stats -r to clear acceleration statistics, wait an hour or two then check again with fwaccel stats -s. Conns/sec templating rate should be much better assuming there is not something else present that is killing templating.
Gaia 4.18 (R82) Immersion Tips, Tricks, & Best Practices Video Course
Now Available at https://shadowpeak.com/gaia4-18-immersion-course
Now Available at https://shadowpeak.com/gaia4-18-immersion-course
- Mark as New
- Bookmark
- Subscribe
- Mute
- Subscribe to RSS Feed
- Permalink
- Report Inappropriate Content
Thank you for your reply. I have added the rule and disabled the existing rules and it is still the same after resetting the counters and waiting 5 hours. I double checked the ExternalZone and it is set correctly.
Accelerated conns/Total conns : 1193/80419 (1%)
Accelerated pkts/Total pkts : 2186324413/2246496761 (97%)
F2Fed pkts/Total pkts : 60172348/2246496761 (2%)
F2V pkts/Total pkts : 17591725/2246496761 (0%)
CPASXL pkts/Total pkts : 217954332/2246496761 (9%)
PSLXL pkts/Total pkts : 1808730847/2246496761 (80%)
CPAS pipeline pkts/Total pkts : 0/2246496761 (0%)
PSL pipeline pkts/Total pkts : 0/2246496761 (0%)
CPAS inline pkts/Total pkts : 0/2246496761 (0%)
PSL inline pkts/Total pkts : 0/2246496761 (0%)
QOS inbound pkts/Total pkts : 0/2246496761 (0%)
QOS outbound pkts/Total pkts : 0/2246496761 (0%)
Corrected pkts/Total pkts : 0/2246496761 (0%)
- Mark as New
- Bookmark
- Subscribe
- Mute
- Subscribe to RSS Feed
- Permalink
- Report Inappropriate Content
Hey @RichUK ...I apologize if I mention something that was already discussed before, but 2 things came to my mind when I read your post.
1) I know there used to be an option to check under office mode section on gateway (cluster) properties to support multiple external interfaces, and I know this helped solve the issue with lots of customers in the past, even if they had only single external interface configured. Now, I looked in my R81.10 lab and it seems that CP took that option away, but maybe someone from CP can confirm if it was moved somewhere else.
and
2) Just wondering, did you ever try running capture on port 18234 (tunnel test) when this happens with any given user? From expert mode, just run fw monitor -e "accept port(18234);" and see what you get.
Best,
Andy
Andy
- Mark as New
- Bookmark
- Subscribe
- Mute
- Subscribe to RSS Feed
- Permalink
- Report Inappropriate Content
It is probably something in your Threat Prevention config that is tanking the templating, to verify this try the following (note that doing this will subject your organization to attacks during the test period - use at your own risk!):
fw amw unload
fwaccel stats -r
(wait 5 minutes)
fwaccel stats -s (is templating [conns/sec] rate much better?)
fw amw fetch local
If the templating rate gets much better during the test period it is definitely something in your TP configuration. If it doesn't improve the issue lies elsewhere and will probably require a TAC case to figure out where it is.
Gaia 4.18 (R82) Immersion Tips, Tricks, & Best Practices Video Course
Now Available at https://shadowpeak.com/gaia4-18-immersion-course
Now Available at https://shadowpeak.com/gaia4-18-immersion-course
- Mark as New
- Bookmark
- Subscribe
- Mute
- Subscribe to RSS Feed
- Permalink
- Report Inappropriate Content
Hi, I hate when people post forum problems and then never reply when it is resolved, I just realised I did this.
The short answer is that it was IPS enabled with a protected scope of Any, and Content Awareness.
The long answer involves a fluke. We were having real issues with dropouts, and we just couldn't figure it out. One day, monitoring the CPU processes, we noticed a spike with users saying they are losing connectivity. Apologies, but I can’t remember the exact details, but the process pointed to IPS inspection using the IP of an interface that is connected to our community network, but it still goes through the corporate firewall. I asked the Desktop team if they were doing any work at the libraries, and they were imaging computers, and the image server was connected to another network on the firewall. This was the lightbulb moment. Looking at the IPS ruleset (configured by ex-employee) the IPS protected scope was set to Any. I changed the scope to our external IP range and instantly the CPU % dropped.
Everything was fine for a couple of days, but then suddenly the CPU spiked again and many of our user’s lost connectivity. Again, monitor the IP address causing the spike, it was still coming from the community network. This time the process was associated with Content Awareness. We removed CA from the ruleset, and we have not had a problem since. 10 months now. The firewalls spiked inspecting PDF’s downloading off the internet. Check Point supported wanted to enable CA again to try to understand the issue, but after months of disconnections, we decided to not enable it.
- Mark as New
- Bookmark
- Subscribe
- Mute
- Subscribe to RSS Feed
- Permalink
- Report Inappropriate Content
Thanks a lot mate for letting us know. So interesting you mentioned CA blade, as I worked with customer that had soooo many issues with it. We were able to finally fix all of them after working with escalations for 2 months or so. Glad its all working for you know.
Cheers.
Best,
Andy
Andy
- Mark as New
- Bookmark
- Subscribe
- Mute
- Subscribe to RSS Feed
- Permalink
- Report Inappropriate Content
Thanks for the followup, IPS is a frequent source of performance problems due to it being accidentally configured to inspect high-speed internal traffic with Protections activated that have a High/Critical performance impact. Content Awareness does some of its inspection in user space security server processes on the gateway (dlpu, dlpa, & cp_file_convert), and really should only be applied to traffic going to the Internet and not between internal networks to avoid performance problems.
Gaia 4.18 (R82) Immersion Tips, Tricks, & Best Practices Video Course
Now Available at https://shadowpeak.com/gaia4-18-immersion-course
Now Available at https://shadowpeak.com/gaia4-18-immersion-course
Leaderboard
Epsum factorial non deposit quid pro quo hic escorol.
| User | Count |
|---|---|
| 22 | |
| 18 | |
| 8 | |
| 7 | |
| 6 | |
| 6 | |
| 6 | |
| 5 | |
| 5 | |
| 4 |
Upcoming Events
Wed 03 Dec 2025 @ 10:00 AM (COT)
Última Sesión del Año – CheckMates LATAM: ERM & TEM con ExpertosThu 04 Dec 2025 @ 12:30 PM (SGT)
End-of-Year Event: Securing AI Transformation in a Hyperconnected World - APACThu 04 Dec 2025 @ 03:00 PM (CET)
End-of-Year Event: Securing AI Transformation in a Hyperconnected World - EMEAThu 04 Dec 2025 @ 02:00 PM (EST)
End-of-Year Event: Securing AI Transformation in a Hyperconnected World - AmericasWed 03 Dec 2025 @ 10:00 AM (COT)
Última Sesión del Año – CheckMates LATAM: ERM & TEM con ExpertosThu 04 Dec 2025 @ 12:30 PM (SGT)
End-of-Year Event: Securing AI Transformation in a Hyperconnected World - APACThu 04 Dec 2025 @ 03:00 PM (CET)
End-of-Year Event: Securing AI Transformation in a Hyperconnected World - EMEAThu 04 Dec 2025 @ 02:00 PM (EST)
End-of-Year Event: Securing AI Transformation in a Hyperconnected World - AmericasAbout CheckMates
Learn Check Point
Advanced Learning
YOU DESERVE THE BEST SECURITY
©1994-2025 Check Point Software Technologies Ltd. All rights reserved.
Copyright
Privacy Policy
About Us
UserCenter


