- Products
- Learn
- Local User Groups
- Partners
- More
Check Point WAF TechTalk:
Introduction and New Features
AI Security Masters E6: When AI Goes Wrong -
Hallucinations, Jailbreaks, and the Curious Behavior of AI Agents
Ink Dragon: A Major Nation-State Campaign
Watch HereAI Security Masters E5:
Powering Prevention: The AI Driving Check Point’s ThreatCloud
CheckMates Go:
CheckMates Fest
This oneliner will do the work for you.
Use this onliner to start easy a debug without entering all debug commands by hand.
echo 'clear; echo -n "Input debug filter: "; read dbfilter; function ctrl_c { fw ctl debug 0; rm /tmp/vd; exit 0;}; trap ctrl_c INT; fw ctl debug -buf 20480; fw ctl debug $dbfilter;echo -e "\e[7m"; echo " Stop VPN debug with CTRL-C "; echo -e "\e[0m"; fw ctl kdebug -f -T | tee /var/log/edebug.log; sleep 100000000;' > /tmp/vd; chmod 770 /tmp/vd; /tmp/vd
What happens when you execute! It is a small script that executes the following commands:
fw ctl debug -buf 8192
fw ctl debug [entered debug filter]
fw ctl kdebug -f
[Wait until CTRL+C is pressed]
fw ctl debug 0
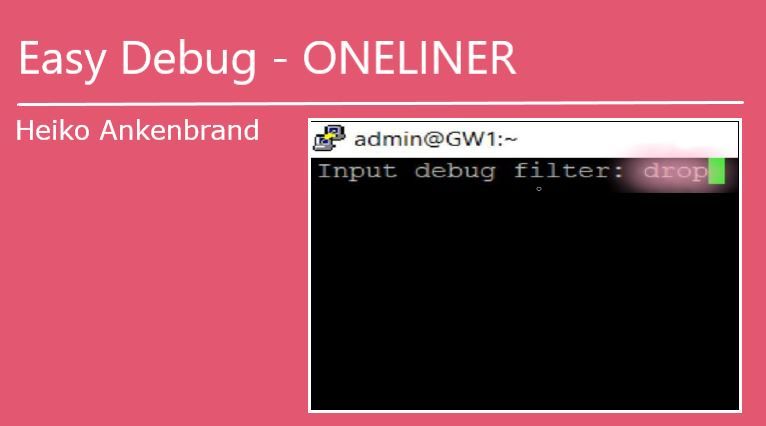
First you will be asked about the debug filters! Here you can enter the kernel debug flag (see picture below).
The example is comparable to "fw ctl zdebug drop". But with the advantage that the debug buffer is 8196K large. All debug flags described in this PDF (Kernel Debug Flags R80.10 , Kernel Debug Flags R77, R80.40 Kernel Debug Syntax) can be used here.
If the firewall issue has occurred, you only need to stop the oneliner via CTRL-C and the debug will be stopped. All debug filters are cleared.
Furthermore the output of the debug is stored in the file /var/log/edebug.log for further analysis.
Attention:
If you turn on debugging, this will affect the performance of the firewall.
These are the basic kernel FW debug parameters:
Debugging Modules
| Module | Explanation |
| Kiss | Kernel I/s (Kernel Infrastructure) |
| Kissflow | Kernel I/s communication with other modules and policy enforcement |
| fw | Firewall, the most common module |
| h323 | H323 VoIP traffic module |
| Multik | CoreXL module |
| uc | UserCheck module |
| dlpk | Data Loss Prevention module |
| cluster | ClusterXL module |
| CPAS | Check Point Active Streaming (unlike PSL) |
| cmi_loader | Signature loading for Security blades |
| NRB | Next Rule Base, security blades rulebase |
| SGEN | Security Gateway Enforcement (stateful) |
| RAD_KERNEL | Very important I/S, DNS resolving, string matching, md5sum check against database and 3rd party, resource categorization |
| WS | Web Security module - HTTP inspection by all blades |
| APPI | Application Control module |
| CI | Content Inspection (Anti-Virus, Anti-Bot ) |
| RTM | Real Time Monitoring |
| VPN | VPN module |
| SFT | Secure File Type |
| UP | Unified Policy module |
Common traffic flags in fw module
| Module | Explanation |
| drop | the connection that was dropped, the function in the firewall that dropped it and the reason |
| conn | information from the connections table (everything that can be seen with this command #fw tab -t 8158) . Direction of packets in connections, source/destination of IP and ports, service type, handler, timeout, the rule that this packet is matched on, ETC |
| ld | this flag refers to the kernel dynamic tables infrastructure. It reads and write everything that is written to any kernel table. Adding this flag to the debug syntax may cause the machine high CPU and can even cause the machine to hang. Check load before performing this debug on production environment. |
| nat | basic NAT information |
| xlate | the firewall NAT infrastructure - basic NAT information + NAT cache |
| xltrc | NAT additional information, print NAT rulebase information and more information from the NAT kernel table (fwx_alloc) |
| packet | information on actions performed on packet - like accept, drop, fragment, inspection |
| packval | advanced information of the packet's header. stateless verifications - sequences, fragments, translations and other header changes and verifications. |
| vm | shows actions of all the virtual chains that can be seen with the command: # fw ctl chain on the traffic that go through the chain handle function fw_filter_chain |
| tcpstr | TCP streaming mechanism, organize TCP packets by order and checks protocol messages. debug the PSL I/S. (passive streaming layer) |
| chain | chain cookie information, chain modules |
| chainfwd | chain forwarding - related to fwha_perform_chain_forwarding global kernel variable (clusterXL only) |
| cookie | the kernel saves information and holds connections for inspection, this flag will show virtual de-fragmentation and cookie issues (cookies in the data structure holding the packets) |
| hold | holding mechanism and all packets being held / released |
Common IPS flags in fw module
| Module | Explanation |
| aspii | Accelerated Stateful Protocol Inspection Infrastructure (INSPECT streaming) |
| spii | Stateful Protocol Inspection Infrastructure |
| cmi | Context Management Infrastructure - IPS signature manager |
| advp | IPS and Application Control signatures, contexts and patterns |
| synatk | IPS protection "SYN Attack" (SYNDefender) |
Demo video:
This oneliner will do the work for you.
Use this onliner to start easy a debug without entering all debug commands by hand.
echo 'clear; echo -n "Input debug filter: "; read dbfilter; function ctrl_c { fw ctl debug 0; rm /tmp/vd; exit 0;}; trap ctrl_c INT; fw ctl debug -buf 20480; fw ctl debug $dbfilter;echo -e "\e[7m"; echo " Stop VPN debug with CTRL-C "; echo -e "\e[0m"; fw ctl kdebug -f -T | tee /var/log/edebug.log; sleep 100000000;' > /tmp/vd; chmod 770 /tmp/vd; /tmp/vd

Hi Heiko, any chance you can add an option to include an automatic timeout as a sort of "dead-man's switch" for possible runaway debugs?
About CheckMates
Learn Check Point
Advanced Learning
YOU DESERVE THE BEST SECURITY
