- Products
Network & SASE IoT Protect Maestro Management OpenTelemetry/Skyline Remote Access VPN SASE SD-WAN Security Gateways SmartMove Smart-1 Cloud SMB Gateways (Spark) Threat PreventionCloud Cloud Network Security CloudMates General CloudGuard - WAF Talking Cloud Podcast Weekly ReportsSecurity Operations Events External Risk Management Incident Response Infinity AI Infinity Portal NDR Playblocks SOC XDR/XPR Threat Exposure Management
- Learn
- Local User Groups
- Partners
- More

This website uses Cookies. Click Accept to agree to our website's cookie use as described in our Privacy Policy. Click Preferences to customize your cookie settings.
- Products
- AI Security
- Developers & More
- Check Point Trivia
- CheckMates Toolbox
- General Topics
- Products Announcements
- Threat Prevention Blog
- Upcoming Events
- Americas
- EMEA
- Czech Republic and Slovakia
- Denmark
- Netherlands
- Germany
- Sweden
- United Kingdom and Ireland
- France
- Spain
- Norway
- Ukraine
- Baltics and Finland
- Greece
- Portugal
- Austria
- Kazakhstan and CIS
- Switzerland
- Romania
- Turkey
- Belarus
- Belgium & Luxembourg
- Russia
- Poland
- Georgia
- DACH - Germany, Austria and Switzerland
- Iberia
- Africa
- Adriatics Region
- Eastern Africa
- Israel
- Nordics
- Middle East and Africa
- Balkans
- Italy
- Bulgaria
- Cyprus
- APAC
AI Security Masters
E1: How AI is Reshaping Our World
MVP 2026: Submissions
Are Now Open!
What's New in R82.10?
Watch NowOverlap in Security Validation
Help us to understand your needs better
CheckMates Go:
Maestro Madness
Turn on suggestions
Auto-suggest helps you quickly narrow down your search results by suggesting possible matches as you type.
Showing results for
- CheckMates
- :
- Products
- :
- Network & SASE
- :
- SMB Gateways (Spark)
- :
- Re: SMB CPU 100%
Options
- Subscribe to RSS Feed
- Mark Topic as New
- Mark Topic as Read
- Float this Topic for Current User
- Bookmark
- Subscribe
- Mute
- Printer Friendly Page
Turn on suggestions
Auto-suggest helps you quickly narrow down your search results by suggesting possible matches as you type.
Showing results for
Are you a member of CheckMates?
×
Sign in with your Check Point UserCenter/PartnerMap account to access more great content and get a chance to win some Apple AirPods! If you don't have an account, create one now for free!
- Mark as New
- Bookmark
- Subscribe
- Mute
- Subscribe to RSS Feed
- Permalink
- Report Inappropriate Content
SMB CPU 100%
Hi everyone,
One of our branches has an 1800 R81.10.08 (996001683) centrally managed by a SMS R81.20 which most of time has 100% cpu usage, blades that are enabled:
- Firewall
- Vpn S2S
- Antivirus
- Identity Awareness
- Application Control
- Https Inspection
Within VPN we share domain services (VoIP, AD, Printing) in order to connect to other branches and main office.
We recently enabled HTTPS because some pages weren't working OK, we've been monitoring load usage on appliance and has been almost at 100% cpu usage.
Our HTTPS rulebase bypasses some categories as recommended (financial, business, etc.), internal traffic and some custom application/sites.
When monitoring with top and cpview, shows that multiple wstlsd processes are consuming most of CPU.
Investigated further with fw ctl multik print_heavy_conn and found that most of connections were going to Office 365 services, we added a rule to accept this traffic at fw layer and still shows it the same.
At deactivating HTTPS, concurrent connections reduce in > 50% of hosts.
We tested on site and found no issues at all,
This branch has 200 hosts average, and we want to know how can we low cpu usage and if a better equipment is required?
20 Replies
- Mark as New
- Bookmark
- Subscribe
- Mute
- Subscribe to RSS Feed
- Permalink
- Report Inappropriate Content
What is the isp speed up and down. And how much in total of mb goes through this firewall you think? You can check this info with cpview command
-------
Please press "Accept as Solution" if my post solved it 🙂
Please press "Accept as Solution" if my post solved it 🙂
- Mark as New
- Bookmark
- Subscribe
- Mute
- Subscribe to RSS Feed
- Permalink
- Report Inappropriate Content
- Mark as New
- Bookmark
- Subscribe
- Mute
- Subscribe to RSS Feed
- Permalink
- Report Inappropriate Content
Might be worth TAC case.
Best,
Andy
Andy
- Mark as New
- Bookmark
- Subscribe
- Mute
- Subscribe to RSS Feed
- Permalink
- Report Inappropriate Content
Had previously an SR but was closed regarding that were too many connections for appliance capacity.
- Mark as New
- Bookmark
- Subscribe
- Mute
- Subscribe to RSS Feed
- Permalink
- Report Inappropriate Content
You can always open new one and reference the old case, thats what I do sometimes.
Best,
Andy
Best,
Andy
Andy
- Mark as New
- Bookmark
- Subscribe
- Mute
- Subscribe to RSS Feed
- Permalink
- Report Inappropriate Content
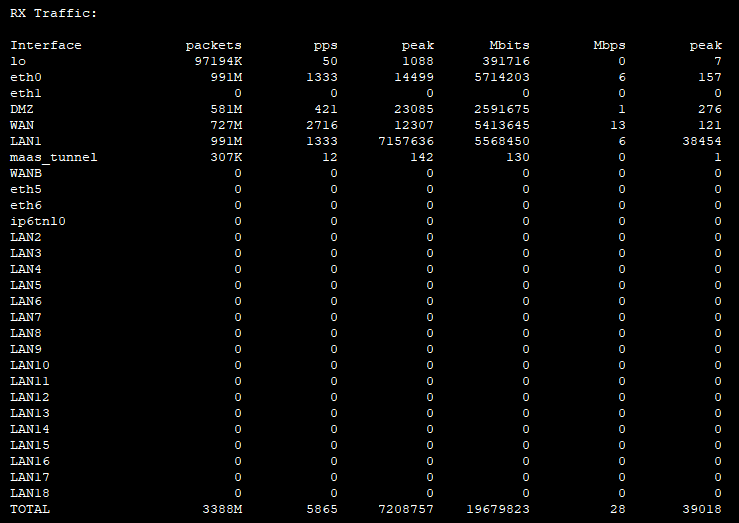
Share please 2 screenshot from cpview -> network -> interfaces -> traffic and then RX traffic and TX
-------
Please press "Accept as Solution" if my post solved it 🙂
Please press "Accept as Solution" if my post solved it 🙂
- Mark as New
- Bookmark
- Subscribe
- Mute
- Subscribe to RSS Feed
- Permalink
- Report Inappropriate Content
- Mark as New
- Bookmark
- Subscribe
- Mute
- Subscribe to RSS Feed
- Permalink
- Report Inappropriate Content
I checked but I miss column Mbps and peak (for Mbps) they are the last 2 on the right.
Looks like the screenshot just cut them off?
-------
Please press "Accept as Solution" if my post solved it 🙂
Please press "Accept as Solution" if my post solved it 🙂
- Mark as New
- Bookmark
- Subscribe
- Mute
- Subscribe to RSS Feed
- Permalink
- Report Inappropriate Content
- Mark as New
- Bookmark
- Subscribe
- Mute
- Subscribe to RSS Feed
- Permalink
- Report Inappropriate Content
I hope that traffic peak on LAN1 is a bug, that is a lot of traffic.
You got anyway to verify those numbers? Maybe with monitoring tool that collected this data?
-------
Please press "Accept as Solution" if my post solved it 🙂
Please press "Accept as Solution" if my post solved it 🙂
- Mark as New
- Bookmark
- Subscribe
- Mute
- Subscribe to RSS Feed
- Permalink
- Report Inappropriate Content
I checked cpview on historical mode and found that these peaks are produced when our main ISP is down and appliance switches to auxiliary antenna (main office) and redirects all of the traffic (wan and internal)
What we don't really understand is that other appliance with 30-40% hosts and same blades enables has fewer concurrent connections (13k | 4k), so we suspect that maybe there is an infected host.
- Mark as New
- Bookmark
- Subscribe
- Mute
- Subscribe to RSS Feed
- Permalink
- Report Inappropriate Content
That came to my mind before, it certainly makes sense. Do you see any logs indicating influx of specific IP?
Best,
Andy
Best,
Andy
Andy
- Mark as New
- Bookmark
- Subscribe
- Mute
- Subscribe to RSS Feed
- Permalink
- Report Inappropriate Content
Time for a doctor spark health check:
https://sc1.checkpoint.com/documents/SMB_R81.10.X/CLI/EN/Content/Topics/drsmb.htm
I think this hardware should run with this amount of data according the datasheet:
https://resources.checkpoint.com/datasheet/check-point-1600-and-1800-security-gateways-datasheet
If you want you can share some report details here. But I would open TAC case for this.
Could be that the report shows you have to many users / unique IP's and shows then hardware performance issues
-------
Please press "Accept as Solution" if my post solved it 🙂
Please press "Accept as Solution" if my post solved it 🙂
- Mark as New
- Bookmark
- Subscribe
- Mute
- Subscribe to RSS Feed
- Permalink
- Report Inappropriate Content
We previously had trouble with CCTV traffic within VPN Community, so for testing purposes we created a firewall rule dropping all traffic coming to those segments,
On top command wstlsd processes were consuming most of CPU instances, so after installing policy, load average decreased from 10 to 0-1. Still trying to figure out if our rulebase needs an optimization or appliance has a failure.
Concurrent connections remain after those changes, but we haven't seen any significant increases on load.
Health check reports were generated and are attached to my reply.
Thanks for your help.
- Mark as New
- Bookmark
- Subscribe
- Mute
- Subscribe to RSS Feed
- Permalink
- Report Inappropriate Content
Hey, did you ever end up opening new TAC case and referencing old one? Personally, I would do that and also attach anything you had generated so far.
Best,
Andy
Best,
Andy
Andy
- Mark as New
- Bookmark
- Subscribe
- Mute
- Subscribe to RSS Feed
- Permalink
- Report Inappropriate Content
I checked the reports and they look good. Tho it is a snapshot of the health.
Any issues at this moment? Not sure if I can help any further if the issue is gone.
Btw you do full https inspection or only: SSL Status:
Only HTTPS Categorization is enabled (Only certificate check)
-------
Please press "Accept as Solution" if my post solved it 🙂
Please press "Accept as Solution" if my post solved it 🙂
- Mark as New
- Bookmark
- Subscribe
- Mute
- Subscribe to RSS Feed
- Permalink
- Report Inappropriate Content
Users were unable to access to websites and logs show only "Error" but no information further.
CPU increased and after policy install decreased but issues were still present.
Ended up opening a SR and today tech conclude following:
- Exhaustion of sockets
- DNS Issues
- Certificate Issues
- wstlsd / wsdnsd crashes for a possible bug or misconfiguration
We disabled blade for now and we'll be waiting for R&D and TAC update.
- Mark as New
- Bookmark
- Subscribe
- Mute
- Subscribe to RSS Feed
- Permalink
- Report Inappropriate Content
If you disable https inspection, all works fine? If yes, does it make any difference if blade is on and you make bunch of exceptions like below (example from my lab)
Best,
Andy

Best,
Andy
Andy
- Mark as New
- Bookmark
- Subscribe
- Mute
- Subscribe to RSS Feed
- Permalink
- Report Inappropriate Content
- Mark as New
- Bookmark
- Subscribe
- Mute
- Subscribe to RSS Feed
- Permalink
- Report Inappropriate Content
To me, below looks right...
Dr. Load - Gateway Performance Report:
Number of hosts: 187
Number of connections: 12687
Connection rate: 12487 per second
Throughput:
Receive: 8.490056 Mbps
Transmit: 10.254888 Mbps
Packet Rate:
Receive: 2776 packets per second
Transmit: 3900 packets per second
SSL Status:
Only HTTPS Categorization is enabled
Blade Status:
Blade IPS is disabled
Blade AV is enabled
Blade AB is disabled
Blade TE is disabled
Blade ASPAM is disabled
VPN-RA is disabled
VPN-S2S is active
Best,
Andy
Andy
Leaderboard
Epsum factorial non deposit quid pro quo hic escorol.
| User | Count |
|---|---|
| 5 | |
| 2 | |
| 2 | |
| 1 | |
| 1 |
Upcoming Events
Thu 18 Dec 2025 @ 10:00 AM (CET)
Cloud Architect Series - Building a Hybrid Mesh Security Strategy across cloudsThu 08 Jan 2026 @ 05:00 PM (CET)
AI Security Masters Session 1: How AI is Reshaping Our WorldThu 18 Dec 2025 @ 10:00 AM (CET)
Cloud Architect Series - Building a Hybrid Mesh Security Strategy across cloudsThu 08 Jan 2026 @ 05:00 PM (CET)
AI Security Masters Session 1: How AI is Reshaping Our WorldAbout CheckMates
Learn Check Point
Advanced Learning
YOU DESERVE THE BEST SECURITY
©1994-2025 Check Point Software Technologies Ltd. All rights reserved.
Copyright
Privacy Policy
About Us
UserCenter