- CheckMates
- :
- Products
- :
- Quantum
- :
- SMB Gateways (Spark)
- :
- IPS Bypass.
- Subscribe to RSS Feed
- Mark Topic as New
- Mark Topic as Read
- Float this Topic for Current User
- Bookmark
- Subscribe
- Mute
- Printer Friendly Page
Are you a member of CheckMates?
×- Mark as New
- Bookmark
- Subscribe
- Mute
- Subscribe to RSS Feed
- Permalink
- Report Inappropriate Content
IPS Bypass.
Good night.
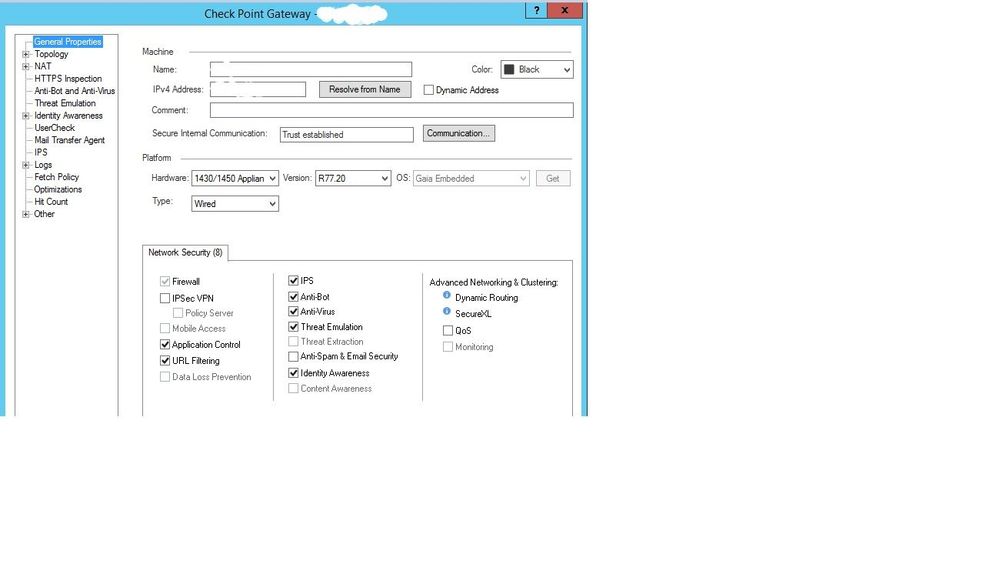
We have some branch office firewalls using R77.20.
The equipment model is 1450.
SMS uses version R80.10.
Sometimes IPS BYPASS happens and analyzing the logs is reporting high CPU consumption.
The problem is that every time I see the CPU consumption in the MONITOR CPU consumption is low.
Since the MONITORING blade is disabled on the firewall, I can not see the CPU usage history on the MONITOR.
In some research I found that the cause might be that in firewalls with more than one processor, even if the overall CPU utilization is low if one of the cores reaches a high value the firewall can activate the BYPASS IPS.
The problem may be caused by some process trapped in a particular CPU.
The problem reaches firewalls using version R77.20.
Is there any way to check CPU history via CLI?
Accepted Solutions
- Mark as New
- Bookmark
- Subscribe
- Mute
- Subscribe to RSS Feed
- Permalink
- Report Inappropriate Content
The sar command is not available on SMB devices GAiA Embedded. I use a little script (attached) that notes every 30s the output from cat /proc/meminfo, cpstat os -f multi_cpu, top -n1 -b, ps auxf and the time of the generated output. You can change to record data in other intervals or change commands.
- Mark as New
- Bookmark
- Subscribe
- Mute
- Subscribe to RSS Feed
- Permalink
- Report Inappropriate Content
- Mark as New
- Bookmark
- Subscribe
- Mute
- Subscribe to RSS Feed
- Permalink
- Report Inappropriate Content
Monitor blade is not disabled, it is just missing 🙂
The only way to monitor CPU usage over time is via SNMP.
If bypass happens for brief period of time there is nothing to worry about. But if it is for long time then you shall investigate it.
- Mark as New
- Bookmark
- Subscribe
- Mute
- Subscribe to RSS Feed
- Permalink
- Report Inappropriate Content
Thank you.
- Mark as New
- Bookmark
- Subscribe
- Mute
- Subscribe to RSS Feed
- Permalink
- Report Inappropriate Content
Thanks.
- Mark as New
- Bookmark
- Subscribe
- Mute
- Subscribe to RSS Feed
- Permalink
- Report Inappropriate Content
See if the sar command is available on embedded Gaia, if present there should be 30 days of system history including CPU utilization per core. Really don't recommend enabling the IPS Bypass feature since as you mentioned all it takes is just one CPU to exceed the high utilization water mark to disable/bypass IPS enforcement on ALL cores...
now available at maxpowerfirewalls.com
- Mark as New
- Bookmark
- Subscribe
- Mute
- Subscribe to RSS Feed
- Permalink
- Report Inappropriate Content
The sar command is not available on SMB devices GAiA Embedded. I use a little script (attached) that notes every 30s the output from cat /proc/meminfo, cpstat os -f multi_cpu, top -n1 -b, ps auxf and the time of the generated output. You can change to record data in other intervals or change commands.
- Mark as New
- Bookmark
- Subscribe
- Mute
- Subscribe to RSS Feed
- Permalink
- Report Inappropriate Content
I also keep IPS Bypass disabled here but for different reasons. 1. Don't want to compromise security and 2. Don't think CPU usage is definitive criteria to disable it, load average is better indicator.
- Mark as New
- Bookmark
- Subscribe
- Mute
- Subscribe to RSS Feed
- Permalink
- Report Inappropriate Content
Thanks
- Mark as New
- Bookmark
- Subscribe
- Mute
- Subscribe to RSS Feed
- Permalink
- Report Inappropriate Content
Thanks
- Mark as New
- Bookmark
- Subscribe
- Mute
- Subscribe to RSS Feed
- Permalink
- Report Inappropriate Content
I am having a similar problem in my lab immediately since I upgraded to r80.40 take 91. I didn't use to get IPS bypass events in take 87.
There is almost not traffic - 20 concurrent tcp sessions coming from one host I use for testing - and the cpu is idle most of the time. I see the cpu sometimes reaches 40% in cpview historic data.
I am certain the issue has to do with take 91 but I was wondering if there is a way to get more verbose logging to see how the system decides to bypass the IPS blade.
In a lab environment with almost not traffic, only one user, what % of packets is expected to go through the slow path? I have URL filtering, Anti bot , Antivirus, IPS enabled. I have disabled HTTPS inspection recently.
- Mark as New
- Bookmark
- Subscribe
- Mute
- Subscribe to RSS Feed
- Permalink
- Report Inappropriate Content
Are you talking about R80.40 JHFA 91 on your management server?
Because original post was about SMB appliance running embedded R77.20, so not likely to be relevant issues.
- Mark as New
- Bookmark
- Subscribe
- Mute
- Subscribe to RSS Feed
- Permalink
- Report Inappropriate Content
okay