Create a Post
cancel
Showing results for 
Search instead for 
Did you mean: 
IDoCare2022
Participant
Jump to solution

Skyline installation stuck at the Prometheus setup

Hi all, 


I did my first attempt setting up a Skyline server, but I'm struggling getting the Prometheus service up after adding statement from section (3.1 ) the github instructions 

( https://github.com/mmanningcp/skylineinstructions/blob/main/README.md

mentioned in the Youtube video ( https://youtu.be/FO2Rp9x31i0 ) from sk178566.


Then I setup Prometheus according to some other instructions found at https://serverspace.io/support/help/install-prometheus-ubuntu-20-04


I get the server running fine again, but as soon as I add the Github 3.1 section statement. The service fails to load.


Below is what my /etc/prometheus/prometheus.yml looks like. 

When I disable the last 2 lines ...

( the ones from the github section 3.1 instructions, only with my own local server IP in it obviously )

.. I can't start the service any longer. If I comment out those 2 lines, the Prometheus service runs fine and I can access my servers' Prometheus service on port 9090

------------------------------------------------------------------------------

checkpoint@skyline:/etc/prometheus$ cat prometheus.yml
# my global config
global:
  scrape_interval: 15s # Set the scrape interval to every 15 seconds. Default is every 1 minute.
  evaluation_interval: 15s # Evaluate rules every 15 seconds. The default is every 1 minute.
  # scrape_timeout is set to the global default (10s).

# Alertmanager configuration
alerting:
  alertmanagers:
    - static_configs:
        - targets:
          # - alertmanager:9093

# Load rules once and periodically evaluate them according to the global 'evaluation_interval'.
rule_files:
  # - "first_rules.yml"
  # - "second_rules.yml"

# A scrape configuration containing exactly one endpoint to scrape:
# Here it's Prometheus itself.
scrape_configs:
  # The job name is added as a label `job=<job_name>` to any timeseries scraped from this config.
  - job_name: "prometheus"

    # metrics_path defaults to '/metrics'
    # scheme defaults to 'http'.

    static_configs:
       - targets: ["localhost:9090"]

         #    remote_write:
         #    - url: "http://192.168.111.104:9090/api/v1/write"

------------------------------------------------------------------------------


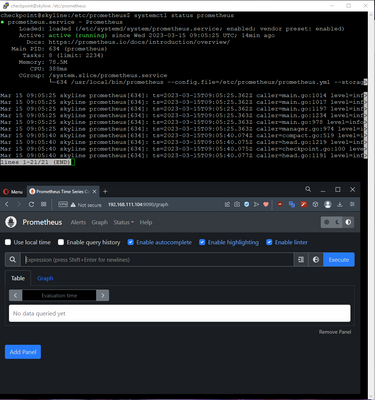
Working : 


IDoCare2022_0-1678873124623.png


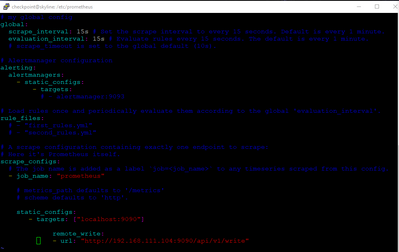
Then I remove the comment and activate the statements in the yml file : 


             remote_write:
             - url: "http://192.168.111.104:9090/api/v1/write"


IDoCare2022_1-1678873124626.png


then I get this :


IDoCare2022_2-1678873124631.png


I did a dos2unix on the yml file, didn't change anything. 


Some more info : 


-checkpoint@skyline:/usr/local/bin$ ./prometheus --version
prometheus, version 2.42.0 (branch: HEAD, revision: 225c61122d88b01d1f0eaaee0e05b6f3e0567ac0)
  build user:       root@c67d48967507
  build date:       20230201-07:53:32
  go version:       go1.19.5
  platform:         linux/amd64


-checkpoint@skyline:/usr/local/bin$ cat /etc/issue
Ubuntu 22.04.2 LTS \n \l


Any ideas please ? Thx.

0 Kudos
1 Solution

Accepted Solutions
IDoCare2022
Participant

FYI everyone : problem has been found. When editing the default prometheus.yml config file with vim, I went to the last position in the defaut config file and hit ENTER. Followed by the lines as mentioned in the tutorial.

remote_write:
   - url: "http://localhost:9090/api/v1/write"


They got added, but by default not in the beginning of the new line. ( several spaces in front ). 

It seems the config file does not like this. The remote_write: ...requires to be put on the first position of a new line. 

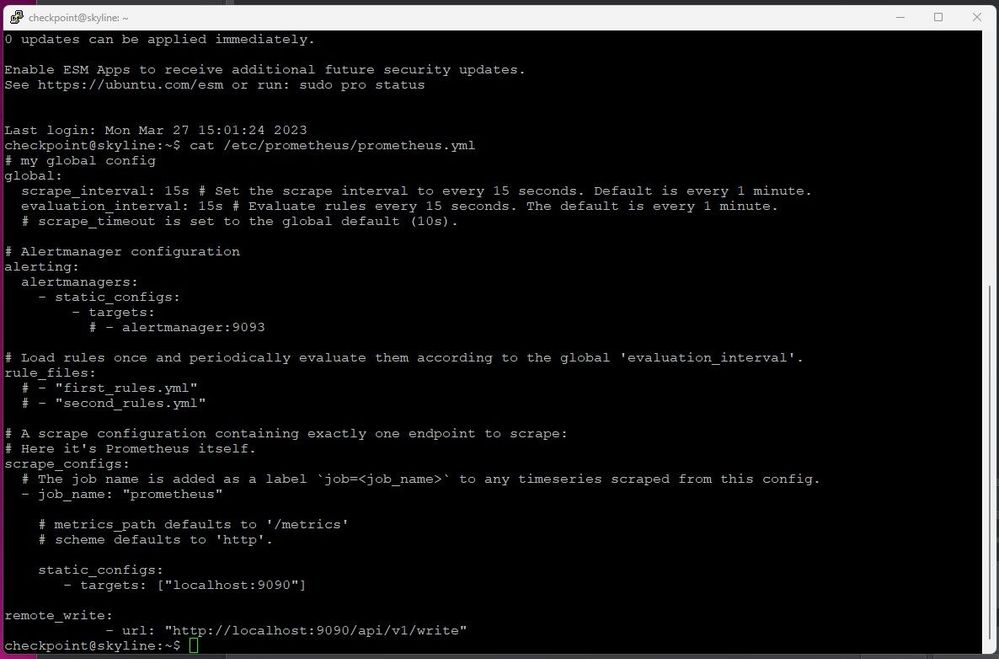
So, below is how it finally works. Thanks for pointing me to that "promtool". Although at first I had no clue ( since the statement static_configs: ... for example, also does not start on position 1 of that line ), I knew what line to look for over and over again.

prometheus-cfg.jpg

View solution in original post

7 Replies
michael3
Participant

Hallo,

first, as you set this up as service, you can check with journalctl -xe the error. With the newest putty version, you can make the window big enough to read the whole line.

Second, with Prometheus there is a Config Syntax check tool integrated. Whereever you put the binaray prometheus, there also should be the promtool binary, and with this you can check the yaml config files:
promtool check config /etc/prometheus/prometheus.yml

This will provide you with information about the error.

Last, I didn't use the actual IP of the server, but instead:

remote_write:
   - url: "http://localhost:9090/api/v1/write"

This works for me so far.


0 Kudos
IDoCare2022
Participant

Thanks for this info, I'll check it in my lab at home and post feedback if that helped. 🤓

0 Kudos
IDoCare2022
Participant

FYI everyone : problem has been found. When editing the default prometheus.yml config file with vim, I went to the last position in the defaut config file and hit ENTER. Followed by the lines as mentioned in the tutorial.

remote_write:
   - url: "http://localhost:9090/api/v1/write"


They got added, but by default not in the beginning of the new line. ( several spaces in front ). 

It seems the config file does not like this. The remote_write: ...requires to be put on the first position of a new line. 

So, below is how it finally works. Thanks for pointing me to that "promtool". Although at first I had no clue ( since the statement static_configs: ... for example, also does not start on position 1 of that line ), I knew what line to look for over and over again.

prometheus-cfg.jpg

CPengine
Participant

I seem to have gotten stuck on the Prometheus install with the service not starting also. I get the following message:

● prometheus.service - Prometheus Server
Loaded: loaded (/etc/systemd/system/prometheus.service; disabled; vendor preset: enabled)
Active: failed (Result: exit-code) since Wed 2023-10-25 15:15:11 EDT; 13s ago
Docs: https://prometheus.io/docs/introduction/overview/
Process: 1108273 ExecStart=/home/username/prometheus-2.48.0-rc.0.linux-amd64/prometheus --config.file=/home/username/prometheus-2.48.0-rc.0.linux-amd64/prometheus.yml --web.enable-remote->
Main PID: 1108273 (code=exited, status=203/EXEC)

Oct 25 15:15:11 servername systemd[1]: prometheus.service: Scheduled restart job, restart counter is at 5.
Oct 25 15:15:11 servername systemd[1]: Stopped Prometheus Server.
Oct 25 15:15:11 servername systemd[1]: prometheus.service: Start request repeated too quickly.
Oct 25 15:15:11 servername systemd[1]: prometheus.service: Failed with result 'exit-code'.
Oct 25 15:15:11 servername systemd[1]: Failed to start Prometheus Server.


I double-checked the spacing in the YML file to make sure I didn't have that issue. I ran the promtool and got the following results

promtool check config prometheus.yml

Checking prometheus.yml
SUCCESS: prometheus.yml is valid prometheus config file syntax

Anyone have any idea of what the problem might be?

0 Kudos
Elad_Chomsky
Employee
Employee

I don't see the full command, but, as a possible direction try to make sure the syntax for the --web.enable-remote flag is correct.

0 Kudos
CPengine
Participant

@Elad_Chomsky

Below I have pasted the status again along with the Prometheus.Service file and Prometheus.yml file. Do you see any issues with what I have in the files?


● prometheus.service - Prometheus Server
Loaded: loaded (/etc/systemd/system/prometheus.service; disabled; vendor preset: enabled)
Active: failed (Result: exit-code) since Wed 2023-10-25 15:15:11 EDT; 24h ago
Docs: https://prometheus.io/docs/introduction/overview/
Process: 1108273 ExecStart=/home/username/prometheus-2.48.0-rc.0.linux-amd64/prometheus --config.file=/home/username/prometheus-2.48.0-rc.0.linux-amd64/prometheus.yml --web.enable-remote-write-receiver (code=exited, status=203/EXEC)
Main PID: 1108273 (code=exited, status=203/EXEC)

Oct 25 15:15:11 servername systemd[1]: prometheus.service: Scheduled restart job, restart counter is at 5.
Oct 25 15:15:11 servername systemd[1]: Stopped Prometheus Server.
Oct 25 15:15:11 servername systemd[1]: prometheus.service: Start request repeated too quickly.
Oct 25 15:15:11 servername systemd[1]: prometheus.service: Failed with result 'exit-code'.
Oct 25 15:15:11 servername systemd[1]: Failed to start Prometheus Server.


*****Prometheus.Service File*****

[Unit]
Description=Prometheus Server
Documentation=https://prometheus.io/docs/introduction/overview/
After=network-online.target

[Service]
User=root
Restart=on-failure

ExecStart=/home/username/prometheus-2.48.0-rc.0.linux-amd64/prometheus --config.file=/home/username/prometheus-2.48.0-rc.0.linux-amd64/prometheus.yml --web.enable-remote-write-receiver

[Install]
WantedBy=multi-user.target


*****Prometheus.yml file (server IP removed)*****

# my global config
global:
scrape_interval: 15s # Set the scrape interval to every 15 seconds. Default is every 1 minute.
evaluation_interval: 15s # Evaluate rules every 15 seconds. The default is every 1 minute.
# scrape_timeout is set to the global default (10s).

# Alertmanager configuration
alerting:
alertmanagers:
- static_configs:
- targets:
# - alertmanager:9093

# Load rules once and periodically evaluate them according to the global 'evaluation_interval'.
rule_files:
# - "first_rules.yml"
# - "second_rules.yml"

# A scrape configuration containing exactly one endpoint to scrape:
# Here it's Prometheus itself.
scrape_configs:
# The job name is added as a label `job=<job_name>` to any timeseries scraped from this config.
- job_name: "prometheus"

# metrics_path defaults to '/metrics'
# scheme defaults to 'http'.

static_configs:
- targets: ["localhost:9090"]

remote_write:
- url: "http://<server>:9090/api/v1/write"


*****Promtool Output for Prometheus.Service File*****

promtool check config /etc/systemd/system/prometheus.service
Checking /etc/systemd/system/prometheus.service
FAILED: parsing YAML file /etc/systemd/system/prometheus.service: yaml: unmarshal errors:
line 1: cannot unmarshal !!seq into config.plain


0 Kudos
CPengine
Participant

@Elad_Chomsky

I figured it out. So.... I didn't have the actual "username" in the ExecStart section of the Prometheus.Service file. Once I added the username the service came up. Everything else was straight forward from there. Got a working Prometheus and Grafana setup and I am able to see the metrics in the dashboard. 👍

0 Kudos
Upcoming Events

    CheckMates Events