- Products
Network & SASE IoT Protect Maestro Management OpenTelemetry/Skyline Remote Access VPN SASE SD-WAN Security Gateways SmartMove Smart-1 Cloud SMB Gateways (Spark) Threat PreventionCloud Cloud Network Security CloudMates General CloudGuard - WAF Talking Cloud Podcast Weekly ReportsSecurity Operations Events External Risk Management Incident Response Infinity AI Infinity Portal NDR Playblocks SOC XDR/XPR Threat Exposure Management
- Learn
- Local User Groups
- Partners
- More

This website uses Cookies. Click Accept to agree to our website's cookie use as described in our Privacy Policy. Click Preferences to customize your cookie settings.
- Products
- AI Security
- Developers & More
- Check Point Trivia
- CheckMates Toolbox
- General Topics
- Products Announcements
- Threat Prevention Blog
- Upcoming Events
- Americas
- EMEA
- Czech Republic and Slovakia
- Denmark
- Netherlands
- Germany
- Sweden
- United Kingdom and Ireland
- France
- Spain
- Norway
- Ukraine
- Baltics and Finland
- Greece
- Portugal
- Austria
- Kazakhstan and CIS
- Switzerland
- Romania
- Turkey
- Belarus
- Belgium & Luxembourg
- Russia
- Poland
- Georgia
- DACH - Germany, Austria and Switzerland
- Iberia
- Africa
- Adriatics Region
- Eastern Africa
- Israel
- Nordics
- Middle East and Africa
- Balkans
- Italy
- Bulgaria
- Cyprus
- APAC
CheckMates Fest 2026
Join the Celebration!
AI Security Masters
E1: How AI is Reshaping Our World
MVP 2026: Submissions
Are Now Open!
What's New in R82.10?
Watch NowOverlap in Security Validation
Help us to understand your needs better
CheckMates Go:
Maestro Madness
Turn on suggestions
Auto-suggest helps you quickly narrow down your search results by suggesting possible matches as you type.
Showing results for
- CheckMates
- :
- Products
- :
- Network & SASE
- :
- Management
- :
- Re: cpwd_admin list overview (SMS)
Options
- Subscribe to RSS Feed
- Mark Topic as New
- Mark Topic as Read
- Float this Topic for Current User
- Bookmark
- Subscribe
- Mute
- Printer Friendly Page
Turn on suggestions
Auto-suggest helps you quickly narrow down your search results by suggesting possible matches as you type.
Showing results for
Are you a member of CheckMates?
×
Sign in with your Check Point UserCenter/PartnerMap account to access more great content and get a chance to win some Apple AirPods! If you don't have an account, create one now for free!
- Mark as New
- Bookmark
- Subscribe
- Mute
- Subscribe to RSS Feed
- Permalink
- Report Inappropriate Content
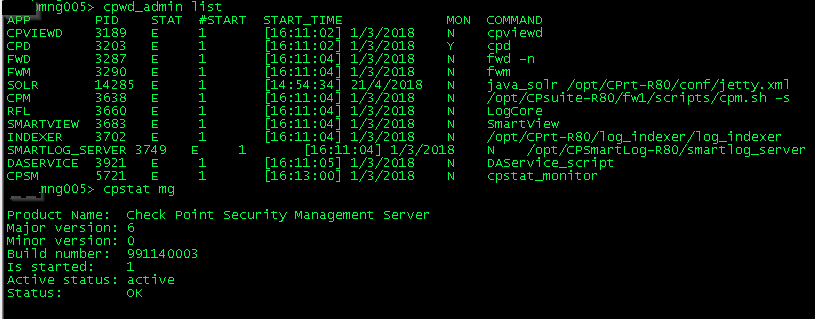
cpwd_admin list overview (SMS)
cpwd_admin list command is mentioned in the thread top 3 CLI commands and is an essential command to know to quickly check that key processes are up and running. I think it's also nice to know what each process are responsible for. RFL, room buddies for life? If you have a standalone installation you can prevent downtime by knowing what to restart and avoid cpstop/cpstart/reboot.
This shows an example from a security managment server. On a security gateway some of these will also be there but others in addition. If you take a closer look you will see a process called LPD which have another start date/time and nowhere to find what this process do. Can someone explain me what is LPD? I can not find documentation for this process.
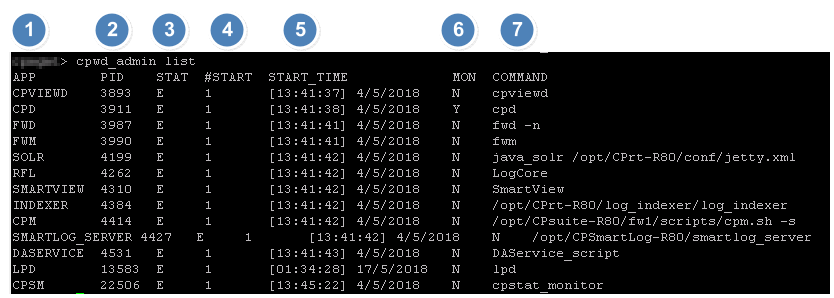
Important to understand each column and its value.
| Column number | Explanation |
|---|---|
| 1 | APP. Application. Name of process. |
| 2 | PID (Process identification number). |
| 3 | STAT (status). E-established. T-terminated. |
| 4 | #START. How many times the process has started since cpwd took control of the process. |
| 5 | START_TIME. The last time the process started. |
| 6 | MON. Monitored actively. YES/NO. |
| 7 | Command. Used by cpwd to start the process. |
STAT column should have every row with the value E-established, meaning that it's running. If the value is T-terminated you should start the process and find out why it crashed/won't start. #START shows how many times the process has started. The values should be 1 and if the value is higher than 1 then something has happened with that process, causing restart and the value to increase. Also the start time should be very close to the other processes and not so far away from the time server booted up. We must mention cpwd (Check Point Watchdog daemon) which is a process that launches and monitors critical processes such as Check Point daemons on the local machine, and attempts to restart them if they fail.
Do you know what each process does? What happens if it's terminated? How to start/stop? How to debug?
Following is an explanation for each process from this example above (except lpd). From Check Point:
cpviewd:
| Description | On Security Gateway and Management Server. CPView Utility daemon (sk101878). |
| Path |
|
| Configuration file | $CPDIR/conf/cpview_conf.xml |
| Notes | "cpwd_admin list" command shows the process as "CPVIEWD". |
| To stop | [Expert@HostName]# cpwd_admin stop -name CPVIEWD |
| To start |
|
| Debug | Refer to sk101878 |
cpd:
| Description |
|
| Path | $CPDIR/bin/cpd %CPDIR%\bin\cpd |
| Logfile | $CPDIR/log/cpd.elg %CPDIR%\log\cpd.elg |
| Notes | "cpwd_admin list" command shows the process as "CPD". |
| To stop |
|
| To start |
|
| Debug | "cpd_admin debug" - refer to sk86320 |
fwd:
| Description |
|
| Path | $FWDIR/bin/fwd %FWDIR%\bin\fwd |
| Logfile | $FWDIR/log/fwd.elg %FWDIR%\log\fwd.elg |
| Notes |
|
| To stop |
|
| To start |
|
| Debug | Refer to sk86321
|
fwm:
| Description | Communication between SmartConsole applications and Security Management Server. |
| Path | $FWDIR/bin/fwm %FWDIR%\bin\fwm |
| Logfile | $FWDIR/log/fwm.elg %FWDIR%\log\fwm.elg |
| Notes | "cpwd_admin list" command shows the process as "FWM". |
| To stop | [Expert@HostName]# cpwd_admin stop -name FWM -path "$FWDIR/bin/fwm" -command "fw kill fwm" In addition, on R8x, you can use the ngm_stop.sh script (refer to sk111772😞
|
| To start | [Expert@HostName]# cpwd_admin start -name FWM -path "$FWDIR/bin/fwm" -command "fwm" In addition, on R8x, you can use the ngm_start.sh script (refer to sk111772😞
|
| Debug |
|
SOLR (java_solr):
| Description | Starting in R80 (SmartEvent NGSE was integrated). Jetty Server. Events are stored in the SOLR database. |
| Path | $RTDIR/bin/java_solr |
| Logfile | $RTDIR/log/solr.log $RTDIR/log/solrRun.log |
| Notes | ""cpwd_admin list" command shows the process as "SOLR". |
| Configuration | $RTDIR/conf/jetty.xml $RTDIR/conf/solr.log4j.properties $RTDIR/conf/solrConnectionConfig.xml $RTDIR/log_indexes/solr.xml |
| To stop | [Expert@HostName]# evstop |
| To start | [Expert@HostName]# evstart |
| Debug | Refer to sk105806. SmartEventSetDebugLevel solr <debug_level> $FWDIR/scripts/solr_debug.py {on | off} |
RFL (LogCore):
| Description | Starting in R80 (SmartEvent NGSE was integrated). Manages the queries it gets from the consumer processes, forwards them to SOLR database and returns the results. Also in charge of resolving and database maintenance (clean up old indexes to have space for the new ones). |
| Path | $RTDIR/bin/LogCore |
| Logfile | $RTDIR/log/RFL.log $RTDIR/log/rflRun.log |
| Notes | "cpwd_admin list" command shows the process as "RFL". |
| Configuration | $RTDIR/conf/rfl.log4j.properties $RTDIR/conf/rfl.log4j.properties.forUpgrade $RTDIR/conf/rflConfig.xml |
| To stop | [Expert@HostName]# evstop |
| To start | [Expert@HostName]# evstart |
| Debug | Refer to sk105806. SmartEventSetDebugLevel rfl <debug_level> |
SmartView:
| Description | SmartEvent Web Application that allows you to connect to SmartEvent NGSE server (at https://<IP_Address_of_SmartEvent_Server>/smartview/) and see the event views and analysis directly from a Web Browser, without installing SmartConsole. The Web page comes with predefined views that you can customize. Refer to sk105684. |
| Path | $RTDIR/bin/SmartView |
| Logfile | $RTDIR/log/smartview.log $RTDIR/log/SmartViewRun.log $RTDIR/log/smartview-service.log |
| Notes | "cpwd_admin list" command shows the process as "SMARTVIEW" |
| Configuration | $RTDIR/conf/smartview.log4j.properties |
| To stop | [Expert@HostName]# evstop |
| To start | [Expert@HostName]# evstart |
| Debug | Refer to sk105806. SmartEventSetDebugLevel smartview <debug_level> |
Indexer (log_indexer):
| Description | Starting in R80 (SmartEvent NGSE was integrated). Log indexer. |
| Path | $RTDIR/log_indexer/log_indexer |
| Logfile | $RTDIR/log_indexer/log/log_indexer.elg $RTDIR/log_indexer/log/log_indexerRun.log |
| Notes | "cpwd_admin list" command shows the process as "INDEXER". |
| Configuration | $RTDIR/log_indexer/conf/log_indexer_settings.conf $RTDIR/log_indexer/log_indexer_custom_settings.conf |
| To stop | [Expert@HostName]# evstop |
| To start | [Expert@HostName]# evstart |
CPM:
| Description | On Security Management Server R80 and above:
|
| Path | $FWDIR/scripts/cpm.sh |
| Logfile | $FWDIR/log/cpm.elg |
| Notes | "cpwd_admin list" command shows the process as "CPM". |
| To stop | [Expert@HostName]# cpstop In addition, on R8x, you can use the ngm_stop.sh script (refer to sk111772😞
|
| To start | [Expert@HostName]# cpstart In addition, on R8x, you can use the ngm_start.sh script (refer to sk111772😞
|
| Debug | Refer to sk115557 |
SMARTLOG_SERVER:
| Description | SmartLog product. |
| Path | $SMARTLOGDIR/smartlog_server |
| Logfile | $SMARTLOGDIR/log/smartlog_server.elg |
| Notes | "cpwd_admin list" command shows the process as "SMARTLOG_SERVER" |
| To stop | [Expert@HostName]# smartlogstop |
| To start | [Expert@HostName]# smartlogstart |
| Debug |
|
DAService:
| Description | Check Point Upgrade Service Engine (CPUSE) - former 'Gaia Software Updates' service (refer to sk92449). |
| Path | $DADIR/bin/DAService |
| Logfile | /opt/CPInstLog/DeploymentAgent.log /opt/CPInstLog/DA_UI.log |
| Notes | "cpwd_admin list" command shows the process as "DASERVICE" (command is "$DADIR/bin/DAService_script" - this is a watchdog script that starts the $DADIR/bin/DAService if it is not running). |
| To stop |
|
| To start |
|
| Debug | Refer to sk92449:
|
CPSM (cpstat_monitor):
| Description | Process is responsible for collecting and sending information to SmartView Monitor. |
| Path | $FWDIR/bin/cpstat_monitor %FWDIR%\bin\cpstat_monitor |
| Logfile | $FWDIR/log/cpstat_monitor.elg %FWDIR%\log\cpstat_monitor.elg |
| Notes |
|
| Configuration | $RTDIR/conf/jetty.xml $RTDIR/conf/solr.log4j.properties $RTDIR/conf/solrConnectionConfig.xml $RTDIR/log_indexes/solr.xml |
| To stop | [Expert@HostName]# cpwd_admin stop -name CPSM |
| To start | [Expert@HostName]# cpwd_admin start -name CPSM -path "$FWDIR/bin/cpstat_monitor" -command "cpstat_monitor" |
| Debug | Refer to sk108177 |
11 Replies
- Mark as New
- Bookmark
- Subscribe
- Mute
- Subscribe to RSS Feed
- Permalink
- Report Inappropriate Content
I can see a hint:
/opt/CPdiag-R80.20/bin/lpd
/opt/CPdiag-R80.20/bin/cpdiag
# cpdiag --h
Log path: /opt/CPsuite-R80.20/fw1/log/cpdiag.elg
CPDiag options:
-f [ --file ] arg XML files to upload
-v [ --version ] Display the CPDiag version number
-h [ --help ] Display this help and exit
-A [ --Add ] Add user defined data. Must be paired with --Key and --Val
-R [ --Remove ] Removes a user defined data key. Must be paired with --Key
-P [ --Print ] Displays the user defined data
-K [ --Key ] arg Identifies a user created data entry
-V [ --Val ] arg The content of a user created data entry
# cpdiag -P
Log path: /opt/CPsuite-R80.20/fw1/log/cpdiag.elg
The entered custom attributes are:
Context: single_context
lpd_signatures_hash=c545fc641f5f1d647b0d66c0501f9728
signatures_hash=e75d4aa314a8e972c2d233689e6c3294
CCSP - CCSE / CCTE / CTPS / CCME / CCSM Elite / SMB Specialist
- Mark as New
- Bookmark
- Subscribe
- Mute
- Subscribe to RSS Feed
- Permalink
- Report Inappropriate Content
Thank you for leading me to CPdiag but I still don't understand what lpd does.
- Mark as New
- Bookmark
- Subscribe
- Mute
- Subscribe to RSS Feed
- Permalink
- Report Inappropriate Content
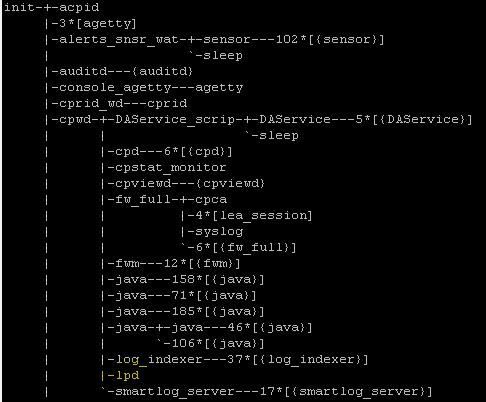
pstree shows this:
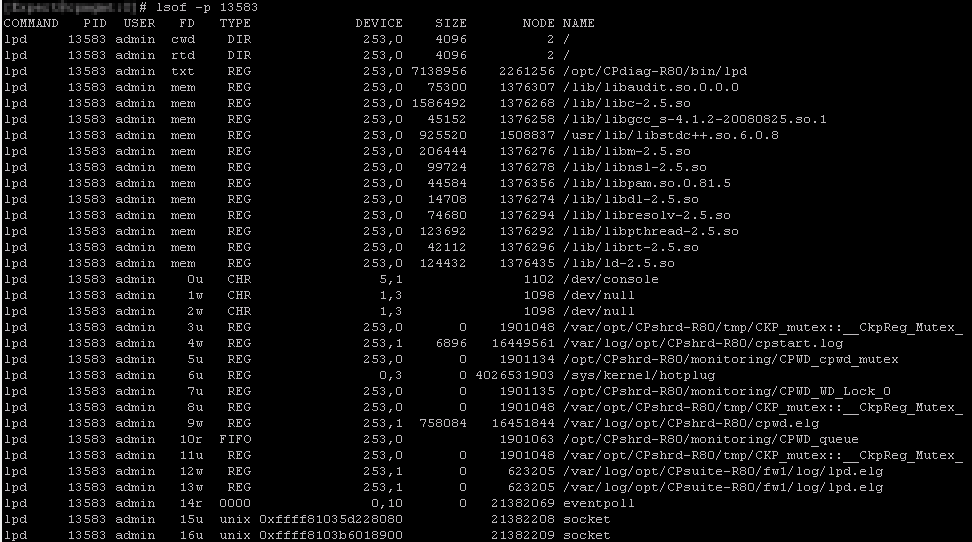
And also:
- Mark as New
- Bookmark
- Subscribe
- Mute
- Subscribe to RSS Feed
- Permalink
- Report Inappropriate Content
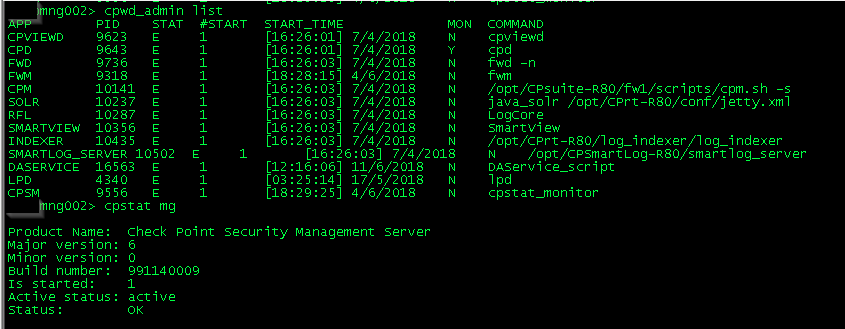
Thanks for sharing, nice post. When I check form the management servers (R80.10), I realised that one of them has an LPD but the other one does not ? I could not find any information about this daemon.
- Mark as New
- Bookmark
- Subscribe
- Mute
- Subscribe to RSS Feed
- Permalink
- Report Inappropriate Content
It's weird that there is no documentation about lpd.
- Mark as New
- Bookmark
- Subscribe
- Mute
- Subscribe to RSS Feed
- Permalink
- Report Inappropriate Content
Hi,
The LPD (or Log Parser Daemon) will scan preconfigured files and search for predefined signatures.
CPDiag will use those results later on.
TBH I don't know too much about this daemon and how it works, but Günther had the right idea when he pointed you to CPDiag.
HTH
Yonatan
- Mark as New
- Bookmark
- Subscribe
- Mute
- Subscribe to RSS Feed
- Permalink
- Report Inappropriate Content
Hi Enis,
Thanks for a great article.
I have a question, for you or anyone out there who might know.
It is about the MON column in the cpwd_admin list command.
If I put it to the test by killing the fwd on the management server (kill <pid of fwd>) and waiting and watching then I see that it automatically gets started up again and the new PID is shown and the start count goes up by 1 (within the allowed 60 seconds).
The strange part is that fwd is marked as N for MON.
This goes against my understanding of the monitoring and that N meant that something that was Not monitored would not be restarted.
Is there an explanation for this or something that I am missing?
Don
- Mark as New
- Bookmark
- Subscribe
- Mute
- Subscribe to RSS Feed
- Permalink
- Report Inappropriate Content
Hi Donald,
Take a look at this thread at the end and you will get an answer to your question.
https://community.checkpoint.com/thread/5201-add-a-process-to-be-monitored-by-cpwatchdog
- Mark as New
- Bookmark
- Subscribe
- Mute
- Subscribe to RSS Feed
- Permalink
- Report Inappropriate Content
Hi Enis,
I read the thread and I can't seem to find the answer to why specifically the fwd (MON = N) is still restarted after being killer (simulating a crash).
Can you paste in the part I missed if I missed it or am not understanding?
Thanks,
Don
- Mark as New
- Bookmark
- Subscribe
- Mute
- Subscribe to RSS Feed
- Permalink
- Report Inappropriate Content
I think he meant:
Just to clarify, cpwd has two different mechanisms for monitoring processes.
Only specific processes can leverage the "active" mechanism (i.e. the MON column).
Arbitrary processes like the one you're trying to monitor for won't leverage it, but cpwd should still notice if the process is killed and restart it.
So some processes have Mon=N but are still restarted if they crash... You may find them in cpwd.elg.
CCSP - CCSE / CCTE / CTPS / CCME / CCSM Elite / SMB Specialist
- Mark as New
- Bookmark
- Subscribe
- Mute
- Subscribe to RSS Feed
- Permalink
- Report Inappropriate Content
Just want to drop some extra info in here on RFL.
SmartEvent R80 Architecture to go with this description:
- Manages the queries it get from the consumer processes, forward them to Solr and return the results. Also in charge of resolving and database maintenance (clean up old indexes to have space for the new ones).

From:
https://www.checkpoint.com/downloads/products/r80.10-security-management-architecture-overview.pdf
We get this diagram:

and this other info on debugging:
DEBUGGING Debug with Database Modifications. Use mgmt_cli.
In Pre-R80.10 systems, debugging was done using dbedit, which can still be used for the objects still managed from FWM (such as gateways, VSX objects and QoS policy).
Also in earlier systems, you could manual edit config files in $FWDIR/conf.
In R80.10, manual editing of files does not work. The configuration is stored in the PostgreSQL database, and not in the $FWDIR/conf files. R80.10 now uses these files to create a representation of the installed revision, on Install Policy.
R80.10 Logging Processes are from one CLI command set, rather than various tools of before.
SmartEventSetDebugLevel <component> <debug level>
Example:
RFL:
Start: SmartEventSetDebugLevel rfl debug
Stop: SmartEventSetDebugLevel rfl info
and finally this:

Leaderboard
Epsum factorial non deposit quid pro quo hic escorol.
| User | Count |
|---|---|
| 17 | |
| 15 | |
| 8 | |
| 5 | |
| 5 | |
| 5 | |
| 4 | |
| 4 | |
| 4 | |
| 4 |
Upcoming Events
Thu 08 Jan 2026 @ 05:00 PM (CET)
AI Security Masters Session 1: How AI is Reshaping Our WorldThu 22 Jan 2026 @ 05:00 PM (CET)
AI Security Masters Session 2: Hacking with AI: The Dark Side of InnovationThu 12 Feb 2026 @ 05:00 PM (CET)
AI Security Masters Session 3: Exposing AI Vulnerabilities: CP<R> Latest Security FindingsThu 26 Feb 2026 @ 05:00 PM (CET)
AI Security Masters Session 4: Powering Prevention: The AI Driving Check Point’s ThreatCloudThu 08 Jan 2026 @ 05:00 PM (CET)
AI Security Masters Session 1: How AI is Reshaping Our WorldThu 22 Jan 2026 @ 05:00 PM (CET)
AI Security Masters Session 2: Hacking with AI: The Dark Side of InnovationThu 26 Feb 2026 @ 05:00 PM (CET)
AI Security Masters Session 4: Powering Prevention: The AI Driving Check Point’s ThreatCloudAbout CheckMates
Learn Check Point
Advanced Learning
YOU DESERVE THE BEST SECURITY
©1994-2025 Check Point Software Technologies Ltd. All rights reserved.
Copyright
Privacy Policy
About Us
UserCenter