- Products
- Learn
- Local User Groups
- Partners
- More
This website uses Cookies. Click Accept to agree to our website's cookie use as described in our Privacy Policy. Click Preferences to customize your cookie settings.
- Products
- AI Security
- Developers & More
- Check Point Trivia
- CheckMates Toolbox
- General Topics
- Products Announcements
- Threat Prevention Blog
- Upcoming Events
- Americas
- EMEA
- Czech Republic and Slovakia
- Denmark
- Netherlands
- Germany
- Sweden
- United Kingdom and Ireland
- France
- Spain
- Norway
- Ukraine
- Baltics and Finland
- Greece
- Portugal
- Austria
- Kazakhstan and CIS
- Switzerland
- Romania
- Turkey
- Belarus
- Belgium & Luxembourg
- Russia
- Poland
- Georgia
- DACH - Germany, Austria and Switzerland
- Iberia
- Africa
- Adriatics Region
- Eastern Africa
- Israel
- Nordics
- Middle East and Africa
- Balkans
- Italy
- Bulgaria
- Cyprus
- APAC
What's New in R82.10?
10 December @ 5pm CET / 11am ET
Improve Your Security Posture with
Threat Prevention and Policy Insights
Overlap in Security Validation
Help us to understand your needs better
CheckMates Go:
Maestro Madness
Turn on suggestions
Auto-suggest helps you quickly narrow down your search results by suggesting possible matches as you type.
Showing results for
- CheckMates
- :
- Products
- :
- Network & SASE
- :
- Management
- :
- Re: Top Bandwidth Applications graphed over time?
Options
- Subscribe to RSS Feed
- Mark Topic as New
- Mark Topic as Read
- Float this Topic for Current User
- Bookmark
- Subscribe
- Mute
- Printer Friendly Page
Turn on suggestions
Auto-suggest helps you quickly narrow down your search results by suggesting possible matches as you type.
Showing results for
Are you a member of CheckMates?
×
Sign in with your Check Point UserCenter/PartnerMap account to access more great content and get a chance to win some Apple AirPods! If you don't have an account, create one now for free!
- Mark as New
- Bookmark
- Subscribe
- Mute
- Subscribe to RSS Feed
- Permalink
- Report Inappropriate Content
Top Bandwidth Applications graphed over time?
I'm trying to find a good report/view/chart to graph top bandwidth utilization applications over time. I can find this view but it's only cumulative for the specified time period, not graphed over time. So rather than just a list of the top applications and their total usage over, for example, 30 days, I need to see a graph of the traffic. For example we have an application that uses a ton of bandwidth, but it should ONLY be doing so after hours. The High Bandwidth Applications view doesn't reveal the bandwidth usage patterns...
12 Replies
- Mark as New
- Bookmark
- Subscribe
- Mute
- Subscribe to RSS Feed
- Permalink
- Report Inappropriate Content
You wanting to see that, at hour X that application Y is using Z bytes of data, is that correct?
https://community.checkpoint.com/people/dados1c5b14ae-3a0e-30b3-8774-7305f45a41dc?
- Mark as New
- Bookmark
- Subscribe
- Mute
- Subscribe to RSS Feed
- Permalink
- Report Inappropriate Content
That's exactly what I'm looking for, a historical graph of data usage per application over a a designated time period, rather than just the total usage by that application over a designated time period.
- Mark as New
- Bookmark
- Subscribe
- Mute
- Subscribe to RSS Feed
- Permalink
- Report Inappropriate Content

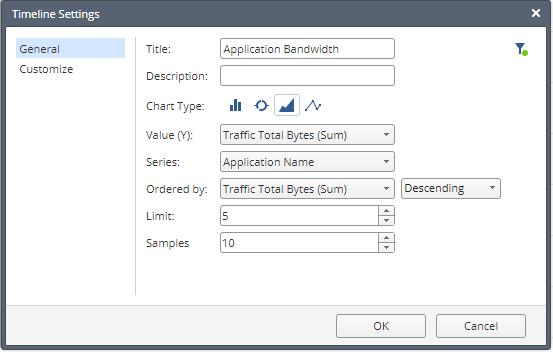
Something like this?
Create a time line widget and use the below settings:
To get more applications, increase the limit parameter.

- Mark as New
- Bookmark
- Subscribe
- Mute
- Subscribe to RSS Feed
- Permalink
- Report Inappropriate Content
Do you use SmartEvent for this? Is this also possible with R77.30?
- Mark as New
- Bookmark
- Subscribe
- Mute
- Subscribe to RSS Feed
- Permalink
- Report Inappropriate Content
This is SmartEvent R80.10.
- Mark as New
- Bookmark
- Subscribe
- Mute
- Subscribe to RSS Feed
- Permalink
- Report Inappropriate Content
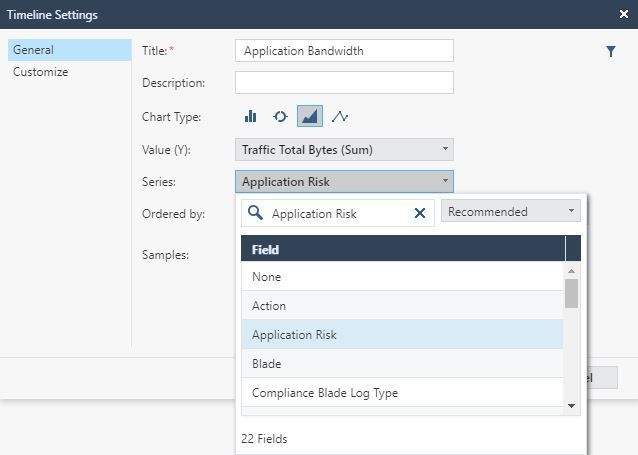
I don't appear to have 'Application Name' available as the Series:
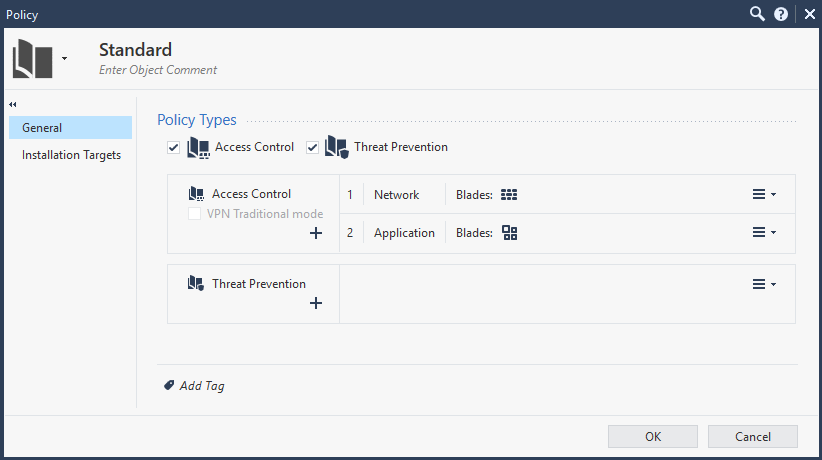
We have two access policies where all rules are set to 'Log' in the 'Network' policy and all rules are set to 'Extended Logging' in the 'Application' policy:
Logs record Application Names:
This is on a MDS R80.30, recently upgraded from R80.10 and a newly deployed R80.30 non-MDS installation.
- Mark as New
- Bookmark
- Subscribe
- Mute
- Subscribe to RSS Feed
- Permalink
- Report Inappropriate Content
I'm trying to do this just to have a view of the internet data per day. The results are not correct. Does this require accounting to be active on the logging of the rules?
The clients would like a report of bandwith usage per day per gateway.
- Mark as New
- Bookmark
- Subscribe
- Mute
- Subscribe to RSS Feed
- Permalink
- Report Inappropriate Content
Yeah,the results are not correct. even though you select accounting in policy.securexl traffic can not be count,so the results are not correct.
- Mark as New
- Bookmark
- Subscribe
- Mute
- Subscribe to RSS Feed
- Permalink
- Report Inappropriate Content
Even with the recent change in secureXL?
- Mark as New
- Bookmark
- Subscribe
- Mute
- Subscribe to RSS Feed
- Permalink
- Report Inappropriate Content
I think unless you close securexl
- Mark as New
- Bookmark
- Subscribe
- Mute
- Subscribe to RSS Feed
- Permalink
- Report Inappropriate Content
Hi guys,
This is useful info as we have a client that wants to find out about their bandwidth usage before/during this whole COVID crisis.
I was able to create the widget but the query seems to fail, and say it has no data (see screenshot). Am I doing something wrong with how I am logging or missing something? I am trying to create this custom report to be relevant in network Bandwidth usage, not just application bandwidth usage.
Wanted to see if other people are having this same issue.
Let me know. Thanks
-C
- Mark as New
- Bookmark
- Subscribe
- Mute
- Subscribe to RSS Feed
- Permalink
- Report Inappropriate Content
Change the "Ordered by" field from "Total Bytes (Sum)" to "Traffic Total Bytes (Sum)".
Kind regards, Amir Senn
Leaderboard
Epsum factorial non deposit quid pro quo hic escorol.
| User | Count |
|---|---|
| 15 | |
| 10 | |
| 8 | |
| 5 | |
| 5 | |
| 5 | |
| 4 | |
| 4 | |
| 4 | |
| 3 |
Upcoming Events
Wed 03 Dec 2025 @ 10:00 AM (COT)
Última Sesión del Año – CheckMates LATAM: ERM & TEM con ExpertosThu 04 Dec 2025 @ 12:30 PM (SGT)
End-of-Year Event: Securing AI Transformation in a Hyperconnected World - APACThu 04 Dec 2025 @ 03:00 PM (CET)
End-of-Year Event: Securing AI Transformation in a Hyperconnected World - EMEAThu 04 Dec 2025 @ 02:00 PM (EST)
End-of-Year Event: Securing AI Transformation in a Hyperconnected World - AmericasWed 03 Dec 2025 @ 10:00 AM (COT)
Última Sesión del Año – CheckMates LATAM: ERM & TEM con ExpertosThu 04 Dec 2025 @ 12:30 PM (SGT)
End-of-Year Event: Securing AI Transformation in a Hyperconnected World - APACThu 04 Dec 2025 @ 03:00 PM (CET)
End-of-Year Event: Securing AI Transformation in a Hyperconnected World - EMEAThu 04 Dec 2025 @ 02:00 PM (EST)
End-of-Year Event: Securing AI Transformation in a Hyperconnected World - AmericasAbout CheckMates
Learn Check Point
Advanced Learning
YOU DESERVE THE BEST SECURITY
©1994-2025 Check Point Software Technologies Ltd. All rights reserved.
Copyright
Privacy Policy
About Us
UserCenter


