Create a Post
cancel
Showing results for 
Search instead for 
Did you mean: 
Garrett_DirSec
Advisor
Jump to solution

R80.xx equivalent of CPLogInvestigator for Log Volume and SmartEvent sizing

Hello Community --

The R77x Sizing guide includes mention of CPLogInvestigator that would analyze Log Server and provide tangible metric to help intelligently size a SmartEvent appliance model.

What are our options for R80.xx ?    

How are customers (and resellers) to investigate log server volume -- and associated log levels -- to properly size SmartEvent solutions?   

Example:   customer only has "network log" enabled due to hardware limitations under current Log Server.  They would like to enable "full log" with accounting (for some use-cases).

We need to first collect data for current log volume and then extrapolate to different log density.

Product mgmt must have a strategy formulated on this.  

advise.   -Garrett

reference:

  • Network Log - Generates a log with only basic Firewall information: Source, Destination, Source Port, Destination Port, and Protocol.
  • Log - Equivalent to the Network Log option, but also includes the application name (for example, Dropbox), and application information (for example, the URL of the Website). This is the default Tracking option.
  • Full Log - Equivalent to the log option, but also records data for each URL request made.
    • If suppression is not selected, it generates a complete log (as defined in pre-R80 management).
    • If suppression is selected, it generates an extended log (as defined in pre-R80 management).
  • None - Do not generate a log.

You can add these options to a Log, Full Log, or Network Log:

  • Accounting - If selected, update the log every 10 minutes, to show how much data has passed in the connection: Upload bytes, Download bytes, and browse time.
  • Suppression - If selected, one log is generated every three hours for all the connections.


SmartEvent Sizing Guide - R77.x

http://supportcontent.checkpoint.com/solutions?id=sk87263

Smart-1 R80.x Logging Capacity Performance Improvements

http://supportcontent.checkpoint.com/solutions?id=sk112797

0 Kudos
1 Solution

Accepted Solutions
Matt_Ricketts
Employee
Employee

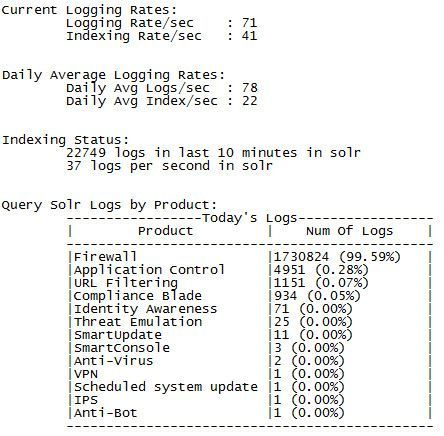
The doctor-log.sh script located at $RTDIR/scripts may be of assistance to you. It will analyze the logs and give you a brief output of your Current Logging and Daily Average Logging rates. It will also produce a detailed output at /tmp/sme-diag/results/detailed_diag_report.txt. Within the detailed output is the same logging rates as well as the Indexing Status and the logs based on the blade. There is a lot more data in the detailed log than what I show below. The Log Indexes total size is also within the report. Not shown here, but in my small environment I have about 11 GB of logs across 34 days. My daily average log file size is about 324 MB. From here I could do some math to determine what my log partition needs to be sized at based on what my retention time is.

Hopefully this helps you.

2019-03-13_125037.jpg

View solution in original post

4 Replies
Matt_Ricketts
Employee
Employee

The doctor-log.sh script located at $RTDIR/scripts may be of assistance to you. It will analyze the logs and give you a brief output of your Current Logging and Daily Average Logging rates. It will also produce a detailed output at /tmp/sme-diag/results/detailed_diag_report.txt. Within the detailed output is the same logging rates as well as the Indexing Status and the logs based on the blade. There is a lot more data in the detailed log than what I show below. The Log Indexes total size is also within the report. Not shown here, but in my small environment I have about 11 GB of logs across 34 days. My daily average log file size is about 324 MB. From here I could do some math to determine what my log partition needs to be sized at based on what my retention time is.

Hopefully this helps you.

2019-03-13_125037.jpg

Garrett_DirSec
Advisor
@Matt_Rickets --
I almost fell of my chair. this is very good immediate avenue to discuss with customer.
sincere thanks. -GA
0 Kudos
Saul_Goodman
Participant
Participant

Hi Matt,

how About sizing disk space for log retentions for customers that is not yet Check Point User.

0 Kudos
Garrett_DirSec
Advisor

Hello @Saul_Goodman .    This is excellent question but can depend on numerous factors. 

The best way to know for sure would be to do equivalent of what CP used to call a Security Checkup.   It won't be exact but will provide (a) a good argument "why checkpoint?" because of document that is produced, and (b) will provide some real logging that can be used (or extrapolated) for a "in the ballpark estimate".   Issues may exist about lack of visibility of specific subnets and/or interfaces on current firewall, etc so mileage may vary on this approach.

DRLog could be used on checkup appliance.

The alternative would be to leverage existing log volume, understand how they tracking URLF, and whether they tracking per session or connection.    You might have to do something blind like "double" the #

In addition, the frequently and size of checkpoint log volume will depend on what traffic you log and how much you log for each event. 

Example:  if customer will use Checkpoint for URLF and customer wants to see the URL requested, this is Extended Logging. 

Specific reference HERE. 


0 Kudos

Leaderboard

Epsum factorial non deposit quid pro quo hic escorol.

Upcoming Events

    Tue 18 Mar 2025 @ 09:30 AM (EET)

    CheckMates Live Greece
    CheckMates Events