- Products
- Learn
- Local User Groups
- Partners
- More

This website uses Cookies. Click Accept to agree to our website's cookie use as described in our Privacy Policy. Click Preferences to customize your cookie settings.
- Products
- Learn
- Local User Groups
- Upcoming Events
- Americas
- EMEA
- Czech Republic and Slovakia
- Denmark
- Netherlands
- Germany
- Sweden
- United Kingdom and Ireland
- France
- Spain
- Norway
- Ukraine
- Baltics and Finland
- Greece
- Portugal
- Austria
- Kazakhstan and CIS
- Switzerland
- Romania
- Turkey
- Belarus
- Belgium & Luxembourg
- Russia
- Poland
- Georgia
- DACH - Germany, Austria and Switzerland
- Iberia
- Africa
- Adriatics Region
- Eastern Africa
- Israel
- Nordics
- Middle East and Africa
- Balkans
- Italy
- Bulgaria
- Cyprus
- APAC
- Partners
- More
- ABOUT CHECKMATES & FAQ
- Sign In
- Leaderboard
- Events
Call For Papers
Your Expertise, Our Stage
Ink Dragon: A Major Nation-State Campaign
March 11th @ 5pm CET / 12pm EDT
AI Security Masters E5:
Powering Prevention: The AI Driving Check Point’s ThreatCloud
The Great Exposure Reset
AI Security Masters E4:
Introducing Cyata, Securing the Agentic AI Era
CheckMates Go:
CheckMates Fest
Turn on suggestions
Auto-suggest helps you quickly narrow down your search results by suggesting possible matches as you type.
Showing results for
- CheckMates
- :
- Products
- :
- Hybrid Mesh
- :
- Firewall and Security Management
- :
- Re: Management server slowness in R80.10
Options
- Subscribe to RSS Feed
- Mark Topic as New
- Mark Topic as Read
- Float this Topic for Current User
- Bookmark
- Subscribe
- Mute
- Printer Friendly Page
Turn on suggestions
Auto-suggest helps you quickly narrow down your search results by suggesting possible matches as you type.
Showing results for
Are you a member of CheckMates?
×
Sign in with your Check Point UserCenter/PartnerMap account to access more great content and get a chance to win some Apple AirPods! If you don't have an account, create one now for free!
- Mark as New
- Bookmark
- Subscribe
- Mute
- Subscribe to RSS Feed
- Permalink
- Report Inappropriate Content
Management server slowness in R80.10
I migrated an FWSM firewall to Checkpoint. The management server is on R80.10 and the gateways are running on R77.30. The FWSM had a large number of rules and objects. Post migration, we have 7000 rules and 5000 objects in the dashboard.
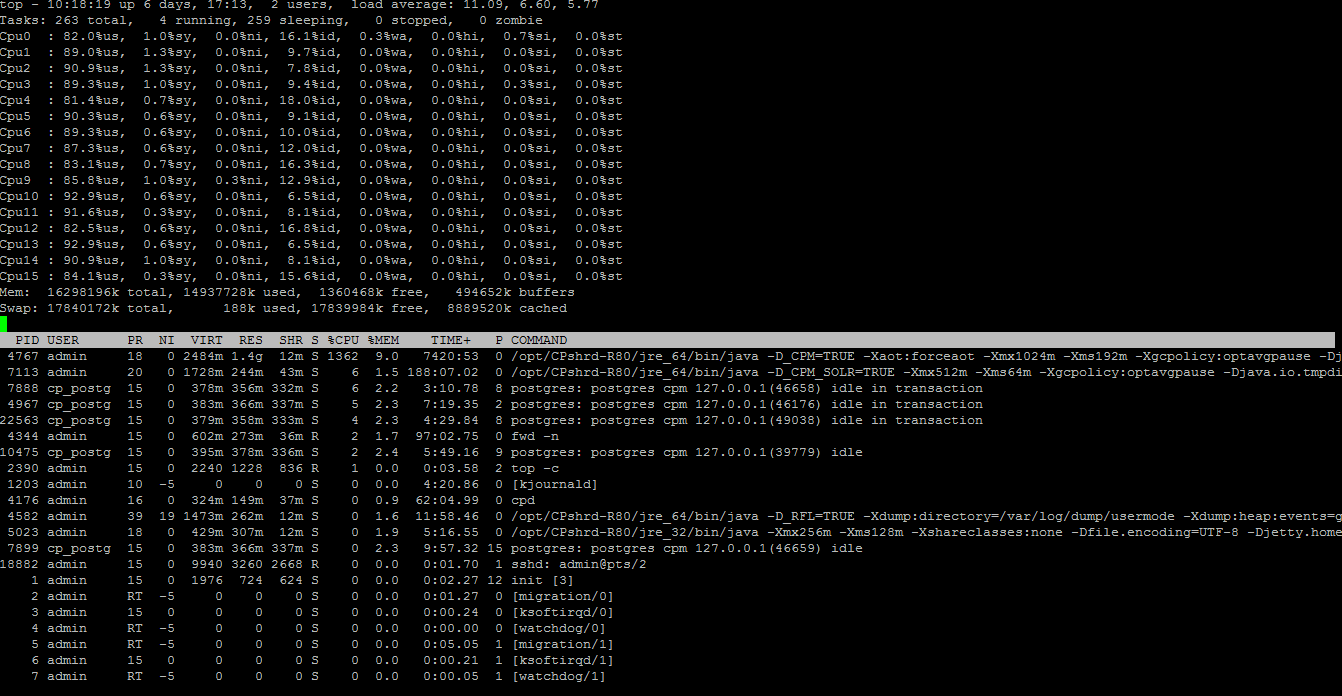
I keep running to a problem where java process hogs up all the available CPU and I'm unable to do anything at this point. The dashboard stops responding and closes. When trying to reconnect, I keep getting an Operation Timeout error. After some time (around 15 minutes), java process consumption eventually goes down and only after that I'm able to re login.
We are in the process of cleaning up the rulebase but can't do that either because of this issue. Troubleshooting becomes a nightmare. The management server runs on a VM with 16GB RAM and 16 CPU cores. The java process consumption goes up as high as 1500%. Tried to get assistance from TAC but they took the easy way out by saying it's a problem with the number of rules and objects. But surely, 16GB RAM and 16 CPU cores should be able to handle this.
Any assistance to sort this out would be much appreciated. The JHF take installed is 35.
43 Replies
- Mark as New
- Bookmark
- Subscribe
- Mute
- Subscribe to RSS Feed
- Permalink
- Report Inappropriate Content
When the CPU spikes, is it spiking in "wa" (waiting for I/O) space as shown by the top command? If so your disk path is way too slow. You have allocated plenty of memory and cores, but for a configuration of that size disk I/O bandwidth is still extremely important. I have seen performance issues like this time and time again with SMS systems configured in VMWare with generous amounts of RAM and CPU, but after some investigation it turns out they are sharing a disk path with umpteen database VMs and/or numerous other VMs that are constantly beating on the disk I/O path.
Also was your SMS disk provisioned thick (desirable) or thin?
--
My book "Max Power: Check Point Firewall Performance Optimization"
now available via http://maxpowerfirewalls.com.
New Book: "Max Power 2026" Coming Soon
Check Point Firewall Performance Optimization
Check Point Firewall Performance Optimization
- Mark as New
- Bookmark
- Subscribe
- Mute
- Subscribe to RSS Feed
- Permalink
- Report Inappropriate Content
In our lab testing 16GB ram came out as a bottleneck. We ended up with 64GB. Check RAM usage and especially swap state. In a lot of swap is in use you will have to increase memory. Remember that log indexing is much more process hungry too with R80.10. in case you log on the same server. R80 generally is much more resource demanding for sure.
- Mark as New
- Bookmark
- Subscribe
- Mute
- Subscribe to RSS Feed
- Permalink
- Report Inappropriate Content
Exactly, lack of RAM can certainly cause heavy "wa" CPU load as well due to paging/swapping.
--
My book "Max Power: Check Point Firewall Performance Optimization"
now available via http://maxpowerfirewalls.com.
New Book: "Max Power 2026" Coming Soon
Check Point Firewall Performance Optimization
Check Point Firewall Performance Optimization
- Mark as New
- Bookmark
- Subscribe
- Mute
- Subscribe to RSS Feed
- Permalink
- Report Inappropriate Content
R80 management definitely needs more RAM than previous releases.
This is especially true in large environments (either large number of objects, large number of CMAs, or both).
I use 16GB and 4 Cores for my manager in my home lab, which provides more than adequate performance for my small environment.
if it was a bigger environment, I would certainly allocate more of both.
- Mark as New
- Bookmark
- Subscribe
- Mute
- Subscribe to RSS Feed
- Permalink
- Report Inappropriate Content
It's not the RAM. I'm not using any swap memory and the CPU is used on %us rather than %wa. We can safely assume hardware limitations here and focus on the software side.
- Mark as New
- Bookmark
- Subscribe
- Mute
- Subscribe to RSS Feed
- Permalink
- Report Inappropriate Content
do you mind sharing top output?
- Mark as New
- Bookmark
- Subscribe
- Mute
- Subscribe to RSS Feed
- Permalink
- Report Inappropriate Content
and the ps aux | grep <nbr of the java process with high cpu>
- Mark as New
- Bookmark
- Subscribe
- Mute
- Subscribe to RSS Feed
- Permalink
- Report Inappropriate Content
- Mark as New
- Bookmark
- Subscribe
- Mute
- Subscribe to RSS Feed
- Permalink
- Report Inappropriate Content
Looking at the busy one
admin 4767 77.0 8.9 2547428 1461220 ? Ssl Sep27 7456:29 /opt/CPshrd-R80/jre_64/bin/java -D_CPM=TRUE -Xaot:forceaot -Xmx1024m -Xms192m -
you will notice that it has set max memory to 1GB and is actually using all of it.
I can see that on our systems (that is MDS) we have 4GB allocated for the same process. Not too sure what allocates initial max size (xmx) - could be preset environment variable or it could be calculated based on your RAM size. Something CP dudes will have to answer.
I personally would allocate as mach RAM as you can for R80 - it will utilise all of it ![]() On our MDS and MLM out of 64GB nearly 40GB are used for caching that certainly helps making it faster even though we "really" use only 25GB
On our MDS and MLM out of 64GB nearly 40GB are used for caching that certainly helps making it faster even though we "really" use only 25GB
- Mark as New
- Bookmark
- Subscribe
- Mute
- Subscribe to RSS Feed
- Permalink
- Report Inappropriate Content
Looks like a lot is set here
$CPDIR/conf/CpSetupInfo_resourceProfiles.conf
Also worth checking SK110753 has an interesting statement "16GB of RAM machine launches with a maximum Java Heap Size equals to 1024 MB which is unsufficient."
- Mark as New
- Bookmark
- Subscribe
- Mute
- Subscribe to RSS Feed
- Permalink
- Report Inappropriate Content
This is what I see in the rule as per the SK you have suggested.
:rule ("UPGRADE: Large env resources profile without SME"
:filter (
:memory_min (8192)
:memory_max (24800)
:upgrade_setup (TRUE)
:smart_event (FALSE)
:dedicated_log_server (FALSE)
)
:result (
:memory (
:initial_value (
:name (NGM_CPM_MIN_HEAP)
:memory_allocation (192m)
)
:max_value (
:name (NGM_CPM_MAX_HEAP)
:memory_allocation (2048m)
)
)
It seems the limit is set to 2GB. Either I'm looking at the incorrect rule or the solution is only related to MDM environments.
- Mark as New
- Bookmark
- Subscribe
- Mute
- Subscribe to RSS Feed
- Permalink
- Report Inappropriate Content
[Expert@PDC-CP-MGT:0]# ps aux | grep java
admin 4528 0.0 0.0 1736 508 pts/3 R+ 10:22 0:00 grep java
admin 4540 0.0 0.7 1158912 121896 ? SNsl Sep27 6:15 /opt/CPshrd-R80/jre_64/bin/java -D_solr=TRUE -Xdump:directory=/var/log/dump/usermode -Xdump:heap:events=gpf+user -Xdump:tool:none -Xdump:tool:events=gpf+abort+traceassert+corruptcache,priority=1,range=1..0,exec=javaCompress.sh solr %pid -Xdump:tool:events=systhrow,filter=java/lang/OutOfMemoryError,priority=1,range=1..0,exec=javaCompress.sh solr %pid -Xdump:tool:events=throw,filter=java/lang/OutOfMemoryError,exec=kill -9 %pid -Xaggressive -Xshareclasses:none -Xgc:scvTenureAge=1,noAdaptiveTenure -Xmx128m -Xms128m -Dlog4j.configuration=file:/opt/CPrt-R80/conf/solr.log4j.properties -Dpath=/opt/CPrt-R80/jars/aspectjrt-1.7.0.jar:/opt/CPrt-R80/jars/commons-io-2.3.jar:/opt/CPrt-R80/jars/commons-lang-2.6.jar:/opt/CPrt-R80/jars/cxf-core-3.1.0.jar:/opt/CPrt-R80/jars/cxf-java2ws-plugin-3.1.0.jar:/opt/CPrt-R80/jars/cxf-rt-bindings-soap-3.1.0.jar:/opt/CPrt-R80/jars/cxf-rt-bindings-xml-3.1.0.jar:/opt/CPrt-R80/jars/cxf-rt-databinding-aegis-3.1.0.jar:/opt/CPrt-R80/jars/cxf-rt-databinding-jaxb-3.1.0.jar:/opt/CPrt-R80/jars/cxf-rt-frontend-jaxws-3.1.0.jar:/opt/CPrt-R80/jars/cxf-rt-frontend-simple-3.1.0.jar:/opt/CPrt-R80/jars/cxf-rt-javascript-3.1.0.jar:/opt/CPrt-R80/jars/cxf-rt-transports-http-3.1.0.jar:/opt/CPrt-R80/jars/cxf-rt-transports-http-jetty-3.1.0.jar:/opt/CPrt-R80/jars/cxf-rt-ws-addr-3.1.0.jar:/opt/CPrt-R80/jars/cxf-rt-ws-policy-3.1.0.jar:/opt/CPrt-R80/jars/cxf-rt-wsdl-3.1.0.jar:/opt/CPrt-R80/jars/cxf-tools-common-3.1.0.jar:/opt/CPrt-R80/jars/cxf-tools-java2ws-3.1.0.jar:/opt/CPrt-R80/jars/cxf-tools-validator-3.1.0.jar:/opt/CPrt-R80/jars/cxf-tools-wsdlto-core-3.1.0.jar:/opt/CPrt-R80/jars/cxf-tools-wsdlto-databinding-jaxb-3.1.0.jar:/opt/CPrt-R80/jars/cxf-tools-wsdlto-frontend-jaxws-3.1.0.jar:/opt/CPrt-R80/jars/java_is.jar:/opt/CPrt-R80/jars/java_sic.jar:/opt/CPrt-R80/jars/jaxb-xjc-2.2.11.jar:/opt/CPrt-R80/jars/jetty_assist.jar:/opt/CPrt-R80/jars/stax2-api-3.1.4.jar:/opt/CPrt-R80/jars/woodstox-core-asl-4.4.1.jar:/opt/CPrt-R80/jars/wsdl4j-1.6.3.jar:/opt/CPrt-R80/jars/xmlschema-core-2.2.1.jar:/opt/CPsuite-R80/fw1/cpm-server/jackson-annotations-2.5.0.jar:/opt/CPsuite-R80/fw1/cpm-server/jackson-core-2.5.0.jar:/opt/CPsuite-R80/fw1/cpm-server/jackson-databind-2.5.0.jar: -Dsolr.log=/opt/CPrt-R80/log/solr.log -jar start.jar /opt/CPrt-R80/conf/jetty.xml
admin 4582 0.1 1.6 1508404 268484 ? SNsl Sep27 11:58 /opt/CPshrd-R80/jre_64/bin/java -D_RFL=TRUE -Xdump:directory=/var/log/dump/usermode -Xdump:heap:events=gpf+user -Xdump:tool:none -Xdump:tool:events=gpf+abort+traceassert+corruptcache,priority=1,range=1..0,exec=javaCompress.sh RFL %pid -Xdump:tool:events=systhrow,filter=java/lang/OutOfMemoryError,priority=1,range=1..0,exec=javaCompress.sh RFL %pid -Xdump:tool:events=throw,filter=java/lang/OutOfMemoryError,exec=kill -9 %pid -Xaggressive -Xshareclasses:none -Xgc:scvTenureAge=1,noAdaptiveTenure -Xmx512m -Xms96m -Dupgrade.cores.count= -Dfile.encoding=UTF-8 -DreportingServer.conf.dir=/opt/CPrt-R80/conf -Dlog4j.configuration=file:/opt/CPrt-R80/conf/rfl.log4j.properties -DReportingServer.log=/opt/CPrt-R80/log -cp /opt/CPrt-R80/jars/* com.checkpoint.core.LogCore -type jms
admin 4635 0.7 4.2 1476108 689780 ? Ssl Sep27 71:10 /opt/CPshrd-R80/jre_64/bin/java -D_smartview=TRUE -Xdump:directory=/var/log/dump/usermode -Xdump:heap:events=gpf+user -Xdump:tool:none -Xdump:tool:events=gpf+abort+traceassert+corruptcache,priority=1,range=1..0,exec=javaCompress.sh smartview %pid -Xdump:tool:events=systhrow,filter=java/lang/OutOfMemoryError,priority=1,range=1..0,exec=javaCompress.sh smartview %pid -Xdump:tool:events=throw,filter=java/lang/OutOfMemoryError,exec=kill -9 %pid -Xaggressive -Xshareclasses:none -Xgc:scvTenureAge=1,noAdaptiveTenure -Xmx256m -Xms256m -Djava.io.tmpdir=/opt/CPrt-R80/tmp -Dfile.encoding=UTF-8 -DDedicatedServer=false -DTaskExecThreads=4 -Djavax.net.ssl.trustStore=/opt/CPshrd-R80/jre_32/lib/security/cacerts -Djavax.net.ssl.trustStorePassword=changeit -Djavax.net.ssl.keyStore=/opt/CPshrd-R80/jre_32/lib/security/cacerts -Djavax.net.ssl.keyStorePassword=changeit -Dlog4j.configuration=file:/opt/CPrt-R80/conf/smartview.log4j.properties -DRTDIR=/opt/CPrt-R80 -Dpath=/opt/CPrt-R80/jars/aspectjrt-1.7.0.jar:/opt/CPrt-R80/jars/commons-io-2.3.jar:/opt/CPrt-R80/jars/commons-lang-2.6.jar:/opt/CPrt-R80/jars/cxf-core-3.1.0.jar:/opt/CPrt-R80/jars/cxf-java2ws-plugin-3.1.0.jar:/opt/CPrt-R80/jars/cxf-rt-bindings-soap-3.1.0.jar:/opt/CPrt-R80/jars/cxf-rt-bindings-xml-3.1.0.jar:/opt/CPrt-R80/jars/cxf-rt-databinding-aegis-3.1.0.jar:/opt/CPrt-R80/jars/cxf-rt-databinding-jaxb-3.1.0.jar:/opt/CPrt-R80/jars/cxf-rt-frontend-jaxws-3.1.0.jar:/opt/CPrt-R80/jars/cxf-rt-frontend-simple-3.1.0.jar:/opt/CPrt-R80/jars/cxf-rt-javascript-3.1.0.jar:/opt/CPrt-R80/jars/cxf-rt-transports-http-3.1.0.jar:/opt/CPrt-R80/jars/cxf-rt-transports-http-jetty-3.1.0.jar:/opt/CPrt-R80/jars/cxf-rt-ws-addr-3.1.0.jar:/opt/CPrt-R80/jars/cxf-rt-ws-policy-3.1.0.jar:/opt/CPrt-R80/jars/cxf-rt-wsdl-3.1.0.jar:/opt/CPrt-R80/jars/cxf-tools-common-3.1.0.jar:/opt/CPrt-R80/jars/cxf-tools-java2ws-3.1.0.jar:/opt/CPrt-R80/jars/cxf-tools-validator-3.1.0.jar:/opt/CPrt-R80/jars/cxf-tools-wsdlto-core-3.1.0.jar:/opt/CPrt-R80/jars/cxf-tools-wsdlto-databinding-jaxb-3.1.0.jar:/opt/CPrt-R80/jars/cxf-tools-wsdlto-frontend-jaxws-3.1.0.jar:/opt/CPrt-R80/jars/java_is.jar:/opt/CPrt-R80/jars/java_sic.jar:/opt/CPrt-R80/jars/jaxb-api-2.2.7.jar:/opt/CPrt-R80/jars/jaxb-core-2.2.7.jar:/opt/CPrt-R80/jars/jaxb-impl-2.2.7.jar:/opt/CPrt-R80/jars/jaxb-xjc-2.2.11.jar:/opt/CPrt-R80/jars/neethi-3.0.3.jar:/opt/CPrt-R80/jars/rfl_sic.jar:/opt/CPrt-R80/jars/smartview-jetty.jar:/opt/CPrt-R80/jars/woodstox-core-asl-4.4.1.jar:/opt/CPrt-R80/jars/wsdl4j-1.6.3.jar:/opt/CPrt-R80/jars/xmlschema-core-2.2.1.jar: -DSTOP.PORT=8079 -DSTOP.KEY=smartview -jar start.jar OPTIONS=Server,resources,websocket /opt/CPrt-R80/conf/smartview-jetty.xml /opt/CPrt-R80/conf/smartview-service-jetty.xml
admin 4767 77.0 8.9 2547428 1461220 ? Ssl Sep27 7456:29 /opt/CPshrd-R80/jre_64/bin/java -D_CPM=TRUE -Xaot:forceaot -Xmx1024m -Xms192m -Xgcpolicy:optavgpause -Djava.io.tmpdir=/opt/CPsuite-R80/fw1/tmp -Xaggressive -Xshareclasses:none -Djava.security.krb5.conf=/opt/CPsuite-R80/fw1/conf/krb5.conf -Xjit:exclude={com/checkpoint/management/dleserver/coresvc/internal/SchemaMgrSvcImpl.getClassInfo*},exclude={com/checkpoint/management/object_store/ObjectStoreSessionImpl.findFieldsBySearchQueryEx*} -Xdump:directory=/var/log/dump/usermode -Xdump:heap:events=gpf+user -Xdump:tool:none -Xdump:tool:events=gpf+abort+traceassert+corruptcache,priority=1,range=1..0,exec=javaCompress.sh CPM %pid -Xdump:tool:events=systhrow,filter=java/lang/OutOfMemoryError,priority=1,range=1..0,exec=javaCompress.sh CPM %pid -Xdump:tool:events=throw,filter=java/lang/OutOfMemoryError,priority=1,exec=kill -9 %pid -Dfile.encoding=UTF-8 -cp /opt/CPshrd-R80/jars/solr-solrj-v4_8_1.jar:* com.checkpoint.management.cpm.Cpm -s
admin 5023 0.0 1.9 439680 314756 ? Ssl Sep27 5:16 /opt/CPshrd-R80/jre_32/bin/java -Xmx256m -Xms128m -Xshareclasses:none -Dfile.encoding=UTF-8 -Djetty.home=/opt/CPshrd-R80/jetty -Djava.io.tmpdir=/opt/CPsuite-R80/fw1/tmp -Djetty.state=/opt/CPsuite-R80/fw1/api/conf/jetty.state -DSTOP.PORT=8078 -DSTOP.KEY=checkpointkey -Dlog4j.configuration=file:/opt/CPsuite-R80/fw1/api/conf/log4j.properties -Dtdlog.logDir=/opt/CPsuite-R80/fw1/log -Dtdlog.web_api.logFile=api.elg -Dtdlog.output.appender=elgfile -Dtdlog.web_api.csvFile=api.csv -Dtdlog.output.csv.appender=csvfile -Djetty.host=0.0.0.0 -Dpath=/opt/CPsuite-R80/fw1/api/lib/web_api_jetty.jar: -Xdump:directory=/var/log/dump/usermode -Xdump:heap:events=gpf+user -Xdump:system:none -Xdump:system:events=gpf+abort+traceassert+corruptcache -Xdump:tool:none -Xdump:tool:events=gpf+abort+traceassert+corruptcache,priority=1,range=1..0,exec=javaCompress.sh WEB_API %pid -Xdump:tool:events=systhrow,filter=java/lang/OutOfMemoryError,priority=2,range=1..0,exec=javaCompress.sh WEB_API %pid -Xdump:tool:events=throw,filter=java/lang/OutOfMemoryError,priority=1,exec=kill -9 %pid -jar /opt/CPshrd-R80/jetty/start.jar OPTIONS=Server /opt/CPsuite-R80/fw1/api/conf/jetty.xml
admin 7113 1.9 1.5 1770360 250776 ? Sl Sep27 188:11 /opt/CPshrd-R80/jre_64/bin/java -D_CPM_SOLR=TRUE -Xmx512m -Xms64m -Xgcpolicy:optavgpause -Djava.io.tmpdir=/opt/CPsuite-R80/fw1/tmp -Xaggressive -Xshareclasses:none -Xdump:heap:events=gpf+user -Xdump:directory=/var/log/dump/usermode -Xdump:tool:none -Xdump:tool:events=gpf+abort+traceassert+corruptcache,priority=1,range=1..0,exec=javaCompress.sh CPM_SOLR %pid -Xdump:tool:events=systhrow,filter=java/lang/OutOfMemoryError,priority=1,range=1..0,exec=javaCompress.sh CPM_SOLR %pid -Xdump:tool:events=throw,filter=java/lang/OutOfMemoryError,priority=1,exec=kill -9 %pid -Dsolr.solr.home=/opt/CPsuite-R80/fw1/Solr/solr/ -DNGM.SOLR.LOG.DIR=/opt/CPsuite-R80/fw1/log -Djava.util.logging.config.file=/opt/CPsuite-R80/fw1/Solr/etc/logging.properties -DSTART=/opt/CPsuite-R80/fw1/Solr/start.config -Djetty.home=/opt/CPsuite-R80/fw1/Solr/ -DSTOP.KEY=checkpointkey -DSTOP.PORT=8982 -Dpath=/opt/CPsuite-R80/fw1/cpm-server/java_is.jar:/opt/CPsuite-R80/fw1/cpm-server/java_sic.jar:/opt/CPshrd-R80/jars/jetty_assist.jar -jar /opt/CPsuite-R80/fw1/Solr/start.jar
[Expert@PDC-CP-MGT:0]#
- Mark as New
- Bookmark
- Subscribe
- Mute
- Subscribe to RSS Feed
- Permalink
- Report Inappropriate Content
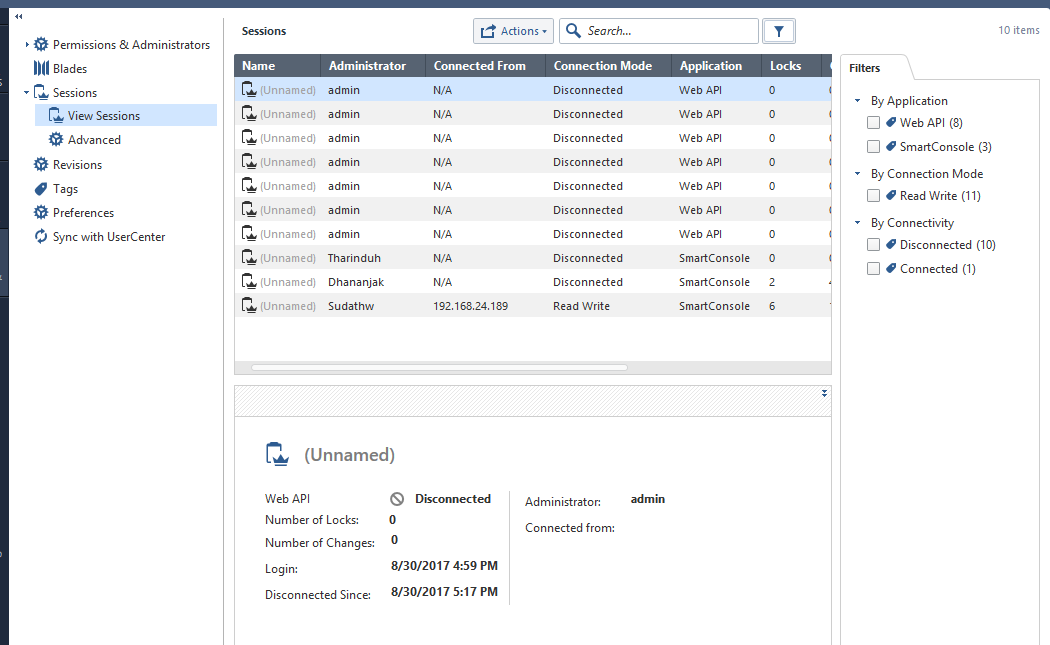
Uh, yeah 1382% CPU utilization by the CPM process is definitely not normal. The main function of CPM is to service all the SmartConsole GUI connections and how they interact with the SMS configuration database. Try the following:
0) Tell all other administrators to get out of the SmartConsole. In the SmartConsole go to Manage & Settings...Sessions. Do you see any active sessions besides your own, if so try discarding/disconnecting them as perhaps CPM is stuck in some kind of loop trying to service a dead or stuck session.
1) Check the log file for the process, in this case $CPDIR/log/cpm.elg (or it might be $FWDIR/log/cpm.elg). Perhaps it is constantly barfing some kind of error message there that will provide some insight.
2) Any core dumps for this process in /var/log/dump/usermode? Based on your provided output the process does not appear to be crashing and restarting, so my guess is no in this case.
3) lsof can be used to see the files and/or network connections a process is currently interacting with, in the case of a runaway process this can give an important clue about what resources the process is trying to access. Run lsof -p 4767 to see all open files held by that process, and lsof -i -a -p 4767 for a list of network sockets in use.
4) Finally, you can install the strace utility and attach it to the running process with the -p option to monitor all system calls the process is making in its runaway state. This will give you a pretty definitive idea of what the heck is going on with the process, however be warned that installing strace onto Gaia is most definitely not supported. Here is a statically-linked binary version of strace that should work and avoid any library dependency issues:
http://vault.centos.org/3.8/os/i386/RedHat/RPMS/strace-4.5.14-0.EL3.1.i386.rpm
--
My book "Max Power: Check Point Firewall Performance Optimization"
now available via http://maxpowerfirewalls.com.
New Book: "Max Power 2026" Coming Soon
Check Point Firewall Performance Optimization
Check Point Firewall Performance Optimization
- Mark as New
- Bookmark
- Subscribe
- Mute
- Subscribe to RSS Feed
- Permalink
- Report Inappropriate Content
There were some sessions shown in the sessions pane but all of them except the current session were in "Disconnected" state. I have discarded all the disconnected sessions as well but there was no improvement.
There were no core dumps in /var/log/dump/usermode. I have taken the lsof output and the cpm.elg files.
- Mark as New
- Bookmark
- Subscribe
- Mute
- Subscribe to RSS Feed
- Permalink
- Report Inappropriate Content
Attached the top command output and the ps aux output for all java processes.
I also noticed that I'm not experiencing this slowness on the test setup which I used for the migration. The test environment has only 4 CPU cores. The difference between the production and the test setup is the logs. This may have a connection with the logging process. I have disabled log indexing as well but it didn't do any good.
- Mark as New
- Bookmark
- Subscribe
- Mute
- Subscribe to RSS Feed
- Permalink
- Report Inappropriate Content
Definitely some exceptions getting logged into into cpm.elg. Also some of these other logfiles might be helpful:
/var/log/opt/CPsuite-R80/fw1/log/cpm.stdout.elg
/var/log/opt/CPshrd-R80/cpstart.log
/var/log/opt/CPsuite-R80/fw1/log/install_policy.elg
/var/log/opt/CPsuite-R80/fw1/log/dbsync.elg
I'd suggest working with Ran Kopelman who has posted to this thread, as diagnosing issues such as these will require interaction with Check Point support. Tough to tell if the entries in cpm.elg are related to your problem or not.
--
My book "Max Power: Check Point Firewall Performance Optimization"
now available via http://maxpowerfirewalls.com.
New Book: "Max Power 2026" Coming Soon
Check Point Firewall Performance Optimization
Check Point Firewall Performance Optimization
- Mark as New
- Bookmark
- Subscribe
- Mute
- Subscribe to RSS Feed
- Permalink
- Report Inappropriate Content
Hi Chammi
I'm Ran and I'm a manger in the R&D of Check Point, responsible for I/S in the Management Server.
I would like to help,
Can you please upload all cpm.elg log files (cpm.elg, cpm.elg.1.,2....cpm.elg.10) located under $MDS_FWDIR/log.
Dameon, who can assist Chammi with this procedure, basically I just need these files.
Thanks
Ran
- Mark as New
- Bookmark
- Subscribe
- Mute
- Subscribe to RSS Feed
- Permalink
- Report Inappropriate Content
Also, please run :
kill -3 ‘the pid of CPM’
The output is a tgz, it will be under /var/log/usermode/dump.
Please upload it in addition to the log files.
Again, please use the conventional ways to share this data.
*The pid of CPM can be found by running 'ps -ef | grep CPM'
Thanks,
Ran
- Mark as New
- Bookmark
- Subscribe
- Mute
- Subscribe to RSS Feed
- Permalink
- Report Inappropriate Content
Chammi Kumarapathirage if you haven’t already done so, please open a TAC ticket: Contact Support | Check Point Software
Ran, I’ve also provided you Chammi’s direct contact info offline.
- Mark as New
- Bookmark
- Subscribe
- Mute
- Subscribe to RSS Feed
- Permalink
- Report Inappropriate Content
If I recall the top output correctly I noticed some code is run by 32 bit JAVA engines. So you can't profit from all that RAM there.
It is worth while to use the 'c' option to toglle to full commandline output in your top output.
<< We make miracles happen while you wait. The impossible jobs take just a wee bit longer. >>
- Mark as New
- Bookmark
- Subscribe
- Mute
- Subscribe to RSS Feed
- Permalink
- Report Inappropriate Content
I'm getting something similar immediately after upgrading. 400-500% CPU usage only on my Domain Log Manager though, not the Domain Management Server.
Support is telling me this is expected behavior, that java, on behalf of the solr processing, will use up CPU to the maximum, but will kindly relinquish control when other processes require CPU.
¯\_(ツ)_/¯
- Mark as New
- Bookmark
- Subscribe
- Mute
- Subscribe to RSS Feed
- Permalink
- Report Inappropriate Content
yeah, regarding the log server RAM and CPU - we had to more than quadruple it from 4 cores 16GB to 16 cores 128GB to get reasonable performance.. Otherwise logs were unusable
- Mark as New
- Bookmark
- Subscribe
- Mute
- Subscribe to RSS Feed
- Permalink
- Report Inappropriate Content
Correct, this heavy CPU usage by SOLR is for log indexing. If you look closely in ps/top you'll see that the process has been "nice'd" down to the minimum CPU priority possible. So if literally any other process on the SMS is looking for CPU slices, SOLR will get thrown off the CPU to make way for the other process.
--
My Book "Max Power: Check Point Firewall Performance Optimization"
Second Edition Coming Soon
New Book: "Max Power 2026" Coming Soon
Check Point Firewall Performance Optimization
Check Point Firewall Performance Optimization
- Mark as New
- Bookmark
- Subscribe
- Mute
- Subscribe to RSS Feed
- Permalink
- Report Inappropriate Content
Hey Chammi, I was in a similar situation like yours. I can for sure say that your hardware specs are not sufficient considering number of rules and objects you have and yes R80+ will require more memory/CPU comparatively.
My suggestion:
- Run #cpstat -f log_server mg and #cpstat -f indexer ls on your SMS and see how many logs you are receiving. In my case I was logging tons of dns logs and all of them are being indexed, I turned off logging on some useless rules and that made things little stable.
- Figure out if the specs are sufficient for the logs that you are receiving (assuming your SMS is doing Policy mgmt and Logging)
Hope it helps.
Thanks.
- Mark as New
- Bookmark
- Subscribe
- Mute
- Subscribe to RSS Feed
- Permalink
- Report Inappropriate Content
It wasn't a hardware issue in the end. We increased RAM upto 64GB but issue remained the same. Checkpoint released a hotfix to address the issue. I will share the particulars later.
- Mark as New
- Bookmark
- Subscribe
- Mute
- Subscribe to RSS Feed
- Permalink
- Report Inappropriate Content
Hello, same issue here. We are testing out the management server in a vm. We started with way too low resources and bumped up the ram and cpu, still slow.
I wonder if the java processes' heap size is decided during the installation, and future changes to the ram are not taken into account... (unfounded assumption, of course).
I am curious to hear what the hotfix did to address this.
Regards
- Mark as New
- Bookmark
- Subscribe
- Mute
- Subscribe to RSS Feed
- Permalink
- Report Inappropriate Content
We asked for particulars regarding the hotfix but didn't get a proper response.The hotfix was supposed to improve UI response. After installing it, we didn't notice any reduction in CPU utilization but we did notice a huge improvement in the UI response time.
SR number if anyone is interested in more information.
1-9779162041
- Mark as New
- Bookmark
- Subscribe
- Mute
- Subscribe to RSS Feed
- Permalink
- Report Inappropriate Content
Hi Nico,
SMS Java heap sizes are determined every time the system is booted in response to more memory or other resources being added, see my lengthy exploration of this subject here:
--
Second Edition of my "Max Power" Firewall Book
Now Available at http://www.maxpowerfirewalls.com
New Book: "Max Power 2026" Coming Soon
Check Point Firewall Performance Optimization
Check Point Firewall Performance Optimization
- Mark as New
- Bookmark
- Subscribe
- Mute
- Subscribe to RSS Feed
- Permalink
- Report Inappropriate Content
Thank you both ![]()
Leaderboard
Epsum factorial non deposit quid pro quo hic escorol.
| User | Count |
|---|---|
| 32 | |
| 18 | |
| 13 | |
| 12 | |
| 10 | |
| 8 | |
| 6 | |
| 6 | |
| 6 | |
| 5 |
Upcoming Events
Fri 06 Mar 2026 @ 08:00 AM (COT)
Check Point R82 Hands‑On Bootcamp – Comunidad DOJO PanamáFri 06 Mar 2026 @ 08:00 AM (COT)
Check Point R82 Hands‑On Bootcamp – Comunidad DOJO PanamáTue 24 Mar 2026 @ 06:00 PM (COT)
San Pedro Sula: Spark Firewall y AI-Powered Security ManagementAbout CheckMates
Learn Check Point
Advanced Learning
YOU DESERVE THE BEST SECURITY
©1994-2026 Check Point Software Technologies Ltd. All rights reserved.
Copyright
Privacy Policy
About Us
UserCenter