- Products
- Learn
- Local User Groups
- Partners
- More
This website uses Cookies. Click Accept to agree to our website's cookie use as described in our Privacy Policy. Click Preferences to customize your cookie settings.
- Products
- Learn
- Local User Groups
- Upcoming Events
- Americas
- EMEA
- Czech Republic and Slovakia
- Denmark
- Netherlands
- Germany
- Sweden
- United Kingdom and Ireland
- France
- Spain
- Norway
- Ukraine
- Baltics and Finland
- Greece
- Portugal
- Austria
- Kazakhstan and CIS
- Switzerland
- Romania
- Turkey
- Belarus
- Belgium & Luxembourg
- Russia
- Poland
- Georgia
- DACH - Germany, Austria and Switzerland
- Iberia
- Africa
- Adriatics Region
- Eastern Africa
- Israel
- Nordics
- Middle East and Africa
- Balkans
- Italy
- Bulgaria
- Cyprus
- APAC
- Partners
- More
- ABOUT CHECKMATES & FAQ
- Sign In
- Leaderboard
- Events
AI Security Masters E7:
How CPR Broke ChatGPT's Isolation and What It Means for You
Blueprint Architecture for Securing
The AI Factory & AI Data Center
Call For Papers
Your Expertise. Our Stage
Good, Better, Best:
Prioritizing Defenses Against Credential Abuse
Ink Dragon: A Major Nation-State Campaign
Watch HereCheckMates Go:
CheckMates Fest
Turn on suggestions
Auto-suggest helps you quickly narrow down your search results by suggesting possible matches as you type.
Showing results for
- CheckMates
- :
- Products
- :
- Hybrid Mesh
- :
- Firewall and Security Management
- :
- Log Exporter and Elasticsearch
Options
- Subscribe to RSS Feed
- Mark Topic as New
- Mark Topic as Read
- Float this Topic for Current User
- Bookmark
- Subscribe
- Mute
- Printer Friendly Page
Turn on suggestions
Auto-suggest helps you quickly narrow down your search results by suggesting possible matches as you type.
Showing results for
Are you a member of CheckMates?
×
Sign in with your Check Point UserCenter/PartnerMap account to access more great content and get a chance to win some Apple AirPods! If you don't have an account, create one now for free!
- Mark as New
- Bookmark
- Subscribe
- Mute
- Subscribe to RSS Feed
- Permalink
- Report Inappropriate Content
Log Exporter and Elasticsearch
There have been multiple posts requesting information about Check Point's options for integration with an ELK stack for logging. Many of the posts recommend using log exporter over LEA for exporting logs to that system. I have not seen a post that covers configuration of the ELK stack in order to use this exported data. I put these behind spoiler tags as this is a fairly long winded post as I cover some of the basics before getting into the configuration options.
Screenshots
Click to Expand
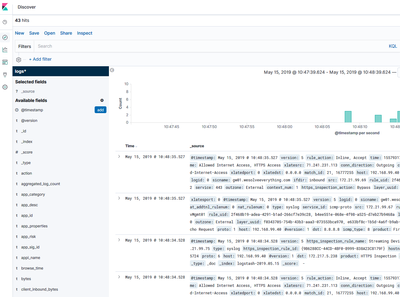
- Log data within the "Discover" section of Kibana.
- Basic Dashboard
Documentation
Click to Expand
Software Revisions |
|---|
|
Elasticsearch
|
|---|
|
What is Elasticsearch? Elasticsearch provides an API driven indexing solution for querying and storing large quantities of data. This can be used standalone or clustered solution. Elasticsearch also has additional deployment options providing real-time search integration with other database and storage platforms. In Arch Linux, Elasticsearch configuration files are stored under /etc/elasticsearch. This guide uses the default settings within the elasticsearch.yml file. The default configuration file has reasonable defaults and listens on TCP port 9200 on localhost. The JAVA configuration is stored in the jvm.options file. This is to adjust memory requirements used for the Java processes running Elasticsearch. |
Kibana
|
|---|
|
What is Kibana? Kibana is a customizable web interface that interacts with Elasticsearch in order to build dashboard, visualization, or search for stored data. In Arch Linux, the configuration folder is /etc/kibana. The kibana.yml file has a useful set of defaults that I recommend validating. |
|
|
|
|
|
Logstash
|
|---|
|
What is Logstash? From Elastic’s website: Logstash provides a method for receiving content, manipulating that content, and forwarding it on to a backend system for additional use. Logstash can manipulates these streams into acceptable formats for storage and indexing or additional processing of the content. In Arch Linux, the configuration folder is /etc/logstash. The Arch Linux package starts the logstash process and reads the configuration files under /etc/logstash/conf.d. This allows logstash to use multiple input sources, filters, and outputs. For example, logstash could be configured as a syslog service and output specific content to an Elasticsearch cluster on the network. It could also have another configuration file that listens on port 5044 for separate data to export into a different Elasticsearch cluster. |
|
Logstash Plugins Depending on the Linux distribution, several logstash plugins might not be available from the distribution file repository. In order to add additional plugins, the use of git is required to import them from the Logstash plugin repository. The logstash-plugins repository are available online at https://github.com/logstash-plugins/ and their installation process is documented on that site. |
NGINX
|
||
|---|---|---|
|
NGINX is a web and reverse proxy server. It also has other capabilities such as load balancing and web application firewall. The configuration for nginx is located in the /etc/nginx directory. Since NGINX can have a wide array of configurations, only the configuration used to allow access to Kibana is documented below. The configuration below accepts connections to /kibana and forwards them to the localhost:5601 service. For additional configuration options for NGINX, see https://docs.nginx.com.
|
Check Point Log Exporter
|
|
|---|---|
|
Check Point Log Exporter documentation can be found in SK article 122323 on Support Center. The configuration used in this document is very simple. The logstash configuration file is expecting the syslog messages to use the Splunk format. The Splunk format provides field delineation using the | character. This provides an easy option for Logstash’s KV filter to use in order to split the log fields.
|
Logstash Configuration
|
|
|---|---|
|
The input configuration tells the logstash process which plugins to run to receive content from external sources. Our example uses the UDP input plugin (logstash-input-udp) and is configured to act as a syslog service. Logstash has many other options for input types and content codecs. Additional information can be found by accessing the logstash Input plugin documentation at https://www.elastic.co/guide/en/logstash/current/input-plugins.html.
|
Logstash filters match, label, edit, and make decisions on content before it passes into Elasticsearch (ES). The filter section is where the patterns and labels are defined. In our example, logstash processes the syslog data through two separate filters.
The kv filter is used to automatically assign labels to the received logs. Since the messages sent via log_exporter are in a <key>=<value> format, the kv filter was chosen. This provides a simpler mechanism than using the grok or dissect plugins for assigning those values.
|
filter { if [type] == "syslog" { # Example of removing specific fields # String substitution |
The mutate plugin (logstash-filter-mutate) is used to manipulate the data as needed. In the configuration above, the originsicname field is renamed to sicname. Additional fields can be dropped using the remove_field configuration.
The configuration can be validated using the “-t” parameter when launching logstash. Configuration errors will be displayed and include the line numbers for the error.
| /usr/share/logstash/bin/logstash -t -f /etc/logstash/conf.d/checkpoint.yml |
Kibana - Basic Configuration |
|---|
|
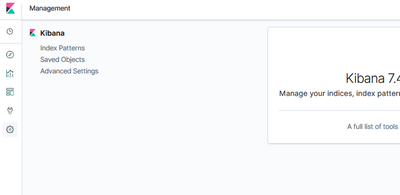
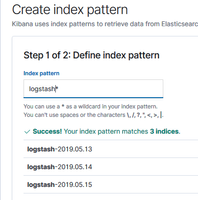
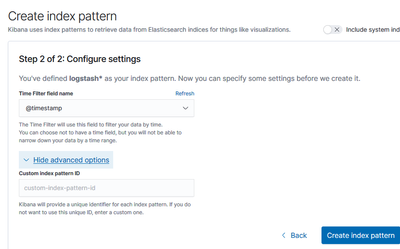
The default settings for Kibana are used in this document, so there are no additional configuration steps necessary. The NGINX configuration used in the earlier section will pass the requests to http://hostname/kibana to the http://localhost:5601 service. After opening the management page, Kibana needs to be configured to use the data contained within Elasticsearch.
|
12 Replies
- Mark as New
- Bookmark
- Subscribe
- Mute
- Subscribe to RSS Feed
- Permalink
- Report Inappropriate Content
Thanks for sharing 😁
It would be great if this could be added to the Log Exporter SK
____________
https://www.linkedin.com/in/federicomeiners/
https://www.linkedin.com/in/federicomeiners/
- Mark as New
- Bookmark
- Subscribe
- Mute
- Subscribe to RSS Feed
- Permalink
- Report Inappropriate Content
One customer said us about this integration, we work with syslog object for sending logs through a VPN to Elastic SIEM to the another partner. It works more easy that log exporter.
- Mark as New
- Bookmark
- Subscribe
- Mute
- Subscribe to RSS Feed
- Permalink
- Report Inappropriate Content
Except you are missing a LOT of logs using this approach.
You are only getting basic firewall logs and nothing from other blades (IPS, App Control, URL Filtering, etc).
You are only getting basic firewall logs and nothing from other blades (IPS, App Control, URL Filtering, etc).
- Mark as New
- Bookmark
- Subscribe
- Mute
- Subscribe to RSS Feed
- Permalink
- Report Inappropriate Content
Nice work!
- Mark as New
- Bookmark
- Subscribe
- Mute
- Subscribe to RSS Feed
- Permalink
- Report Inappropriate Content
Hi,
How do I send specific logs, Critical IPS logs to the elastic? only IPS.
Thancks help me
- Mark as New
- Bookmark
- Subscribe
- Mute
- Subscribe to RSS Feed
- Permalink
- Report Inappropriate Content
Arch Linux? 🙂
- Mark as New
- Bookmark
- Subscribe
- Mute
- Subscribe to RSS Feed
- Permalink
- Report Inappropriate Content
@masher Masher: Excellent walk through. The LS pipeline snippit in the spoiler's Logstash Config snippit is most helpful. I look forward to trying the splunk exporter with the kv filter.
Question:
Is there a way to force Checkpoint log exporter to include a timestamp on messages created using the the cef format?
Background:
Logstash's "syslog" input supports the 'cef' codec. This is the route we were originally exploring - and it did successfully parse the log messages from checkpoints cef format log exporter into key:value fields. However, the logs created when you choose the 'cef' format of the Checkpoint log exporter do not (for the most part - read on) include a timestamp (which is pretty important for time series log data)! When we looked at the raw output from a handful of the other Checkpoint output formats options (syslog, generic, splunk for example) they all included timestamps with every message - it is only missing from the cef format. Looking at the cef format field mappings <https://community.checkpoint.com/t5/Logging-and-Reporting/Log-Exporter-CEF-Field-Mappings/td-p/41060> we see that start_time maps to start. Unfortunately, only ~1/20 of the raw log messages (validated by using netcat on the Checkpoint manager itself) created by the cef exporter contained the 'start' field and there was nothing else that looked like a timestamp in the documents. I bring up the validation methodology (we used nc -l -p 514 | tee file_name.pcap, after creating an exporter: this should be easy to recreate) so we can rule out that the logstash cef codec was somehow stripping the data.
I'm hoping we're missing something obvious and that someone can give us a quick and easy way to get timestamps out of the cef format log exporter. If not, we'll follow your path of using splunk exporter with the kv filter (thanks again for that!).
- Mark as New
- Bookmark
- Subscribe
- Mute
- Subscribe to RSS Feed
- Permalink
- Report Inappropriate Content
I'm not sure why there would be a difference in the how the CEF exports sends the fields versus other log_exporter export formats. I do recall that I had some issues when attempting to use logstash's CEF input which is why I ended up with using kv.
It might be worth opening a new topic with some screenshots and examples.
- Mark as New
- Bookmark
- Subscribe
- Mute
- Subscribe to RSS Feed
- Permalink
- Report Inappropriate Content
@masher: Thanks for the reply and feedback. In our search for the path of least resistance, we'll likely follow the path you carved. We'll shift to generic (or splunk) output, use the KV filter and see if that meets our needs.
TL;DR
logstash's cef input codec seemed to function as expected. That is to say, when netcat (running on the checkpoint manager) showed that there was a key/field, this key/field was reliably parsed by logstash's cef codec and shipped to elasticsearch.
- Mark as New
- Bookmark
- Subscribe
- Mute
- Subscribe to RSS Feed
- Permalink
- Report Inappropriate Content
Hi @satsujinsha
May I ask you where exactly do you want to add time field? in the header of the log or in its body?
Time field is exported by default as part of the body of the log, look for the field 'rt'.
Please let me know about it, I will be happy to help here.
Thanks,
Shay
- Mark as New
- Bookmark
- Subscribe
- Mute
- Subscribe to RSS Feed
- Permalink
- Report Inappropriate Content
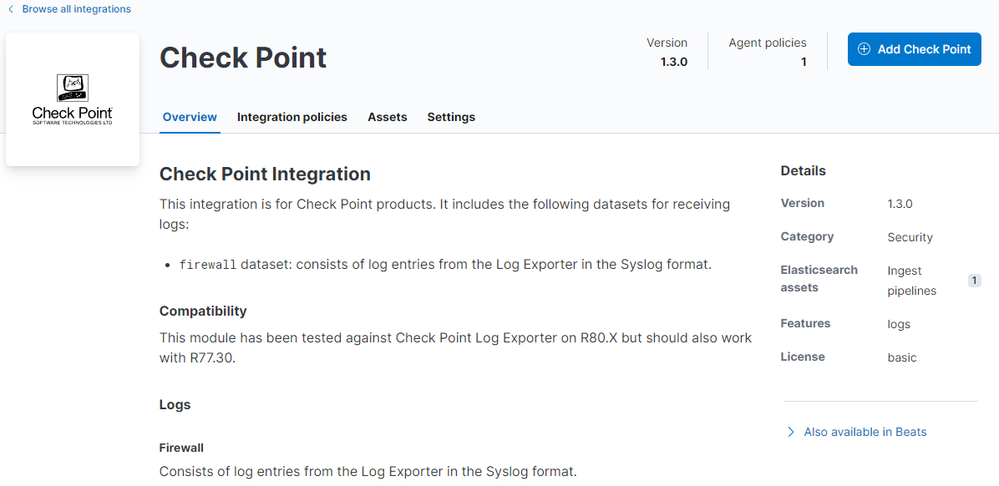
@masher Have you been able to get log exporter to work with the new elastic-agent and built in Check Point Integration? The documentation on the Integration is lackluster and I've been unable to get the log exporter to work with the agent.
- Mark as New
- Bookmark
- Subscribe
- Mute
- Subscribe to RSS Feed
- Permalink
- Report Inappropriate Content
Unfortunately, I have not had an opportunity to play around with the new integration options with Elasticsearch. I have plans to redo this how-to to take advantage of newer options, but I have not had time to get to that yet.
Leaderboard
Epsum factorial non deposit quid pro quo hic escorol.
| User | Count |
|---|---|
| 36 | |
| 11 | |
| 10 | |
| 10 | |
| 9 | |
| 8 | |
| 7 | |
| 7 | |
| 6 | |
| 6 |
Upcoming Events
Tue 28 Apr 2026 @ 06:00 PM (IDT)
Under the Hood: Securing your GenAI-enabled Web Applications with Check Point WAFThu 30 Apr 2026 @ 03:00 PM (PDT)
Hillsboro, OR: Securing The AI Transformation and Exposure ManagementTue 28 Apr 2026 @ 06:00 PM (IDT)
Under the Hood: Securing your GenAI-enabled Web Applications with Check Point WAFTue 12 May 2026 @ 10:00 AM (CEST)
The Cloud Architects Series: Check Point Cloud Firewall delivered as a serviceThu 30 Apr 2026 @ 03:00 PM (PDT)
Hillsboro, OR: Securing The AI Transformation and Exposure ManagementAbout CheckMates
Learn Check Point
Advanced Learning
YOU DESERVE THE BEST SECURITY
©1994-2026 Check Point Software Technologies Ltd. All rights reserved.
Copyright
Privacy Policy
About Us
UserCenter


