- Products
- Learn
- Local User Groups
- Partners
- More
This website uses Cookies. Click Accept to agree to our website's cookie use as described in our Privacy Policy. Click Preferences to customize your cookie settings.
- Products
- Learn
- Local User Groups
- Upcoming Events
- Americas
- EMEA
- Czech Republic and Slovakia
- Denmark
- Netherlands
- Germany
- Sweden
- United Kingdom and Ireland
- France
- Spain
- Norway
- Ukraine
- Baltics and Finland
- Greece
- Portugal
- Austria
- Kazakhstan and CIS
- Switzerland
- Romania
- Turkey
- Belarus
- Belgium & Luxembourg
- Russia
- Poland
- Georgia
- DACH - Germany, Austria and Switzerland
- Iberia
- Africa
- Adriatics Region
- Eastern Africa
- Israel
- Nordics
- Middle East and Africa
- Balkans
- Italy
- Bulgaria
- Cyprus
- APAC
- Partners
- More
- ABOUT CHECKMATES & FAQ
- Sign In
- Leaderboard
- Events
Firewall Uptime, Reimagined
How AIOps Simplifies Operations and Prevents Outages
Introduction to Lakera:
Securing the AI Frontier!
Check Point Named Leader
2025 Gartner® Magic Quadrant™ for Hybrid Mesh Firewall
HTTPS Inspection
Help us to understand your needs better
CheckMates Go:
SharePoint CVEs and More!
Turn on suggestions
Auto-suggest helps you quickly narrow down your search results by suggesting possible matches as you type.
Showing results for
Who rated this post
Turn on suggestions
Auto-suggest helps you quickly narrow down your search results by suggesting possible matches as you type.
Showing results for
- Mark as New
- Bookmark
- Subscribe
- Mute
- Subscribe to RSS Feed
- Permalink
- Report Inappropriate Content
Log Exporter and Elasticsearch
There have been multiple posts requesting information about Check Point's options for integration with an ELK stack for logging. Many of the posts recommend using log exporter over LEA for exporting logs to that system. I have not seen a post that covers configuration of the ELK stack in order to use this exported data. I put these behind spoiler tags as this is a fairly long winded post as I cover some of the basics before getting into the configuration options.
Screenshots
Click to Expand
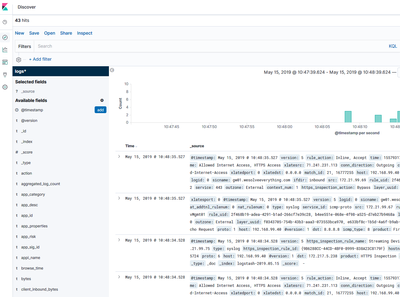
- Log data within the "Discover" section of Kibana.
- Basic Dashboard
Documentation
Click to Expand
Software Revisions |
|---|
|
Elasticsearch
|
|---|
|
What is Elasticsearch? Elasticsearch provides an API driven indexing solution for querying and storing large quantities of data. This can be used standalone or clustered solution. Elasticsearch also has additional deployment options providing real-time search integration with other database and storage platforms. In Arch Linux, Elasticsearch configuration files are stored under /etc/elasticsearch. This guide uses the default settings within the elasticsearch.yml file. The default configuration file has reasonable defaults and listens on TCP port 9200 on localhost. The JAVA configuration is stored in the jvm.options file. This is to adjust memory requirements used for the Java processes running Elasticsearch. |
Kibana
|
|---|
|
What is Kibana? Kibana is a customizable web interface that interacts with Elasticsearch in order to build dashboard, visualization, or search for stored data. In Arch Linux, the configuration folder is /etc/kibana. The kibana.yml file has a useful set of defaults that I recommend validating. |
|
|
|
|
|
Logstash
|
|---|
|
What is Logstash? From Elastic’s website: Logstash provides a method for receiving content, manipulating that content, and forwarding it on to a backend system for additional use. Logstash can manipulates these streams into acceptable formats for storage and indexing or additional processing of the content. In Arch Linux, the configuration folder is /etc/logstash. The Arch Linux package starts the logstash process and reads the configuration files under /etc/logstash/conf.d. This allows logstash to use multiple input sources, filters, and outputs. For example, logstash could be configured as a syslog service and output specific content to an Elasticsearch cluster on the network. It could also have another configuration file that listens on port 5044 for separate data to export into a different Elasticsearch cluster. |
|
Logstash Plugins Depending on the Linux distribution, several logstash plugins might not be available from the distribution file repository. In order to add additional plugins, the use of git is required to import them from the Logstash plugin repository. The logstash-plugins repository are available online at https://github.com/logstash-plugins/ and their installation process is documented on that site. |
NGINX
|
||
|---|---|---|
|
NGINX is a web and reverse proxy server. It also has other capabilities such as load balancing and web application firewall. The configuration for nginx is located in the /etc/nginx directory. Since NGINX can have a wide array of configurations, only the configuration used to allow access to Kibana is documented below. The configuration below accepts connections to /kibana and forwards them to the localhost:5601 service. For additional configuration options for NGINX, see https://docs.nginx.com.
|
Check Point Log Exporter
|
|
|---|---|
|
Check Point Log Exporter documentation can be found in SK article 122323 on Support Center. The configuration used in this document is very simple. The logstash configuration file is expecting the syslog messages to use the Splunk format. The Splunk format provides field delineation using the | character. This provides an easy option for Logstash’s KV filter to use in order to split the log fields.
|
Logstash Configuration
|
|
|---|---|
|
The input configuration tells the logstash process which plugins to run to receive content from external sources. Our example uses the UDP input plugin (logstash-input-udp) and is configured to act as a syslog service. Logstash has many other options for input types and content codecs. Additional information can be found by accessing the logstash Input plugin documentation at https://www.elastic.co/guide/en/logstash/current/input-plugins.html.
|
Logstash filters match, label, edit, and make decisions on content before it passes into Elasticsearch (ES). The filter section is where the patterns and labels are defined. In our example, logstash processes the syslog data through two separate filters.
The kv filter is used to automatically assign labels to the received logs. Since the messages sent via log_exporter are in a <key>=<value> format, the kv filter was chosen. This provides a simpler mechanism than using the grok or dissect plugins for assigning those values.
|
filter { if [type] == "syslog" { # Example of removing specific fields # String substitution |
The mutate plugin (logstash-filter-mutate) is used to manipulate the data as needed. In the configuration above, the originsicname field is renamed to sicname. Additional fields can be dropped using the remove_field configuration.
The configuration can be validated using the “-t” parameter when launching logstash. Configuration errors will be displayed and include the line numbers for the error.
| /usr/share/logstash/bin/logstash -t -f /etc/logstash/conf.d/checkpoint.yml |
Kibana - Basic Configuration |
|---|
|
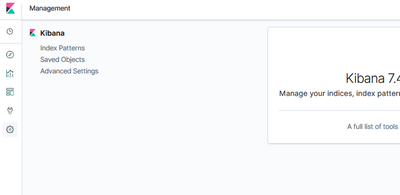
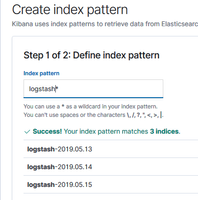
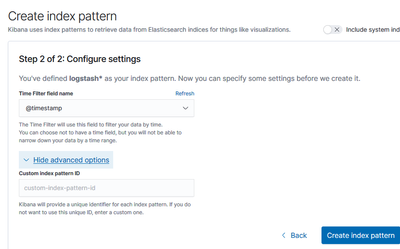
The default settings for Kibana are used in this document, so there are no additional configuration steps necessary. The NGINX configuration used in the earlier section will pass the requests to http://hostname/kibana to the http://localhost:5601 service. After opening the management page, Kibana needs to be configured to use the data contained within Elasticsearch.
|
About CheckMates
Learn Check Point
Advanced Learning
YOU DESERVE THE BEST SECURITY
©1994-2025 Check Point Software Technologies Ltd. All rights reserved.
Copyright
Privacy Policy
About Us
UserCenter


