- Products
- Learn
- Local User Groups
- Partners
- More

This website uses Cookies. Click Accept to agree to our website's cookie use as described in our Privacy Policy. Click Preferences to customize your cookie settings.
- Products
- AI Security
- Developers & More
- Check Point Trivia
- CheckMates Toolbox
- General Topics
- Products Announcements
- Threat Prevention Blog
- Upcoming Events
- Americas
- EMEA
- Czech Republic and Slovakia
- Denmark
- Netherlands
- Germany
- Sweden
- United Kingdom and Ireland
- France
- Spain
- Norway
- Ukraine
- Baltics and Finland
- Greece
- Portugal
- Austria
- Kazakhstan and CIS
- Switzerland
- Romania
- Turkey
- Belarus
- Belgium & Luxembourg
- Russia
- Poland
- Georgia
- DACH - Germany, Austria and Switzerland
- Iberia
- Africa
- Adriatics Region
- Eastern Africa
- Israel
- Nordics
- Middle East and Africa
- Balkans
- Italy
- Bulgaria
- Cyprus
- APAC
MVP 2026: Submissions
Are Now Open!
What's New in R82.10?
10 December @ 5pm CET / 11am ET
Announcing Quantum R82.10!
Learn MoreOverlap in Security Validation
Help us to understand your needs better
CheckMates Go:
Maestro Madness
Turn on suggestions
Auto-suggest helps you quickly narrow down your search results by suggesting possible matches as you type.
Showing results for
- CheckMates
- :
- Products
- :
- Network & SASE
- :
- Management
- :
- Re: CPViewer - visualize your cpview/cpinfo files ...
Options
- Subscribe to RSS Feed
- Mark Topic as New
- Mark Topic as Read
- Float this Topic for Current User
- Bookmark
- Subscribe
- Mute
- Printer Friendly Page
Turn on suggestions
Auto-suggest helps you quickly narrow down your search results by suggesting possible matches as you type.
Showing results for
Are you a member of CheckMates?
×
Sign in with your Check Point UserCenter/PartnerMap account to access more great content and get a chance to win some Apple AirPods! If you don't have an account, create one now for free!
- Mark as New
- Bookmark
- Subscribe
- Mute
- Subscribe to RSS Feed
- Permalink
- Report Inappropriate Content
Jump to solution
CPViewer - visualize your cpview/cpinfo files in 5 minutes
What is CPViewer?
CPViewer is an open-source community tool which simplifies the way to get a very detailed visual insights into:
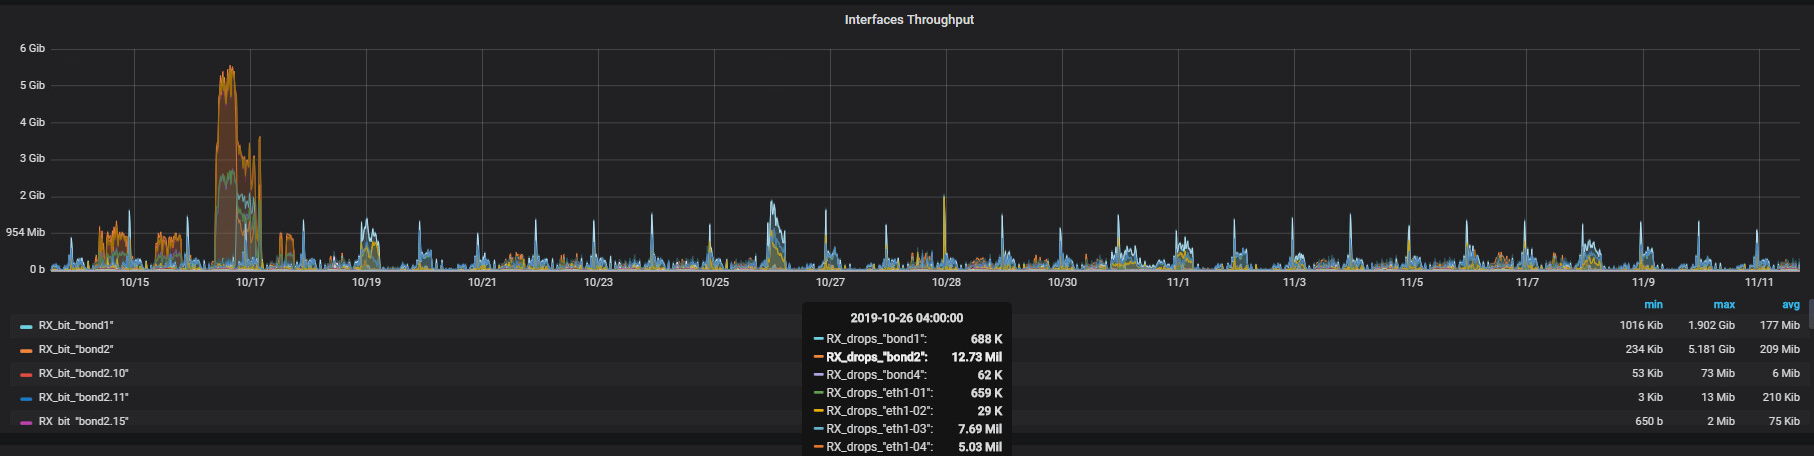
1) Exported cpview histories with charts related to CPU, memory, connections and packet rates, throughputs, RX&TX drops etc. using the visualization metrics tool called Grafana;
2) OS analysis (.info file) - healthcheck (sk121447) report for "known issues" and "things not to miss";
The tool comes within an .ova (exported VM) with everything already preconfigured.
The main benefits are:
-
analyzing and identifying performance bottlenecks in minutes
-
user-friendly: just upload it to web-site (no docker or other components needed)
-
Integrated OS analysis tool for richer results (healthcheck script)
-
available to both customers and partners
CPViewer .ova file download - HERE.
CPViewer guide - HERE.
How to use it?
Video below explains all you need to do to get CPViewer up and running - 5 simple steps:
Written step by step guide:
1. Import the VM:
a. Download and import OVA image into your VMWare environment – DOWNLOAD LINK.
b. VM’s network adapter is set to NAT, it has IPv4 – 10.8.0.15, default gw – 10.8.0.2 and DNS – 8.8.8.8 predefined already, but you can adjust this by your needs;
c. Adjust your VMWare NAT adapter;
d. Credentials:
- OS: root/vpn123
- Grafana: admin/Vpn123!
*NOTE: Your VM must have internet access if you want to use GDrive download functionality.
2. Working with CPViewer portal:
a. CPViewer portal can process two types of data:
1) CPInfo files (contains cpinfo and cpview files) -> you will get 2 reports, grafana cpview insights and cpinfo OS analysis report (in separate tab);
2) CPView (.dat or .gz – with .dat in it) files only;
*NOTE: In case you are using type 1, please be aware that you need to either configure your browser to allow pop-ups for http://10.8.0.15:80 in order to get the CPInfo healthcheck report. Other option is just to go to http://10.8.0.15/healthcheck_reports manually and select a report you need.
b. After setting up the VM, open any browser and go to CPViewer portal -> http://10.8.0.15.
Select upload method:
1) Manual/attachment upload: you can submit .dat or .gz file (which contains .dat);
2) Google link (server will automatically download file from GDrive). In this case solid upload link is highly recommended;
*NOTE: You can pick one of the two methods, not both at the same time;
c. Enter customer`s name (this will be used for name db and datasource of cpview; d. Select version from which cpview was exported – R77.30 – R80.10 or R80.20+;
e. If you did all of the above, select the submit button and wait for your reports to get created;
*NOTE: Speed of the processing will depetend on the size of the file (upload time + querying/healthcheck.sh execution through the .dat/.info and taking all the relevant info).
3. After you get redirected to Grafana you will be able to see your cpview visualized through graphs focused on different parameters. In case you uploaded CPInfo file you will also get GW`s healthcheck report in a separate tab.
Few useful GrafanaUI details:
- Top left corner – selected datasource (datasources will automatically be deleted on weekly basis);
- On menu at the far left you will be able to see possible dashboards (do not need to be changed since everything related to your cpview is automatically provisioned);
- Top right corner – time span which we are looking into (this is also automatically set from the first to the last timestmmp from your cpview);
- When clicking on different views you will be able to adjust some parameters or queries according to your needs;
*NOTE: All datasources – their dbs and healthcheck reports are being automatically deleted every Monday at midnight. If you do not want this – enter crontab using command crontab – e from CLI, erase the camm of deleteALL.php and/or delete_hc.sh script/s and save it.
*DISCLAIMER - This open source tool is provided “As Is”. No representations or warranties are provided with the use of this tool.
3 Solutions
Accepted Solutions
- Mark as New
- Bookmark
- Subscribe
- Mute
- Subscribe to RSS Feed
- Permalink
- Report Inappropriate Content
Will that help?
https://vitux.com/ubuntu-network-configuration/
Web service most probably should also be restarted though.
- Mark as New
- Bookmark
- Subscribe
- Mute
- Subscribe to RSS Feed
- Permalink
- Report Inappropriate Content
- Mark as New
- Bookmark
- Subscribe
- Mute
- Subscribe to RSS Feed
- Permalink
- Report Inappropriate Content
It is because there are two "component_name" values (Host and LightSpeed) and the LightSpeed line may contains "0" (zero) data
For example:
#sqlite3 -noheader -csv cpview_services.dat 'SELECT * FROM main.fw_network_stats_traffic_rate limit 4'
1684095733,Host,87395,87593,318868012,329773658,762
1684095733,LightSpeed,0,0,0,0,0
1684095794,Host,86620,86796,306416968,317185350,758
1684095794,LightSpeed,0,0,0,0,0
Workaround (for example):
vi /var/www/html/bash/CPview_influx81.sh
Replace this line:
sqlite3 -noheader -csv $DB "SELECT inbound_throughput,outbound_throughput,inbound_packets_rate,outbound_packets_rate,conn_rate, Timestamp FROM main.fw_network_stats_traffic_rate" | gawk -F, '{printf "fw_counters inbound_throughput=%di,outbound_throughput=%di,inbound_packet_rate=%di,outbound_packet_rate=%di,conn_rate=%di %s\n",$1,$2,$3,$4,$5,$6;}' | curl -i -X POST "http://localhost:8086/write?db=$database_name&precision=s" --data-binary @-
To:
sqlite3 -noheader -csv $DB "SELECT inbound_throughput,outbound_throughput,inbound_packets_rate,outbound_packets_rate,conn_rate, Timestamp FROM main.fw_network_stats_traffic_rate where component_name='Host'" | gawk -F, '{printf "fw_counters inbound_throughput=%di,outbound_throughput=%di,inbound_packet_rate=%di,outbound_packet_rate=%di,conn_rate=%di %s\n",$1,$2,$3,$4,$5,$6;}' | curl -i -X POST "http://localhost:8086/write?db=$database_name&precision=s" --data-binary @-
Observe "where component_name='Host'" on the end of SELECT query...
110 Replies
- Mark as New
- Bookmark
- Subscribe
- Mute
- Subscribe to RSS Feed
- Permalink
- Report Inappropriate Content
Amazing tool and very helpful!
- Mark as New
- Bookmark
- Subscribe
- Mute
- Subscribe to RSS Feed
- Permalink
- Report Inappropriate Content
And clearly to customers if you're posting on CheckMates.
Nicely done!
Nicely done!
- Mark as New
- Bookmark
- Subscribe
- Mute
- Subscribe to RSS Feed
- Permalink
- Report Inappropriate Content
Thank you very much for sharing!
Very intesresting tool for support purposes. Nicely done! 🙂
CCSA CCSE
- Mark as New
- Bookmark
- Subscribe
- Mute
- Subscribe to RSS Feed
- Permalink
- Report Inappropriate Content
Great job, @Petar_Markota!
- Mark as New
- Bookmark
- Subscribe
- Mute
- Subscribe to RSS Feed
- Permalink
- Report Inappropriate Content
Well done Petar! Svaka cast. 🙂
- Mark as New
- Bookmark
- Subscribe
- Mute
- Subscribe to RSS Feed
- Permalink
- Report Inappropriate Content
Thanks for reminding us that the CPview history database can be visualized with tools like Grafana, DBPlot and others.
The web visualization output of Check Points Gaia Healthcheck script is a default feature of the tool with full vendor support. Within your project one would lose the vendor support, right?
A few other questions pop up in my head:
- You publish Check Points copyrighted health check script publicly on a Google drive (within an ova file) making it downloadable for everyone thus circumventing Check Points Support Center Access policy -> Where is Check Points statement that they granted permission for this?
- You use Check Points official document template including copyright notes while you distribute Open Source software -> What about copyrights?
- Your CPViewer guide looks like an official Check Point document but Check Point doesn't know anything about it?
- Your CPViewer guide is entitled for SEs/partners, however this thread says it's for customers as well. What is correct?
- Your CPViewer guide says: *NOTE: Your VM must have internet access.. Why?
- Your CPViewer accepts downloads of Check Point CPinfo files from Google Drives. Why would anyone ever upload his confidential Check Point data to a Google drive?
- You are a Check Point employee. Why aren't you hosting this on Check Points GitHub account? Check Point has other open source projects that are hosted there (example: sk120342). This would look way more official than the Google drive solution.
- Mark as New
- Bookmark
- Subscribe
- Mute
- Subscribe to RSS Feed
- Permalink
- Report Inappropriate Content
Hi @Danny ,
Thanks for feedback and great observations.
Prior to publishing CPViewer on Check Mates (for everyone) we checked with product management and legal department after which we got an approval for the public post on here. Months before, this tool was available internally/was shared with partners and after a great feedback we decided to publish it for all since it obviously can be helpful to anyone with CP gateways and it does not contain anything that is confidential.
HC script will be updated in case of a new versions.
Answers to your questions:
1) The main idea of the tool is to have it all centralized in one place, automatically provisioned, where without much hustle people can use its capabilities and get the reports ASAP when needed. Healthcheck script is a great feature which acts as an addition to cpview chart and enriches the info we get, so it was a nice idea to add it up to the tool. Again, the purpose of the tool is only to help people solve potential problems faster and easier, so I don`t think we need to be so strict on this.
2,3) I was not notified about the word template issue which you mentioned. Once again, thanks for great observation. It is removed now.
4) I renamed it.
5) The tool has a feature where you can add a GDrive link to your cpview/cpinfo files from where they would be downloaded. This is the only reason why it needs to have internet access. If you will be attaching files only from your local machine you don`t need Internet access. I added a clarification.
6) Here, you answered your question from above. Some people do, it`s just another feature which can be used if you want.
7) We went through the process of approval for the tool`s posting on CheckMates and I was not pointed to use any of those. Thank you for mentioning it though, we might transfer it to one of them in the future.
- Mark as New
- Bookmark
- Subscribe
- Mute
- Subscribe to RSS Feed
- Permalink
- Report Inappropriate Content
Hi Petar,
I used a lof of times this tool, it is amazing to visualize the heavily loaded interfaces.
It helped me a lot of times.
Now I have a question. Does the tool support R81.10 JFH66?
My experience is that, the overal throughput was not shown correctly, I see only a constant line.
Looking forward to your answer,
Akos
----------------
\m/_(>_<)_\m/
\m/_(>_<)_\m/
- Mark as New
- Bookmark
- Subscribe
- Mute
- Subscribe to RSS Feed
- Permalink
- Report Inappropriate Content
Hey @Danny ,
Glad to hear from you!
I really think this tool is helping a lot of people so far, both employees and not.
@Petar_Markota might be able to tell us how many people already thanked him so far...
Apart from that, just have a look at the previous comments on this post, many Check Point employees are really happy with the tool.
Just trying to answer some of your questions...
- By using this tool, you don't lose your product support. As the VM doesn't need to be in your network, it can be in a lab/monitoring environment. So you just need to import the files to populate the Grafana with the data from the Gateway. The HealthCheck file on the gateway is not going to be modified.
- Check Point does know about it. It's being shared accross the whole company for months.
- Regarding the internet access requirement...
I think it's clearly stated in the full sentence. It is a must IF you want to use Google Drive feature.
@Petar_Markota may be able to explain better if I got something wrong
Please, let us know your thoughts.
Regards,
Henrique
- Mark as New
- Bookmark
- Subscribe
- Mute
- Subscribe to RSS Feed
- Permalink
- Report Inappropriate Content
Thanks for the clarifications and corrections.
I'm still curious about the Google Drive thing. Petar confirmed some people (i.e. Check Point SEs/Partners) do upload Check Point CPinfo and other troubleshooting files to Google Drive which is why he added the feature to download files from there.
CPinfo files may contain valid UserCenter account data, customers' entire network topology and security policy information and many other highly confidential data and therefore should never be uploaded to any external resource.
I'd be glad if Check Point's own DiagnosticsView would allow showing Healthcheck reports and CPview database plots for the opened CPinfo/CPview files.
@Mor_Aisenberg , @Anna_Fridman : What about this idea? Obviously Check Point SE's/partner have the need for a simple utility to runs advanced health checks and CPview database plots, let's extend DiagnosticsView for this in order to have one central CP support diagnostics tool.
- Mark as New
- Bookmark
- Subscribe
- Mute
- Subscribe to RSS Feed
- Permalink
- Report Inappropriate Content
GDrive functionality is there since June/July. At that time the tool was accepting only cpview .dat files, or cpview .dats within .gz or .zip, and at that time I saw couple of cases where people for easier sharing are uploading it to other sources. GDrive seemed as one of the nice ways to share stuff, so this is the reason it was added in the first place. CPInfo analysis (healthcheck) has being added in November this year. At this time GDrive functionality was already a part of the tool.
Danny, I fully agree with you that CPInfo isn`t something that should be uploaded anywhere ever, but GDrive is just a functionality which has been added as one of the options for CPInfo analysis too, since it was there for cpview .dats. Healthcheck script is basically the only thing within CPViewer which processes .info files. When I created a GDrive download option, I looked at it from the development perspective and I didn`t think if someone wants or doesn`t want to do this - it was purely to have another way to do it besides the local attachments.
Again, this tool is something that we created for purposes of troubleshooting in our region (because easy and automatized way for getting it visualized nicely did not exist) and after realizing it can really help not only us, but anyone with our gateways, we decided to spread it out.
It would be really awesome if DiagnosticsView would be doing this too. Thumbs up for that!!
- Mark as New
- Bookmark
- Subscribe
- Mute
- Subscribe to RSS Feed
- Permalink
- Report Inappropriate Content
So let's sum up what CPViewer currently is:
- A Linux OS Ubuntu installation within a VMware .ova file (1.1 GB)
- containing a web server to support uploading for CP diagnostic files
- containing a Grafana installation to show a database plot of CPview databases within a web browser
- containing the Gaia Health Check script to provide the HTML result of the script
Correct?
- Mark as New
- Bookmark
- Subscribe
- Mute
- Subscribe to RSS Feed
- Permalink
- Report Inappropriate Content
Correct, more precisely, It is the Ubuntu (release 18.04) server running the following:
1) Apache v2.4 as a web server (+PHPv7.3, +SQLite3 used in queries);
2) Grafana (v6.5.1) for the data visualization;
3) InfluxDB (v1.7.9) where all the data is stored after extraction;
4) Number of bash scripts with queries which are used for data extraction from .dat files;
5) Python (python3) script using "GDown (v3.8.3)" utility for downloading the files from GDrive;
6) Number of .php scripts which are working in convergance with bash scripts in order to automatize the following:
- Data extraction from .dat files depending on the version (R77.30/R80.10 or R80.20 and above) since two engines differ in queries structure as the versions DBs are different;
- Automatic Grafana datasource provisioning;
- Automatic Grafana dashboard provisioning. Here we created two dashboards R77 and R80 which are used depending on the user`s input at the beginning regarding the versions;
- Automatic Grafana timestamp provisioning;
- Automatic URL provisioning (IP range checks - for cases where the VM is exposed to the access from the internet);
- Running the healthcheck script on cpinfo files and showing a result in .html to the user;
- Uncompressing from .gz, .zip, .info.tar.gz when needed;
7) Crontab lines responsible for automatically deleting all data on weekly basis;
8. Since ubuntu didn`t have preinstalled many small tools which were needed, I installed few along the way, necessary for dev fixes and the tool to run properly (examples open-vm-tools, mlocate, unzip etc. );
9) User interface (some html+css for frontend and JS for input checks on few places) which takes the relevant info from the fields (later used for naming the datasources/cpviews and version pointer);
I hope these details are clearing it more up.
/var/www/html contains all the code responsible for the stuff from above.
- Mark as New
- Bookmark
- Subscribe
- Mute
- Subscribe to RSS Feed
- Permalink
- Report Inappropriate Content
Cool, I'm adding this project to my CPX 2020 presentation 'CheckMates - Best of Code Hub Contributions' in Vienna on February 5th, 2020 (14:00 - 14:30).
- Mark as New
- Bookmark
- Subscribe
- Mute
- Subscribe to RSS Feed
- Permalink
- Report Inappropriate Content
Sounds awesome! Thanks a lot @Danny !!
- Mark as New
- Bookmark
- Subscribe
- Mute
- Subscribe to RSS Feed
- Permalink
- Report Inappropriate Content
@Petar_Markota Once more, fantastic job, Petar!
- Mark as New
- Bookmark
- Subscribe
- Mute
- Subscribe to RSS Feed
- Permalink
- Report Inappropriate Content
Thank you @_Val_ !!
Always happy to contribute to the community 🙂
- Mark as New
- Bookmark
- Subscribe
- Mute
- Subscribe to RSS Feed
- Permalink
- Report Inappropriate Content
Great job:-)
➜ CCSM Elite, CCME, CCTE ➜ www.checkpoint.tips
- Mark as New
- Bookmark
- Subscribe
- Mute
- Subscribe to RSS Feed
- Permalink
- Report Inappropriate Content
DiagnosticsView latest version already supports CPView database chart creation (CPView DB Viewer). Please refer to the sk125092 for the detailed description and DiagnosticsView download link (https://supportcenter.checkpoint.com/supportcenter/portal?eventSubmit_doGoviewsolutiondetails=&solut...).
Regarding health checks, it is in our future features list.
- Mark as New
- Bookmark
- Subscribe
- Mute
- Subscribe to RSS Feed
- Permalink
- Report Inappropriate Content
Great staff! Thanks!
Could you please share the manual how to change the IP address? I found that it's not easy 🙂
/etc/network/interfaces doesn't work.
- Mark as New
- Bookmark
- Subscribe
- Mute
- Subscribe to RSS Feed
- Permalink
- Report Inappropriate Content
Will that help?
https://vitux.com/ubuntu-network-configuration/
Web service most probably should also be restarted though.
- Mark as New
- Bookmark
- Subscribe
- Mute
- Subscribe to RSS Feed
- Permalink
- Report Inappropriate Content
Hola, hice la configuración de las IP´s pero no funciona, algun tema específico que deba considerar en la maquina virtual?
Por su ayuda, gracias
- Mark as New
- Bookmark
- Subscribe
- Mute
- Subscribe to RSS Feed
- Permalink
- Report Inappropriate Content
Nada especial, esto debería funcionar.
Mire la configuración de red de VMware
Akos
----------------
\m/_(>_<)_\m/
\m/_(>_<)_\m/
- Mark as New
- Bookmark
- Subscribe
- Mute
- Subscribe to RSS Feed
- Permalink
- Report Inappropriate Content
Hello,
Why is this thread placed inside the Management section ? Is this tool capable to work only with management data ?

Why there is no official sk article about this new tool, as it was fully approved/tested/QAed by Check Point employees ?
Why should I download something outside of Check Point servers which was properly tested by authority (Check Point) ?
I am very sorry, but once I first time clicked on this page, I expected that I will be able to download a simple .sh file like is the case for Health Check script.
I simply scrolled it to the end and closed the page, as too complicated and time consuming.
If I may suggest something... Why not put everything as part of SmartConsole (maybe extension) ? Right click on selected gateway --> Monitoring --> Show CPU graphs/ Show Memory graphs etc ?
Simply combine all features from CPInfo utility + CPView Utility + Health Check script + DiagnosticsView + CPViewer + other tools mentioned in Support Debug Tools into one universal powerful Check Point proprietary Monitoring tool.
Kind regards,
Jozko Mrkvicka
Jozko Mrkvicka
- Mark as New
- Bookmark
- Subscribe
- Mute
- Subscribe to RSS Feed
- Permalink
- Report Inappropriate Content
@Petar_Markota could you please respond?
From my side:
1. The tools is provided "as is". It is developed by Check Point SEs and not R&D
2. It is based on several open source technologies, and it requires a VM to run on, hence it is virtually impossible to implement it as part of SmartConsole at this point.
However, I like the idea of developing the extension based on a similar idea. Just mind, that effort may take lots of time, considering complexity of the tool. Also, I am not sure R&D has enough time and resources to invest here. It might be, having a VM on a side is the only way.
- Mark as New
- Bookmark
- Subscribe
- Mute
- Subscribe to RSS Feed
- Permalink
- Report Inappropriate Content
Hello,
There are tools that collects data (CPInfo, CPView) and there are tools that analyze it. DiagnosticsView is the official Check Point R&D diagnostics tool for CPInfo and CPView data visualization and analysis. Our intention is to add all features to the DiagnosticsView and have one tool - DiagnosticsView.
For any DiagnosticsView question or feature suggestion, please contact us by sending an email to diagnostics_view_features_box@checkpoint.com
Thanks,
Anna Fridman, Diagnostics team SW developer.
- Mark as New
- Bookmark
- Subscribe
- Mute
- Subscribe to RSS Feed
- Permalink
- Report Inappropriate Content
Hello @JozkoMrkvicka ,
Thanks for the feedback and questions!
Answers to your questions:
Thread is placed in Visibility&Analytics part since the tool is focused on these.
Like @_Val_ explained, the tool is open-source and provided "as is". It is not an official Check Point tool but rather a open-source community tool available to all who can find it useful. One of the comments above also explains this.
The tool can be set up and ready to go within minutes and is very simple to use. In the tutorial (shown in the video above) - it took 7 mins for importing the VM, logging in, setting up network, attaching cpinfo and cpview files and processing them to the results pages.
The details about the tool in the post are there to guide people and explain the tool as better as possible.
The idea of the consolidation within SmartConsole which you mentioned is amazing, but this requires valuable resources and a lot of time. On the other hand what Val mentioned - the conversion of all this into something that could be integrated within SC would be much bigger project than the CPViewer itself.
- Mark as New
- Bookmark
- Subscribe
- Mute
- Subscribe to RSS Feed
- Permalink
- Report Inappropriate Content
Thanks for the utility.
I have the same scenario but i need to monitoring throughput per interface in 64000 Chasis.
How can i do that? I find some OID but those are incorrect.
Thanks.
- Mark as New
- Bookmark
- Subscribe
- Mute
- Subscribe to RSS Feed
- Permalink
- Report Inappropriate Content
Leaderboard
Epsum factorial non deposit quid pro quo hic escorol.
| User | Count |
|---|---|
| 22 | |
| 15 | |
| 7 | |
| 6 | |
| 5 | |
| 5 | |
| 4 | |
| 4 | |
| 4 | |
| 4 |
Upcoming Events
Fri 12 Dec 2025 @ 10:00 AM (CET)
Check Mates Live Netherlands: #41 AI & Multi Context ProtocolFri 12 Dec 2025 @ 10:00 AM (CET)
Check Mates Live Netherlands: #41 AI & Multi Context ProtocolTue 16 Dec 2025 @ 05:00 PM (CET)
Under the Hood: CloudGuard Network Security for Oracle Cloud - Config and Autoscaling!About CheckMates
Learn Check Point
Advanced Learning
YOU DESERVE THE BEST SECURITY
©1994-2025 Check Point Software Technologies Ltd. All rights reserved.
Copyright
Privacy Policy
About Us
UserCenter