- Products
- Learn
- Local User Groups
- Partners
- More
MVP 2026: Submissions
Are Now Open!
What's New in R82.10?
Watch NowOverlap in Security Validation
Help us to understand your needs better
CheckMates Go:
Maestro Madness
Hello CheckMates,
Here is the issue, I have faced several times with the issue that standby member has stopped to answer icmp, http, https and ssh requests. Only reboot of a member helps.
In var/log/messages there are only 2 lines wich correlates with the time of that failover
Jun 10 17:10:46 2019 cpfw-msk-2 kernel: [fw4_1];CLUS-220201-2: Starting CUL mode because CPU usage (81%) on the remote member 1 increased above the configured threshold (80%).
Jun 10 17:10:56 2019 cpfw-msk-2 kernel: [fw4_1];CLUS-120202-2: Stopping CUL mode after 10 sec (short CUL timeout), because no member reported CPU usage above the configured threshold (80%) during the last 10 sec.
I have read some articles related to that messages on the CheckMates, however, I wonder do these messages mean a failover? And what is the possible cause?
Meantime, on the both cluster members by means of monitoring blade I do not see any high peaks - the 1st screenshot is the active member, the second is the standby.
The message does not constitute failover. In fact, the opposite. CUL feature freezes CLX status in case of high CPU utilisation, to avoid a failover.
There is something going on with CPU, other than that, you need to look further.
Hi,
Are you getting these messages when you install policy?
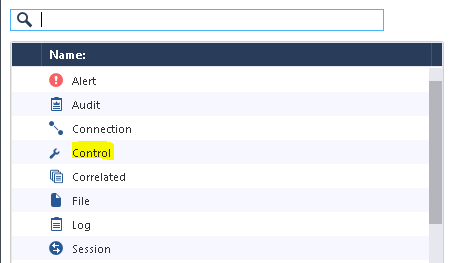
Please filter type as control in smart log and check description if you are getting any hint during that time.
Agree with the others, you need to identify why CPU load is so high on the standby; the CUL is just a symptom of your problem and not the cause. cpview in history mode (-t) and the sar command can be helpful. If you can identify in which "space" the excessive CPU is being consumed (us/sy/ni/si/hi) that will help guide where to look next.
Any dynamic routing being used on this gateway cluster? There are a few known causes of high CPU on the standby when that feature is in use, see sk95966 and sk105863 for more details.
Thank you colleagues!
Timothy I guess that limitations are not acceptable to ma case, because the version is R80.20.
Nevertheless, the weird thing is monitoring blade shows me no peaks at those moments.
Can the cpview history give me more information and how deep can I drill down in this history (a day, a week or more)?
Thanks in advance.
Look into this document: sk101878: CPViewUtility
Also i found sk35466 and sk120712: Standby Cluster Member stops responding.
Leaderboard
Epsum factorial non deposit quid pro quo hic escorol.
| User | Count |
|---|---|
| 11 | |
| 9 | |
| 9 | |
| 8 | |
| 6 | |
| 3 | |
| 2 | |
| 2 | |
| 2 | |
| 1 |
Tue 16 Dec 2025 @ 05:00 PM (CET)
Under the Hood: CloudGuard Network Security for Oracle Cloud - Config and Autoscaling!Thu 18 Dec 2025 @ 10:00 AM (CET)
Cloud Architect Series - Building a Hybrid Mesh Security Strategy across cloudsTue 16 Dec 2025 @ 05:00 PM (CET)
Under the Hood: CloudGuard Network Security for Oracle Cloud - Config and Autoscaling!Thu 18 Dec 2025 @ 10:00 AM (CET)
Cloud Architect Series - Building a Hybrid Mesh Security Strategy across cloudsAbout CheckMates
Learn Check Point
Advanced Learning
YOU DESERVE THE BEST SECURITY