- Products
- Learn
- Local User Groups
- Partners
- More
This website uses Cookies. Click Accept to agree to our website's cookie use as described in our Privacy Policy. Click Preferences to customize your cookie settings.
- Products
- Learn
- Local User Groups
- Upcoming Events
- Americas
- EMEA
- Czech Republic and Slovakia
- Denmark
- Netherlands
- Germany
- Sweden
- United Kingdom and Ireland
- France
- Spain
- Norway
- Ukraine
- Baltics and Finland
- Greece
- Portugal
- Austria
- Kazakhstan and CIS
- Switzerland
- Romania
- Turkey
- Belarus
- Belgium & Luxembourg
- Russia
- Poland
- Georgia
- DACH - Germany, Austria and Switzerland
- Iberia
- Africa
- Adriatics Region
- Eastern Africa
- Israel
- Nordics
- Middle East and Africa
- Balkans
- Italy
- Bulgaria
- Cyprus
- APAC
- Partners
- More
- ABOUT CHECKMATES & FAQ
- Sign In
- Leaderboard
- Events
AI Security Masters E7:
How CPR Broke ChatGPT's Isolation and What It Means for You
Blueprint Architecture for Securing
The AI Factory & AI Data Center
Call For Papers
Your Expertise. Our Stage
Good, Better, Best:
Prioritizing Defenses Against Credential Abuse
Ink Dragon: A Major Nation-State Campaign
Watch HereCheckMates Go:
CheckMates Fest
Turn on suggestions
Auto-suggest helps you quickly narrow down your search results by suggesting possible matches as you type.
Showing results for
- CheckMates
- :
- Products
- :
- General Topics
- :
- Re: r81 manager logging
Options
- Subscribe to RSS Feed
- Mark Topic as New
- Mark Topic as Read
- Float this Topic for Current User
- Bookmark
- Subscribe
- Mute
- Printer Friendly Page
Turn on suggestions
Auto-suggest helps you quickly narrow down your search results by suggesting possible matches as you type.
Showing results for
Are you a member of CheckMates?
×
Sign in with your Check Point UserCenter/PartnerMap account to access more great content and get a chance to win some Apple AirPods! If you don't have an account, create one now for free!
- Mark as New
- Bookmark
- Subscribe
- Mute
- Subscribe to RSS Feed
- Permalink
- Report Inappropriate Content
Jump to solution
r81 manager logging
Since I upgraded the manager to r81 I get 2 new logging entries every 30 seconds. So more than 5k per day.
Mapping of Updatable Object started. OnlineServices
Mapping of Data Center server finished. OnlineServices
Does it need to be done so often? Is there a way to deactivate the logging of this activity.
1 Solution
Accepted Solutions
- Mark as New
- Bookmark
- Subscribe
- Mute
- Subscribe to RSS Feed
- Permalink
- Report Inappropriate Content
Sorry, my mistake. Please try onlineservices.scannerInterval and not OnlineServices.scannerInterval.
Yes, Geo updatable objects are supposed to generate these logs. Not a bug. It is indication that the update process is working.
17 Replies
- Mark as New
- Bookmark
- Subscribe
- Mute
- Subscribe to RSS Feed
- Permalink
- Report Inappropriate Content
Don’t believe you can disable that.
However it’s probably worth a TAC case.
- Mark as New
- Bookmark
- Subscribe
- Mute
- Subscribe to RSS Feed
- Permalink
- Report Inappropriate Content
I hope it gets removed in the next jumbo. They are 5k useless logs everyday.
I guess it only happens if you use updatable or datacenter objects.
- Mark as New
- Bookmark
- Subscribe
- Mute
- Subscribe to RSS Feed
- Permalink
- Report Inappropriate Content
Hi
Sent a question to R&D owner.
Will report if there is something that can be done directly or if needs to be addressed in future release.
Thanks
- Mark as New
- Bookmark
- Subscribe
- Mute
- Subscribe to RSS Feed
- Permalink
- Report Inappropriate Content
Hi,
Answer from R&D is that the Security Gateway tries to download a package once every 2 hours.
It should not happen every 30 seconds, unless there probably might be some connectivity failure.
HTH
Tal
- Mark as New
- Bookmark
- Subscribe
- Mute
- Subscribe to RSS Feed
- Permalink
- Report Inappropriate Content
These are the logs I am getting - see bellow.
I am running a tcpdump in the manager and there are only external http connection attempts about every 5 minutes.
These logs don't match any connection attempt.
The list bellow are the hostnames that the firewall manager has successfully reached in the last 24 hours.
I have the impression that those mapping actions is an internal process.
| updates.checkpoint.com | 366 |
| productservices.checkpoint.com | 286 |
| dl3.checkpoint.com | 217 |
| usercenter.checkpoint.com | 13 |
| productcoverage.checkpoint.com | 12 |
Time: 2021-09-07T11:45:06Z
Id: 0a470b47-eeb2-9b19-6137-50c265990000
Sequencenum: 1
Client IP: x.x.x.x
Sendtotrackerasadvancedauditlog:0
Severity: Informational
Description: Mapping of Data Center server finished. OnlineServices []
Type: Control
Blade: CloudGuard IaaS
Origin: fm
Product Family: Network
Marker: @A@@B@1630969200@C@33221
Log Server Origin: x.x.x.x
Origin Log Server IP: x.x.x.x
Index Time: 2021-09-07T11:45:07Z
Lastupdatetime: 1631015106000
Lastupdateseqnum: 1
Confidence Level: N/A
Stored: true
Time: 2021-09-07T11:46:06Z
Id: 0a470b47-eeb2-9b19-6137-50fe659a0001
Sequencenum: 2
Client IP: x.x.x.x
Sendtotrackerasadvancedauditlog:0
Severity: Informational
Description: Mapping of Updatable Object started. OnlineServices []
Type: Control
Blade: CloudGuard IaaS
Origin: fm
Product Family: Network
Marker: @A@@B@1630969200@C@33261
Log Server Origin: x.x.x.x
Origin Log Server IP: x.x.x.x
Index Time: 2021-09-07T11:46:07Z
Lastupdatetime: 1631015166000
Lastupdateseqnum: 2
Confidence Level: N/A
Stored: true
- Mark as New
- Bookmark
- Subscribe
- Mute
- Subscribe to RSS Feed
- Permalink
- Report Inappropriate Content
Hi.
Some technical background:
- The logs that you are seeing are related to the usage of the Updatable Objects feature.
- The update of the Updatable Objects data is done inside the CloudGuard Controller process, in parallel to the update of all other types of Data Center, for example Azure, AWS, VMWare vCenter and more.
- The CloudGuard Controller process runs on the mgmt server. It is not running on the security GW.
- In R80.40 in order to improve visibility and troubleshooting, we added the "start" and "finished" logs to each type of Data Center. This helps customers to verify the Data Centers scans are running and also the scanning duration.
- In R81.10 we changed the logic a bit, to send only one log when the scanning ends (this will reduce the number of logs that you see by 50%)
- The default delay between data update is 30 seconds.
Are you using the Updatable Objects feature or not? If you are not using Updatable Objects, than you should not see these logs and this is a bug.
In order to change the delay between data update, you can edit $FWDIR/conf/vsec.conf and change or add
OnlineServices.scannerInterval=<VALUE_IN_SECONDS>
And then run "vsec stop ; vsec start"
- Mark as New
- Bookmark
- Subscribe
- Mute
- Subscribe to RSS Feed
- Permalink
- Report Inappropriate Content
Thanks.
I do use the updatable objects (geolocation objects)
So how will it work once the bug is fixed? Will it be fixed in the next jumbo?
I guess that it would be good if it was possible to enable/disable these logs just for troubleshooting because I think they are not needed in normal circumstances, no?
As a workaround I can change the scannerinternal to 2 hours but I guess if this logging was disabled I would like to leave the scanner interval to 30 secs by default.
However is this supposed to generate traffic every 30 seconds? I don't see it.
By the way OnlineServices.scannerInterval is not defined in $FWDIR/conf/vsec.conf. Do you mean global.scannerInterval?
- Mark as New
- Bookmark
- Subscribe
- Mute
- Subscribe to RSS Feed
- Permalink
- Report Inappropriate Content
I don't see any change with OnlineServices.scannerInterval. However I tried with global.scannerInterval to 5 min and now I get those logs every 5 minutes.
So now, I still don't understand if Geolocation updatable objects are supposed to generate these logs or this is a bug.
My assumption is that we would like to get those objects updated as much as possible but the logs only generated if we there are problems and we need to troubleshoot.
- Mark as New
- Bookmark
- Subscribe
- Mute
- Subscribe to RSS Feed
- Permalink
- Report Inappropriate Content
Sorry, my mistake. Please try onlineservices.scannerInterval and not OnlineServices.scannerInterval.
Yes, Geo updatable objects are supposed to generate these logs. Not a bug. It is indication that the update process is working.
- Mark as New
- Bookmark
- Subscribe
- Mute
- Subscribe to RSS Feed
- Permalink
- Report Inappropriate Content
onlineservices.scannerInterval works thanks.
But I still don't see the value of those logs. I would like to keep the scan interval to 30 secs and no logs by default.
I have noticed that vsec has an option to debug. Perhaps that is enough for troubleshooting purposes.
Anyway thanks.
- Mark as New
- Bookmark
- Subscribe
- Mute
- Subscribe to RSS Feed
- Permalink
- Report Inappropriate Content
Hello,
Were you able to solve your problem?
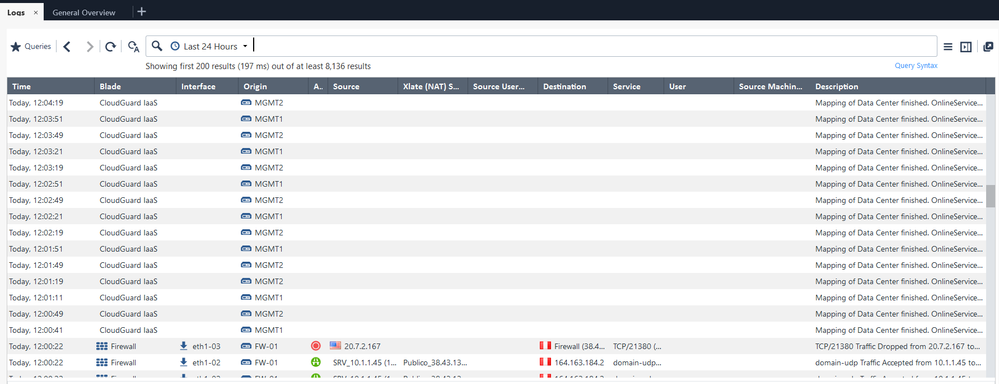
I am having the same problem, I can no longer see the traffic logs, as I am currently "flooded" with messages "Mapping of data center....".
It's just not that easy anymore to check the important traffic logs in the management console.
I have a SMS in version R81.10 with Take 110.
Any way to fix this?
Regards.
- Mark as New
- Bookmark
- Subscribe
- Mute
- Subscribe to RSS Feed
- Permalink
- Report Inappropriate Content
Are these the only logs you receive?
When you filter them out do you see other logs, for example a connection you initiated to the Security Gateway?
- Mark as New
- Bookmark
- Subscribe
- Mute
- Subscribe to RSS Feed
- Permalink
- Report Inappropriate Content
Hello,
It is being a bit "uncomfortable" these registrations.
Real traffic logs are appearing only for "moments", but we are being "flooded" by the "Mapping of ......" log.
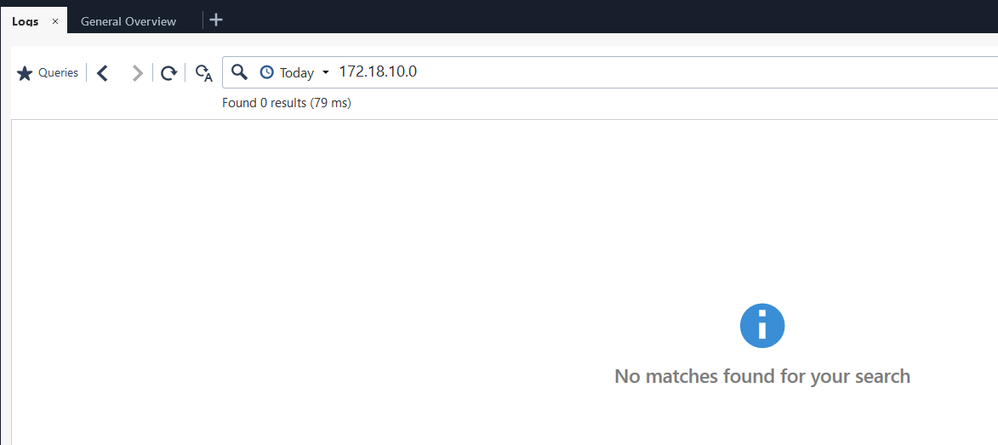
If I try to filter out a particular IP that is actually generating traffic on our GW, well, it just doesn't show up.
Greetings.
- Mark as New
- Bookmark
- Subscribe
- Mute
- Subscribe to RSS Feed
- Permalink
- Report Inappropriate Content
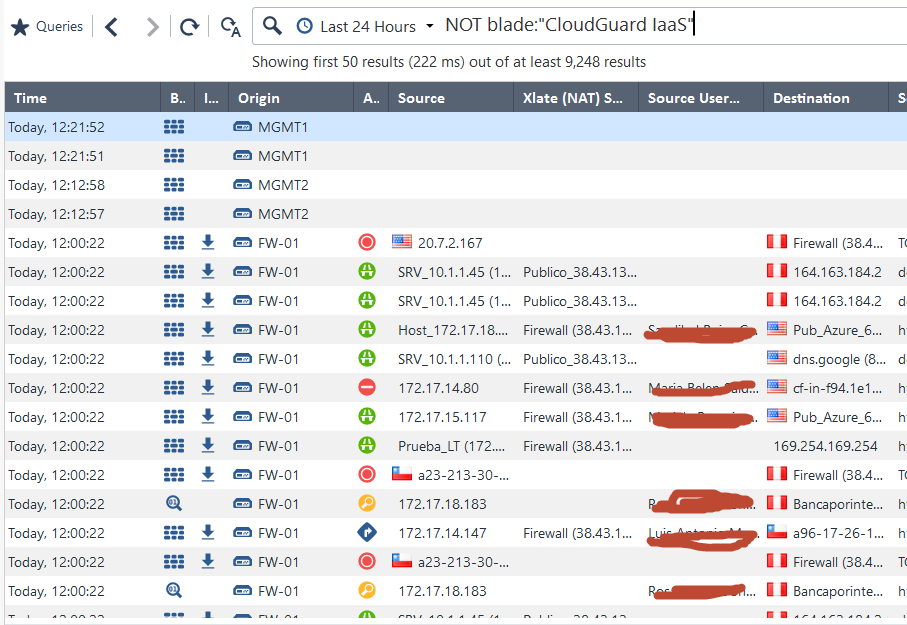
As a workaround you can also filter out the Blade for CloudGuard IaaS:
NOT blade:"CloudGuard IaaS"
- Mark as New
- Bookmark
- Subscribe
- Mute
- Subscribe to RSS Feed
- Permalink
- Report Inappropriate Content
More logs are visible, but it is not very "comfortable" to apply this filter, in order to be able to have a clearer view of the logs that really matter.
Is there any solution nowadays to avoid this kind of "Mapping....." logs?
- Mark as New
- Bookmark
- Subscribe
- Mute
- Subscribe to RSS Feed
- Permalink
- Report Inappropriate Content
BTW, are you using Data Center objects or a Generic Data Center object?
@Amir_Senn What do you think?
- Mark as New
- Bookmark
- Subscribe
- Mute
- Subscribe to RSS Feed
- Permalink
- Report Inappropriate Content
The number of logs for "CloudGuard IaaS" is insignificant comparing to the number of logs from traffic.
From what I can see the issue is they are presented before the traffic logs. The logs view shows the logs from newest to oldest, so according to that I assume that the clock of your management server is slightly ahead of the FW-01 clock. I suggest using NTP service to keep them aligned at all time.
If this is not the case I suggest creating constant filter by right clicking query line -> Add constant filter
Kind regards, Amir Senn
Leaderboard
Epsum factorial non deposit quid pro quo hic escorol.
| User | Count |
|---|---|
| 8 | |
| 8 | |
| 4 | |
| 3 | |
| 3 | |
| 3 | |
| 2 | |
| 2 | |
| 2 | |
| 2 |
Upcoming Events
Tue 28 Apr 2026 @ 06:00 PM (IDT)
Under the Hood: Securing your GenAI-enabled Web Applications with Check Point WAFTue 28 Apr 2026 @ 06:00 PM (IDT)
Under the Hood: Securing your GenAI-enabled Web Applications with Check Point WAFTue 12 May 2026 @ 10:00 AM (CEST)
The Cloud Architects Series: Check Point Cloud Firewall delivered as a serviceThu 30 Apr 2026 @ 03:00 PM (PDT)
Hillsboro, OR: Securing The AI Transformation and Exposure ManagementAbout CheckMates
Learn Check Point
Advanced Learning
YOU DESERVE THE BEST SECURITY
©1994-2026 Check Point Software Technologies Ltd. All rights reserved.
Copyright
Privacy Policy
About Us
UserCenter


