Create a Post
cancel
Showing results for 
Search instead for 
Did you mean: 
Wang
Collaborator

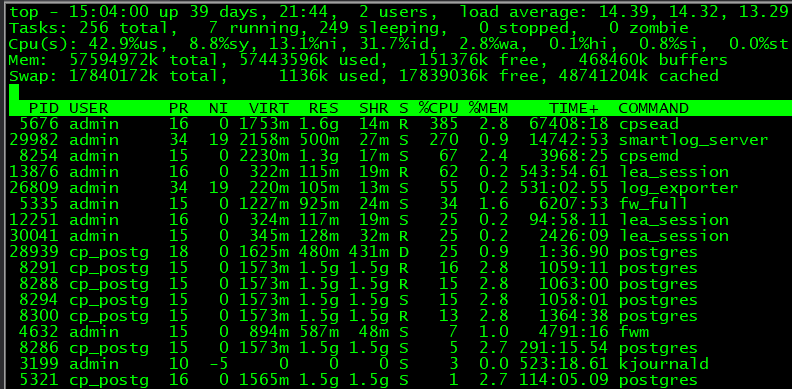
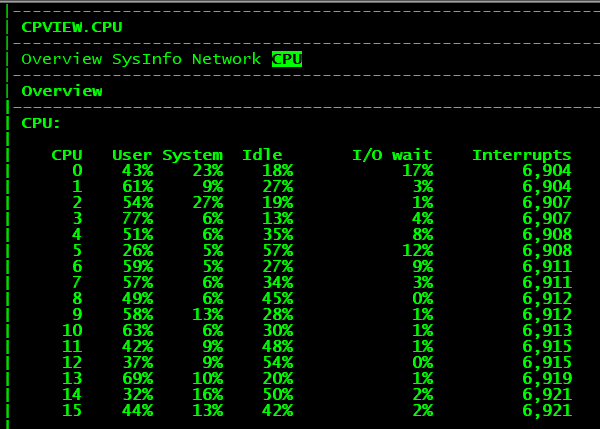
The CPU of the management platform often exceeds 70%, which happens several times a day

Hi,all

Can any of the engineers help solve this problem?Thank you very much!

微信图片_20190410110322.png微信图片_20190410110331.png微信图片_20190410110336.png

0 Kudos
6 Replies
Maarten_Sjouw
Champion
Champion

Looking at the cpview screenshot this must be R77.20 or lower?
The text next to that screenshot seems to come from a monitoring system, the first thing you need to do is set threshold there to 90% instead of 70%.
That your Gateway runs above 70% load on CPu's is nothing special, what you should look at is why this started, did you recently:

  • Upgrade the internet connection
  • Start using Office365 or any other cloud service 

Does the monitoring system have graphs to show the load over time? If so can you see how the load increased, was it a quick jump at the moment that the line upgrade was done or was it a steady growth?


First advice: Upgrade the setup to R80.20 as soon as you can (if the hardware supports it).

If not possible at least go to R77.30 as this will give you a lot better options to tune the performance.

Even though these linked documents are about R80 a lot of these things can still be used on R77.30 as well.


Regards, Maarten
0 Kudos
Wang
Collaborator

This is the R77.30 system
0 Kudos
Maarten_Sjouw
Champion
Champion

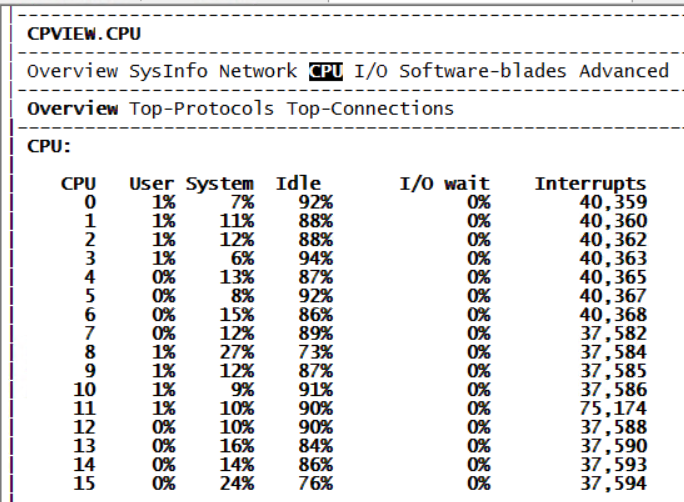
That is weird as this is what I see in R77.30 cpview:

Cpview.PNG

This is the version of cpview I have on a R77.30  system with jumbo take 345. I also checked on a gateway without any jumbo and this only does not show the I/O in the menu, but further looks the same as the above. Yours really looks like a R77.20 cpview.


The main difference in what I see on your screenshot and mine is in the I/O wait column.

You should look at the interfaces, if you see any errors there as well. In the Network page go to Interfaces and then Traffic, now scroll down (down arrow) until you see the error page. 

Regards, Maarten
0 Kudos
Adam_Zidiker
Employee Alumnus
Employee Alumnus

Hey Maarten

The reason you got confused is that CPView have more menus on GW
But what Wang showed us is screen from CPView on MGMT which have fewer menus
You're both running R77.30, but Wang is running a clean or older jumbo of R77.30 since it's missing the I/O menu (which was added for both GW and MGMT)

0 Kudos
Timothy_Hall
Legend Legend
Legend

All the processes that are busy on your SMS have to do with correlating and indexing logs.  What is your indexed log rate?  What are the hardware/memory specs of your SMS?

Run these commands and post the results (not all of them may work on R77.30):

cpstat mg -f log_server

cpstat ls -f logging

$RTDIR/scripts/doctor-log.sh -f

If those don't work on your version, see this: sk88681: How to calculate/count the total amount of FireWall Logs per second that arrive to Security...

Based on the presence of multiple lea_session daemons it would appear the logs are also being exported to some third party product as well.  Depending on your logging rate, you may need to separate the log indexing/correlation/exporting from your SMS to a separate SmartEvent box.


Gateway Performance Optimization R81.20 Course
now available at maxpowerfirewalls.com
0 Kudos
Wang
Collaborator

Thank you very much
0 Kudos

Leaderboard

Epsum factorial non deposit quid pro quo hic escorol.

Upcoming Events

    CheckMates Events