- Products
- Learn
- Local User Groups
- Partners
- More

This website uses Cookies. Click Accept to agree to our website's cookie use as described in our Privacy Policy. Click Preferences to customize your cookie settings.
- Products
- Learn
- Local User Groups
- Upcoming Events
- Americas
- EMEA
- Czech Republic and Slovakia
- Denmark
- Netherlands
- Germany
- Sweden
- United Kingdom and Ireland
- France
- Spain
- Norway
- Ukraine
- Baltics and Finland
- Greece
- Portugal
- Austria
- Kazakhstan and CIS
- Switzerland
- Romania
- Turkey
- Belarus
- Belgium & Luxembourg
- Russia
- Poland
- Georgia
- DACH - Germany, Austria and Switzerland
- Iberia
- Africa
- Adriatics Region
- Eastern Africa
- Israel
- Nordics
- Middle East and Africa
- Balkans
- Italy
- Bulgaria
- Cyprus
- APAC
- Partners
- More
- ABOUT CHECKMATES & FAQ
- Sign In
- Leaderboard
- Events
On-Premise SD-WAN Management
Register HereWhat's New in R82.10?
Watch Here AI Security Masters E8:
Claude Mythos: New Era in Cyber Security
CheckMates Go:
The Moment Before
Turn on suggestions
Auto-suggest helps you quickly narrow down your search results by suggesting possible matches as you type.
Showing results for
- CheckMates
- :
- Products
- :
- General Topics
- :
- Re: Physical memory is high
Options
- Subscribe to RSS Feed
- Mark Topic as New
- Mark Topic as Read
- Float this Topic for Current User
- Bookmark
- Subscribe
- Mute
- Printer Friendly Page
Turn on suggestions
Auto-suggest helps you quickly narrow down your search results by suggesting possible matches as you type.
Showing results for
Are you a member of CheckMates?
×
Sign in with your Check Point UserCenter/PartnerMap account to access more great content and get a chance to win some Apple AirPods! If you don't have an account, create one now for free!
- Mark as New
- Bookmark
- Subscribe
- Mute
- Subscribe to RSS Feed
- Permalink
- Report Inappropriate Content
Jump to solution
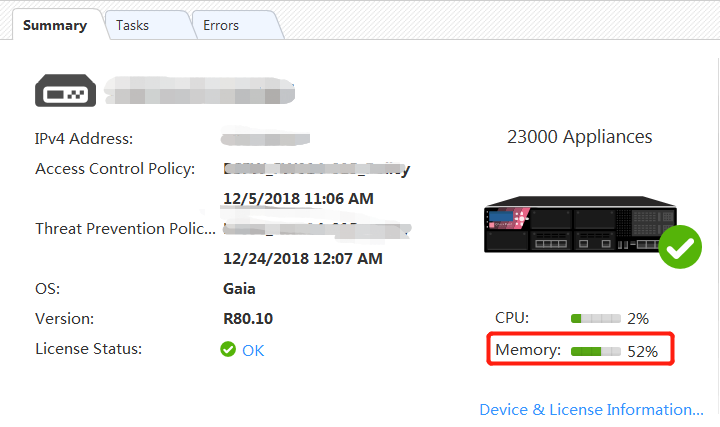
Physical memory is high
Dear all
My CP23500 is 16G memory and traffic is low.
but memory is high,as follow:
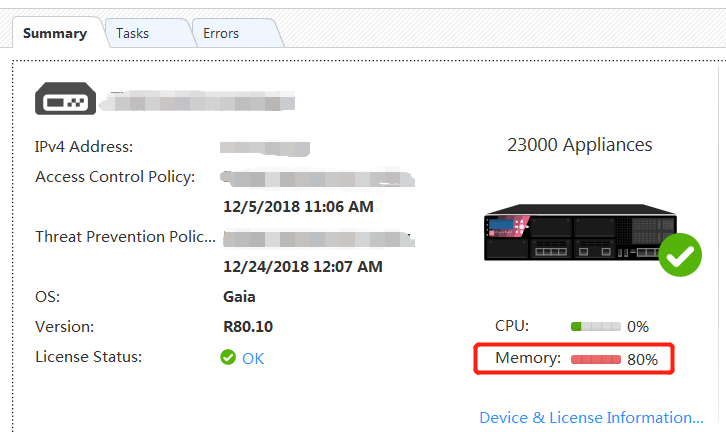
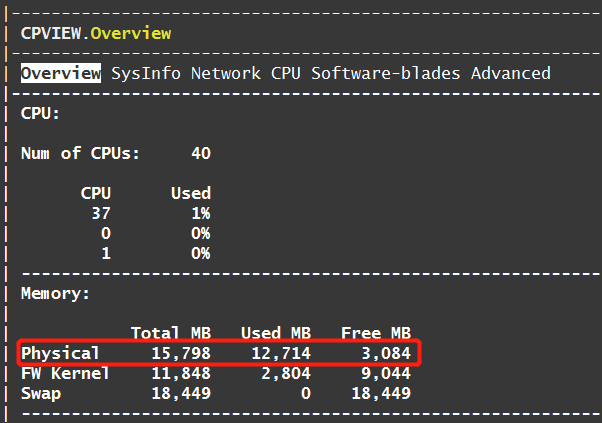
This is why?Thanks!
1 Solution
Accepted Solutions
- Mark as New
- Bookmark
- Subscribe
- Mute
- Subscribe to RSS Feed
- Permalink
- Report Inappropriate Content
Second that, there is nothing wrong here. We rely on OS "mem" command to show physical memory utilization. That command with 2.6 kernel it is known to report more than FW really needs as being used. That is normal and should not be causing any alarm unless you start swapping.
24 Replies
- Mark as New
- Bookmark
- Subscribe
- Mute
- Subscribe to RSS Feed
- Permalink
- Report Inappropriate Content
Hi,
post commands from expert mode:
free -mt
enabled_blades
fw ctl multik stat
- Mark as New
- Bookmark
- Subscribe
- Mute
- Subscribe to RSS Feed
- Permalink
- Report Inappropriate Content
Hi
as follow:
[Expert@FW001:0]# free -mt
total used free shared buffers cached
Mem: 15798 14666 1131 0 394 1577
-/+ buffers/cache: 12695 3103
Swap: 18449 0 18449
Total: 34247 14667 19580
[Expert@FW001:0]# enabled_blades
fw urlf av appi ips anti_bot mon
[Expert@FW001:0]# fw ctl multik stat
ID | Active | CPU | Connections | Peak
----------------------------------------------
0 | Yes | 39 | 54 | 6345
1 | Yes | 19 | 62 | 5343
2 | Yes | 38 | 58 | 6763
3 | Yes | 18 | 47 | 5993
4 | Yes | 37 | 61 | 6299
5 | Yes | 17 | 50 | 6063
6 | Yes | 36 | 50 | 5943
7 | Yes | 16 | 61 | 6050
8 | Yes | 35 | 41 | 5736
9 | Yes | 15 | 49 | 6165
10 | Yes | 34 | 43 | 6287
11 | Yes | 14 | 56 | 6063
12 | Yes | 33 | 64 | 5961
13 | Yes | 13 | 57 | 5984
14 | Yes | 32 | 52 | 6067
15 | Yes | 12 | 56 | 5965
16 | Yes | 31 | 55 | 6024
17 | Yes | 11 | 54 | 5940
18 | Yes | 30 | 55 | 5516
19 | Yes | 10 | 45 | 6514
20 | Yes | 29 | 54 | 6390
21 | Yes | 9 | 53 | 6043
22 | Yes | 28 | 45 | 6093
23 | Yes | 8 | 51 | 6032
24 | Yes | 27 | 43 | 5962
25 | Yes | 7 | 46 | 6119
26 | Yes | 26 | 36 | 5992
27 | Yes | 6 | 46 | 5822
28 | Yes | 25 | 55 | 6363
29 | Yes | 5 | 45 | 5815
30 | Yes | 24 | 55 | 6337
31 | Yes | 4 | 58 | 6125
32 | Yes | 23 | 62 | 6111
33 | Yes | 3 | 50 | 6125
34 | Yes | 22 | 58 | 6083
35 | Yes | 2 | 61 | 5984
- Mark as New
- Bookmark
- Subscribe
- Mute
- Subscribe to RSS Feed
- Permalink
- Report Inappropriate Content
I assume there is nothing wrong, you are using a lot of NG blades which consumes memory. The real value of memory consumption without cache is 12695, 1577 is cached and can be freed any time.
- Mark as New
- Bookmark
- Subscribe
- Mute
- Subscribe to RSS Feed
- Permalink
- Report Inappropriate Content
Second that, there is nothing wrong here. We rely on OS "mem" command to show physical memory utilization. That command with 2.6 kernel it is known to report more than FW really needs as being used. That is normal and should not be causing any alarm unless you start swapping.
- Mark as New
- Bookmark
- Subscribe
- Mute
- Subscribe to RSS Feed
- Permalink
- Report Inappropriate Content
Agree with Val, as long as second number on the Swap line is 0 everything is running completely within RAM and there is no need for paging/swapping, so your system is running optimally from a memory perspective.
--
"IPS Immersion Training" Self-paced Video Class
Now Available at http://www.maxpowerfirewalls.com
New Book: "Max Power 2026" Coming Soon
Check Point Firewall Performance Optimization
Check Point Firewall Performance Optimization
- Mark as New
- Bookmark
- Subscribe
- Mute
- Subscribe to RSS Feed
- Permalink
- Report Inappropriate Content
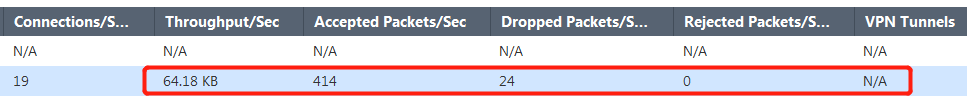
I have another firewall,still 23500(R80.10),their functions and policy are the same,and this fw traffic is higher,as follow:

But its memory is very low,as follow:
[Expert@FW002:0]# free -mt
total used free shared buffers cached
Mem: 15798 11985 3812 0 441 3278
-/+ buffers/cache: 8266 7531
Swap: 18449 0 18449
Total: 34247 11985 22261
[Expert@FW002:0]# enabled_blades
fw urlf av appi ips anti_bot mon
[Expert@FW002:0]#
[Expert@FW002:0]# fw ctl multik stat
ID | Active | CPU | Connections | Peak
----------------------------------------------
0 | Yes | 39 | 919 | 2617
1 | Yes | 19 | 957 | 2642
2 | Yes | 38 | 953 | 2706
3 | Yes | 18 | 936 | 2553
4 | Yes | 37 | 962 | 2692
5 | Yes | 17 | 917 | 2604
6 | Yes | 36 | 970 | 2635
7 | Yes | 16 | 972 | 2617
8 | Yes | 35 | 978 | 2663
9 | Yes | 15 | 993 | 2596
10 | Yes | 34 | 970 | 2646
11 | Yes | 14 | 980 | 2643
12 | Yes | 33 | 952 | 2640
13 | Yes | 13 | 1018 | 2731
14 | Yes | 32 | 928 | 2624
15 | Yes | 12 | 997 | 2647
16 | Yes | 31 | 962 | 2593
17 | Yes | 11 | 989 | 2609
18 | Yes | 30 | 922 | 2512
19 | Yes | 10 | 884 | 2576
20 | Yes | 29 | 1025 | 2652
21 | Yes | 9 | 1027 | 2754
22 | Yes | 28 | 1071 | 2733
23 | Yes | 8 | 987 | 2633
24 | Yes | 27 | 927 | 2714
25 | Yes | 7 | 1015 | 2651
26 | Yes | 26 | 1017 | 2619
27 | Yes | 6 | 1005 | 2652
28 | Yes | 25 | 1017 | 2651
29 | Yes | 5 | 899 | 2535
30 | Yes | 24 | 1063 | 2791
31 | Yes | 4 | 1043 | 2670
32 | Yes | 23 | 979 | 2751
33 | Yes | 3 | 947 | 2766
34 | Yes | 22 | 988 | 2657
35 | Yes | 2 | 931 | 2679
So,I'm a little confused.
- Mark as New
- Bookmark
- Subscribe
- Mute
- Subscribe to RSS Feed
- Permalink
- Report Inappropriate Content
As said, you can ignore mem output and free memory at all, unless start swapping.
- Mark as New
- Bookmark
- Subscribe
- Mute
- Subscribe to RSS Feed
- Permalink
- Report Inappropriate Content
I got it,thanks all!
- Mark as New
- Bookmark
- Subscribe
- Mute
- Subscribe to RSS Feed
- Permalink
- Report Inappropriate Content
what is the solution???
- Mark as New
- Bookmark
- Subscribe
- Mute
- Subscribe to RSS Feed
- Permalink
- Report Inappropriate Content
The best solution is to not care about it until you see the Swap memory Used increase above 0.
Regards, Maarten
- Mark as New
- Bookmark
- Subscribe
- Mute
- Subscribe to RSS Feed
- Permalink
- Report Inappropriate Content
As long as you're not swapping, there's nothing to solve.
If you are swapping, post output of some of the commands here and we can have a look.
If you are swapping, post output of some of the commands here and we can have a look.
- Mark as New
- Bookmark
- Subscribe
- Mute
- Subscribe to RSS Feed
- Permalink
- Report Inappropriate Content
- Mark as New
- Bookmark
- Subscribe
- Mute
- Subscribe to RSS Feed
- Permalink
- Report Inappropriate Content
Yes, the second number on the swap line is zero so your firewall is completely executing in RAM and there is no swapping to disk.
Based on the output, of the available 16GB of RAM your firewall is using 12621 for code execution, 3228 for buffering and caching (this memory can be reallocated for code execution if necessary) and 650 free. So you still have 3878 available for code execution if needed.
New Book: "Max Power 2026" Coming Soon
Check Point Firewall Performance Optimization
Check Point Firewall Performance Optimization
- Mark as New
- Bookmark
- Subscribe
- Mute
- Subscribe to RSS Feed
- Permalink
- Report Inappropriate Content
Do you have the latest hotfix installed?
- Mark as New
- Bookmark
- Subscribe
- Mute
- Subscribe to RSS Feed
- Permalink
- Report Inappropriate Content
No,hotfix is take_56
- Mark as New
- Bookmark
- Subscribe
- Mute
- Subscribe to RSS Feed
- Permalink
- Report Inappropriate Content
when issuing the command enabled_blades, clearly this tells us what blades are in use, however is there a way to determine how much memory / resource each blade is actually using?
I have a similar concern regarding memory usage; currently have 64GB of RAM and 40GB is already used. After a reboot this drops to 16GB and then creeps up over two weeks. At this point the concern is low as the swap file is not hit, but I do have two VS's that I'm going to adding the VSX system which have roughly 80,000 concurrent connections each, so have a real concern this is going to put me in a high memory usage scenario.
I suspect a memory leak as I don't see memory being released after core hours.
We are running the following blades:
IPS/AV/ABOT/URLF/FW/Content_Awareness and Monitor.
- Mark as New
- Bookmark
- Subscribe
- Mute
- Subscribe to RSS Feed
- Permalink
- Report Inappropriate Content
We are having the same issue. Looks like a memory leak. We have a smaller Gateway cluster with 16GB of ram. Gateway eventually crashes with errors in /var/log/messages related to memory exhaustion. TAC has is running a memory leak test. I jumped on the following thread where two others have/had a similar issue:
https://community.checkpoint.com/t5/General-Topics/Problem-with-5400-device-after-firmware-upgrade-t...
https://community.checkpoint.com/t5/General-Topics/Problem-with-5400-device-after-firmware-upgrade-t...
- Mark as New
- Bookmark
- Subscribe
- Mute
- Subscribe to RSS Feed
- Permalink
- Report Inappropriate Content
Please post output of free -m. The memory creep you are seeing is probably not a memory leak, but free memory being utilized for buffering and caching. This buffering/caching memory use will drop back down after a reboot then slowly grow again which is expected.
New Book: "Max Power 2026" Coming Soon
Check Point Firewall Performance Optimization
Check Point Firewall Performance Optimization
- Mark as New
- Bookmark
- Subscribe
- Mute
- Subscribe to RSS Feed
- Permalink
- Report Inappropriate Content
Hi Timothy,
The hardware is a pair of 15600's with 64GB RAM (MAX), with R80.20 HFA103. Additionally these appliances are running as VSX appliances with 5 active Virtual systems. The following blades are enabled:
fw urlf av appi ips anti_bot content_awareness mon
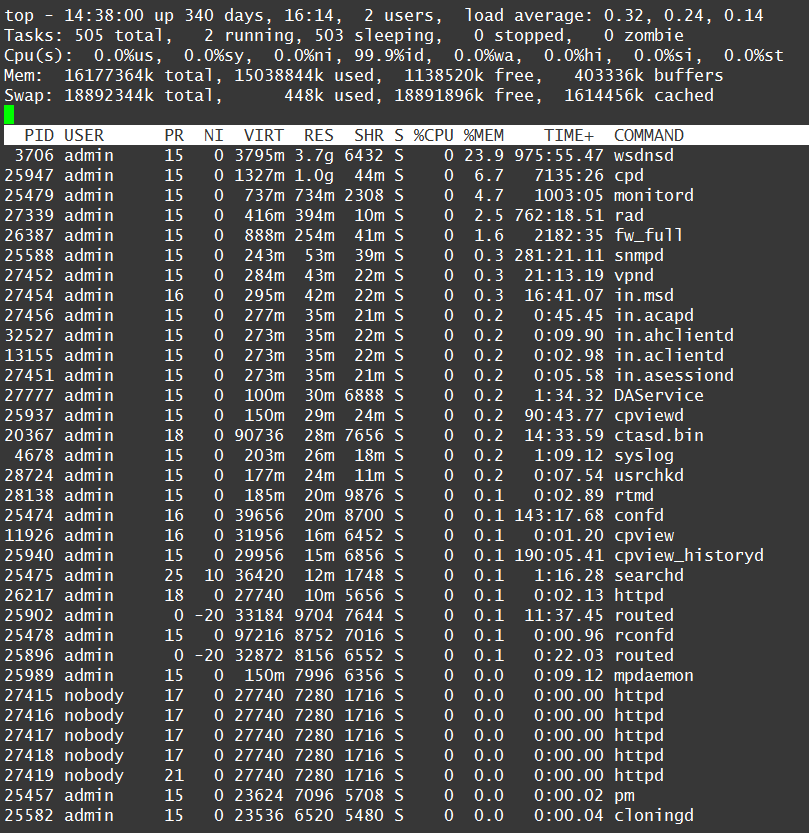
Top output:
Tasks: 594 total, 1 running, 593 sleeping, 0 stopped, 0 zombie
Cpu(s): 4.0%us, 1.0%sy, 0.0%ni, 94.4%id, 0.1%wa, 0.0%hi, 0.5%si, 0.0%st
Mem: 65747304k total, 40054152k used, 25693152k free, 1965852k buffers
Swap: 33551672k total, 0k used, 33551672k free, 21309224k cached
Clearly above we see no swap being hit.
Uptime:
08:09:03 up 16 days, 11:37, 1 user, load average: 3.44, 3.29, 3.14
But we also see that the uptime is 16 days, initial memory utilisation was around 16GB after reboot.
free -m
total used free shared buffers cached
Mem: 64206 39177 25028 0 1919 20863
-/+ buffers/cache: 16394 47811
Swap: 32765 0 32765
We have at least another 2 virtual systems to implement, assume that each VS will run around 100,000 concurrent connections (200,000 total).
So my concern here is we will not have enough resource to handle this. Additionally I do not see any memory release out side of peak ours when the concurrent connections across all the VS's drop. I would have though that memory should be released.
- Mark as New
- Bookmark
- Subscribe
- Mute
- Subscribe to RSS Feed
- Permalink
- Report Inappropriate Content
Of your 64GB total RAM only 16394 is currently being utilized for code execution, 1919+20863=22782 is being used for buffering/caching of disk operations, and 25028 is completely free/unused. (16394+22782+25028=64204) So in reality your firewall is currently using only about 25% of RAM for code execution (16394), leaving 75% of RAM (47810) available for future VS execution.
Looks like you have plenty of available memory for some more VSs to me. If you see the memory usage creeping up over time, it is almost certainly being allocated for buffering/caching; that memory can be instantly freed up for code execution if needed at any time.
New Book: "Max Power 2026" Coming Soon
Check Point Firewall Performance Optimization
Check Point Firewall Performance Optimization
- Mark as New
- Bookmark
- Subscribe
- Mute
- Subscribe to RSS Feed
- Permalink
- Report Inappropriate Content
Thanks!
- Mark as New
- Bookmark
- Subscribe
- Mute
- Subscribe to RSS Feed
- Permalink
- Report Inappropriate Content
Hi,
I've read all ths posts, but in my situation, I have an amount of swap memory in use, should I get worried then?
free -mt
total used free shared buff/cache available
Mem: 64367 21598 485 1248 42282 40743
Swap: 67593 445 67148
Total: 131961 22043 67634
enabled_blades
N/A - failed to match an object to SIC name! (This is an MDS with 3 Domains created an receiving logs from 4 clusters [8 firewalls])
fw ctl multik stat
Local host is not a FireWall-1 module (Same situation, it is an MDS)
There're some specific commands for me to use in order to troubleshoot better this situation within an MDS?
I'm using Gaia R80.20 with JHF 141 as follows:
This is Check Point CPinfo Build 914000202 for GAIA
[CPFC]
HOTFIX_R80_20_JUMBO_HF_MAIN Take: 141
[IDA]
No hotfixes..
[MGMT]
HOTFIX_R80_20_JUMBO_HF_MAIN Take: 141
[FW1]
HOTFIX_R80_20_JUMBO_HF_MAIN Take: 141
If this is a normal situation also, how can we monitor real memory issues to be proactive in case of problems? it's possible to monitor for low available memory instead? Make any sense?
Thanks,
Benjamim Sequeira
- Mark as New
- Bookmark
- Subscribe
- Mute
- Subscribe to RSS Feed
- Permalink
- Report Inappropriate Content
On a gateway, swap can be problematic.
On management, this is a little more normal.
On management, this is a little more normal.
- Mark as New
- Bookmark
- Subscribe
- Mute
- Subscribe to RSS Feed
- Permalink
- Report Inappropriate Content
You have plenty of available memory as far as I can see. The high amount of swap is because there are inactive regions of memory that were swapped out to have memory ready and available.
This can be controlled by tuning vm.swappiness kernel parameter that is set too high for servers by default. My personal opinion is that it shall be set to something like 20 or even 10.
Leaderboard
Epsum factorial non deposit quid pro quo hic escorol.
| User | Count |
|---|---|
| 12 | |
| 10 | |
| 4 | |
| 4 | |
| 4 | |
| 2 | |
| 2 | |
| 1 | |
| 1 | |
| 1 |
Upcoming Events
Tue 28 Jul 2026 @ 11:00 AM (EDT)
Under the Hood - Check Point and Illumio – Modern Network Defense Against AI-Based ThreatsThu 30 Jul 2026 @ 10:00 AM (PDT)
AI Security Masters E12: READY OR NOT: Securing the AI Enterprise 4/5 - AI GatewayThu 20 Aug 2026 @ 10:00 AM (PDT)
AI Security Masters E13: READY OR NOT: Securing the AI Ent 5/5 - AI Research & Threat LandscapeTue 28 Jul 2026 @ 11:00 AM (EDT)
Under the Hood - Check Point and Illumio – Modern Network Defense Against AI-Based ThreatsThu 30 Jul 2026 @ 10:00 AM (PDT)
AI Security Masters E12: READY OR NOT: Securing the AI Enterprise 4/5 - AI GatewayThu 20 Aug 2026 @ 10:00 AM (PDT)
AI Security Masters E13: READY OR NOT: Securing the AI Ent 5/5 - AI Research & Threat LandscapeAbout CheckMates
Learn Check Point
Advanced Learning
YOU DESERVE THE BEST SECURITY

©1994-2026 Check Point Software Technologies Ltd. All rights reserved.
Copyright
Privacy Policy
About Us
UserCenter