- Products
Network & SASE IoT Protect Maestro Management OpenTelemetry/Skyline Remote Access VPN SASE SD-WAN Security Gateways SmartMove Smart-1 Cloud SMB Gateways (Spark) Threat PreventionCloud Cloud Network Security CloudMates General CloudGuard - WAF Talking Cloud Podcast Weekly ReportsSecurity Operations Events External Risk Management Incident Response Infinity AI Infinity Portal NDR Playblocks SOC XDR/XPR Threat Exposure Management
- Learn
- Local User Groups
- Partners
- More

This website uses Cookies. Click Accept to agree to our website's cookie use as described in our Privacy Policy. Click Preferences to customize your cookie settings.
- Products
- AI Security
- Developers & More
- Check Point Trivia
- CheckMates Toolbox
- General Topics
- Products Announcements
- Threat Prevention Blog
- Upcoming Events
- Americas
- EMEA
- Czech Republic and Slovakia
- Denmark
- Netherlands
- Germany
- Sweden
- United Kingdom and Ireland
- France
- Spain
- Norway
- Ukraine
- Baltics and Finland
- Greece
- Portugal
- Austria
- Kazakhstan and CIS
- Switzerland
- Romania
- Turkey
- Belarus
- Belgium & Luxembourg
- Russia
- Poland
- Georgia
- DACH - Germany, Austria and Switzerland
- Iberia
- Africa
- Adriatics Region
- Eastern Africa
- Israel
- Nordics
- Middle East and Africa
- Balkans
- Italy
- Bulgaria
- Cyprus
- APAC
AI Security Masters
E1: How AI is Reshaping Our World
MVP 2026: Submissions
Are Now Open!
What's New in R82.10?
Watch NowOverlap in Security Validation
Help us to understand your needs better
CheckMates Go:
Maestro Madness
Turn on suggestions
Auto-suggest helps you quickly narrow down your search results by suggesting possible matches as you type.
Showing results for
- CheckMates
- :
- Products
- :
- General Topics
- :
- My Top 3 Check Point CLI commands
Options
- Subscribe to RSS Feed
- Mark Topic as New
- Mark Topic as Read
- Float this Topic for Current User
- Bookmark
- Subscribe
- Mute
- Printer Friendly Page
Turn on suggestions
Auto-suggest helps you quickly narrow down your search results by suggesting possible matches as you type.
Showing results for
Are you a member of CheckMates?
×
Sign in with your Check Point UserCenter/PartnerMap account to access more great content and get a chance to win some Apple AirPods! If you don't have an account, create one now for free!
- Mark as New
- Bookmark
- Subscribe
- Mute
- Subscribe to RSS Feed
- Permalink
- Report Inappropriate Content
My Top 3 Check Point CLI commands
Just had a fun geeky conversation with Dameon Welch Abernathy (AKA Phoneboy) Jony Fischbein , Jeff Schwartz and Michael Poublon (over 100 accumulated years of experience in Check Point products) , on what are our favorite & most useful commands in a Check Point environment.
Below are my 3 , plz add yours in the comments (we will do a poll for the top 5 after getting your feedback ... ).
1) fw ctl zdebug drop
used to quickly see all dropped connections and more importantly the reason (e.g. anti-spoofing, IPS , FW rule , ....)
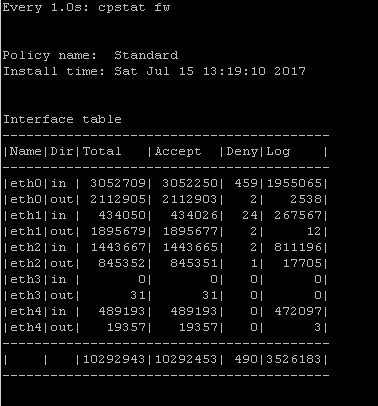
2) cpstat fw
quickly see stats of number of connections (accepted,denied,logged) with a breakdown
if the FW was under a high load i would usually run " watch --interval=1 'cpstat fw' " (would see a real-time to see the interface that is causing this)
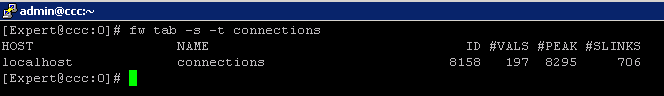
3) fw tab -s -t connections
allowed me to quickly see how much load is (and was i.e "peak" ) on the FW
that's it (i have more , but i want to hear yours ...)
plz add yours in the comments (we will do a poll for the top 5 after getting your feedback ... )
195 Replies
- Mark as New
- Bookmark
- Subscribe
- Mute
- Subscribe to RSS Feed
- Permalink
- Report Inappropriate Content
cpview
Because its just awsome.
cphaprob state (with all its different options)
fw ctl zdebug drop
- Mark as New
- Bookmark
- Subscribe
- Mute
- Subscribe to RSS Feed
- Permalink
- Report Inappropriate Content
tcpdump - just a versatile tool
fw ctl debug drop | grep
cphaprob -a if
- Mark as New
- Bookmark
- Subscribe
- Mute
- Subscribe to RSS Feed
- Permalink
- Report Inappropriate Content
oh, seems I've missed that topic year ago ... ![]()
every day usage of following:
watch --interval=1 'cpstat fw'
watch cphaprob stat
clusterXL_admin down -p
vsx stat - l
cphaprob -a if
clish> show routed cluster-state detailed
fw ctl affinity -l -v -r
fw ctl zdebug drop
fwaccel stats -s
fw tab -s -t connections
watch fw tab -s -t connections
curl_cli -v -k https://updates.checkpoint.com/
fw monitor -e "host(x.y.z.w) and host(a.b.c.d), accept;"
tcptraceroute -4 -T -p 80 a.b.c.d
and obviously ntpq -pn ![]() when we know time is precious
when we know time is precious 
Yours
Jerry
- Mark as New
- Bookmark
- Subscribe
- Mute
- Subscribe to RSS Feed
- Permalink
- Report Inappropriate Content
Despite having been started more than a year ago, this thread by far garners the most views of any thread on CheckMates to date.
It shows no signs of slowing down ![]()
- Mark as New
- Bookmark
- Subscribe
- Mute
- Subscribe to RSS Feed
- Permalink
- Report Inappropriate Content
yes mate, indeed it looks awesome also viewing your recent CPX '18 Youtube 25min. video ![]()
well done Dameon! keep it going same way and well done to all of YOU (US) contributors!
cheerio
Jerry
- Mark as New
- Bookmark
- Subscribe
- Mute
- Subscribe to RSS Feed
- Permalink
- Report Inappropriate Content
... and OBVIOUSLY in notorious way - awesome and only CPVIEW ![]()
Jerry
- Mark as New
- Bookmark
- Subscribe
- Mute
- Subscribe to RSS Feed
- Permalink
- Report Inappropriate Content
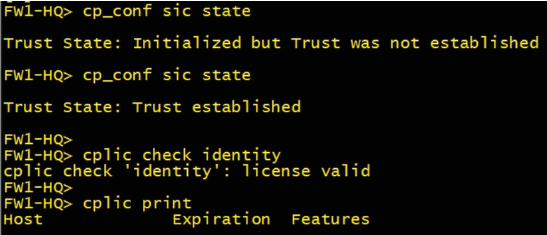
Check SIC & license status at GWY
- cp_conf sic state
- cplic check identity
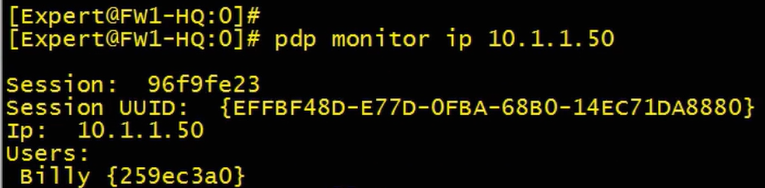
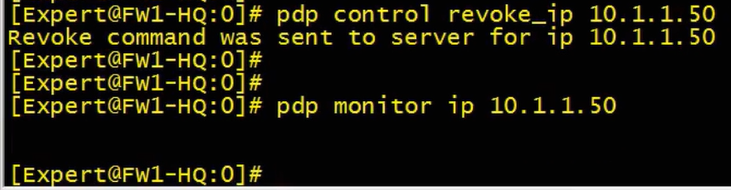
Check identity awareness at GWY (in expert mode)
- pdp monitor client_type portal (show everyone who is authenticated via captive portal)
- pdp monitor ip 10.1.1.50 (same as above but for a specific IP/user)
- pdp control revoke_ip 10.1.1.50
- Mark as New
- Bookmark
- Subscribe
- Mute
- Subscribe to RSS Feed
- Permalink
- Report Inappropriate Content
Zombie thread alert !
We are doing things with snmp and the cp_conf sic state is this OID 1.3.6.1.4.1.2620.1.1.12.0
2 = Trusted
- Mark as New
- Bookmark
- Subscribe
- Mute
- Subscribe to RSS Feed
- Permalink
- Report Inappropriate Content
tcpdump
cphaprob -a if
show cluster stats - a nice new one
Better late then never
- Mark as New
- Bookmark
- Subscribe
- Mute
- Subscribe to RSS Feed
- Permalink
- Report Inappropriate Content
LOL.
- Mark as New
- Bookmark
- Subscribe
- Mute
- Subscribe to RSS Feed
- Permalink
- Report Inappropriate Content
Also to see which traffic is matched on what rule(s) you can use (in R80):
Example:
fw up_execute src=x.x.x.x dst=y.y.y.y ipp=17 dport=53 (run in expert mode)
Rulebase execution ended successfully.
Overall status:
----------------
Active clob mask: 0
Required clob mask: 0
Match status: MATCH
Match action: Accept
Per Layer:
------------
Layer name: NAME
Layer id: 0
Match status: MATCH
Match action: Accept
Matched rule: 14
Possible rules: 14 18 19 16777215
Have fun!
- Mark as New
- Bookmark
- Subscribe
- Mute
- Subscribe to RSS Feed
- Permalink
- Report Inappropriate Content
I like this command.
- Mark as New
- Bookmark
- Subscribe
- Mute
- Subscribe to RSS Feed
- Permalink
- Report Inappropriate Content
Thanks Timothy,
Yes, I agree that it indicates that I'm are running out of Hide NAT ports somewhere but I can't find any evidence that it's reaching the 50k limit or that it's for ports in the 60,001 to 65536 range. Traffic analysis on the external interface shows most connections are from source ports in the 30,000 to 39,999 range and the 40,000 to 49,999 range with peaks counts of 500 to 600 unique ports in each of those two ranges. I record no connections from source ports in the 20,000 to 29,999 range and only the odd one connection in the 50,000 -59,999 range which is always port 50,001. However, there does seem to be a correlation between the NAT hide logs and a flurry of connections in the 10,000 to 19,000 range. Ports in this range are only seen when the issue occurs.
The traffic analysis shows that large ranges of ports are never used which would suggest that the 50k limit is never reached and, as said earlier, each time I've run the fw tab -u -t connections | grep -ci command, the result stays under 10,000 connections. I don't think setting up a "many to fewer" hide NAT will do anything as the source is a single proxy IP and that NAT IP is dedicated to the Proxy IP and used only for one internet target IP.
Thanks again for your input - I didn't mean to hi-jack this thread/discussion with my issue. I'm going to try and escalate again through CheckPoint.
Matt.
- Mark as New
- Bookmark
- Subscribe
- Mute
- Subscribe to RSS Feed
- Permalink
- Report Inappropriate Content
fw ctl zdebug drop > drops.txt
cphaprob -a if
fw unloadlocal
cphaprob -a if
fw unloadlocal
- Mark as New
- Bookmark
- Subscribe
- Mute
- Subscribe to RSS Feed
- Permalink
- Report Inappropriate Content
cphaprob -a if
cpview
fw ctl zdebug + drop
- Mark as New
- Bookmark
- Subscribe
- Mute
- Subscribe to RSS Feed
- Permalink
- Report Inappropriate Content
My top CLI commands
Who using the most cpu
ps -eo pcpu,pid,user,args | sort -r -k1 | less
To remove a connection from the connection table
fw tab -t connections -u > table
IPA="1024"; IPB="1024"; IPAHEX=`printf '%02x' ${IPA//./ }`; IPBHEX=`printf '%02x' ${IPB//./ }`; grep "$IPAHEX" table | grep "$IPBHEX" | grep "^<0000000" | awk '{print $1" "$2" "$3" "$4" "$5" "$6}'|sed 's/ //g'|sed 's/</fw tab -t connections -x -e /g'|sed 's/>//g'|sed 's/;//g' > listall
cat listofall
fw tab -t connections -x -e 00000001,50a99963,000001f4,81231bc4,000001f4,00000011
fw tab -t connections -x -e 00000001,81231bc4,000001f4,50a99963,000001f4,00000011
fw tab -t connections -x -e 00000000,81231bc4,000001f4,50a99963,000001f4,00000011
fw tab -t connections -x -e 00000000,50a99963,000001f4,81231bc4,000001f4,00000011
Remote commands from CMA
`$CPDIR/bin/cprid_util -server $Firewall_IP -verbose rexec -rcmd /bin/clish -c
Identity Awareness
pdp monitor summary all
netstat -anp | grep wmic
pdp d rotate
adlog a d on
adlog a d extended
pdp debug on
pdp d s all all
adlog a control reconf;sleep 5;watch -n 1 -d "adlog a dc"
adlog a d off
pdp d unset all all
pdp d off
cat $FWDIR/log/pdpd.elg | grep -i
fw tab -t pdp_sessions -t pdp_super_sessions -t pdp_encryption_keys -t pdp_whitelist -t pdp_timers -t pdp_expired_timers -t pdp_ip -t pdp_net_reg -t pdp_net_db -t pdp_cluster_stat -t pep_pdp_db -t pep_networks_to_pdp_db -t pep_net_reg -t pep_reported_network_masks_db -t pep_port_range_db -t pep_async_id_calls -t pep_client_db -t pep_identity_index -t pep_revoked_key_clients -t pep_src_mapping_db -t pep_log_completion -x -y
fw kill pdpd
fw kill pepd
killing Zombies
To find a zombie process
ps aux | awk '"[Zz]" ~ $8 { printf("%s, PID = %d\n", $8, $2); }'
Kill a Zombie process run
kill -9 $(ps -A -ostat,ppid | grep -e '[zZ]'| awk '{ print $2 }')
running top again the counter for zombie should now be 0
My Top 3 Check Point CLI commands
Just had a fun geeky conversation with Dameon Welch Abernathy (AKA Phoneboy) Jony Fischbein , Jeff Schwartz and Michael Poublon (over 100 accumulated years of experience in Check Point products) , on what are our favorite & most useful commands in a Check Point environment.
Below are my 3 , plz add yours in the comments (we will do a poll for the top 5 after getting your feedback ... ).
1) fw ctl zdebug drop
used to quickly see all dropped connections and more importantly the reason (e.g. anti-spoofing, IPS , FW rule , ....)
2) cpstat fw
quickly see stats of number of connections (accepted,denied,logged) with a breakdown
if the FW was under a high load i would usually run " watch --interval=1 'cpstat fw' " (would see a real-time to see the interface that is causing this)

3) fw tab -s -t connections
allowed me to quickly see how much load is (and was i.e "peak" ) on the FW

that's it (i have more , but i want to hear yours ...)
plz add yours in the comments (we will do a poll for the top 5 after getting your feedback ... )
Leaderboard
Epsum factorial non deposit quid pro quo hic escorol.
| User | Count |
|---|---|
| 17 | |
| 10 | |
| 10 | |
| 8 | |
| 7 | |
| 3 | |
| 2 | |
| 2 | |
| 2 | |
| 2 |
Upcoming Events
Thu 18 Dec 2025 @ 10:00 AM (CET)
Cloud Architect Series - Building a Hybrid Mesh Security Strategy across cloudsThu 08 Jan 2026 @ 05:00 PM (CET)
AI Security Masters Session 1: How AI is Reshaping Our WorldThu 18 Dec 2025 @ 10:00 AM (CET)
Cloud Architect Series - Building a Hybrid Mesh Security Strategy across cloudsThu 08 Jan 2026 @ 05:00 PM (CET)
AI Security Masters Session 1: How AI is Reshaping Our WorldAbout CheckMates
Learn Check Point
Advanced Learning
YOU DESERVE THE BEST SECURITY
©1994-2025 Check Point Software Technologies Ltd. All rights reserved.
Copyright
Privacy Policy
About Us
UserCenter