- Products
- Learn
- Local User Groups
- Partners
- More

This website uses Cookies. Click Accept to agree to our website's cookie use as described in our Privacy Policy. Click Preferences to customize your cookie settings.
- Products
- Learn
- Local User Groups
- Upcoming Events
- Americas
- EMEA
- Czech Republic and Slovakia
- Denmark
- Netherlands
- Germany
- Sweden
- United Kingdom and Ireland
- France
- Spain
- Norway
- Ukraine
- Baltics and Finland
- Greece
- Portugal
- Austria
- Kazakhstan and CIS
- Switzerland
- Romania
- Turkey
- Belarus
- Belgium & Luxembourg
- Russia
- Poland
- Georgia
- DACH - Germany, Austria and Switzerland
- Iberia
- Africa
- Adriatics Region
- Eastern Africa
- Israel
- Nordics
- Middle East and Africa
- Balkans
- Italy
- Bulgaria
- Cyprus
- APAC
- Partners
- More
- ABOUT CHECKMATES & FAQ
- Sign In
- Leaderboard
- Events
On-Premise SD-WAN Management
Register HereWhat's New in R82.10?
Watch Here AI Security Masters E8:
Claude Mythos: New Era in Cyber Security
CheckMates Go:
The Moment Before
Turn on suggestions
Auto-suggest helps you quickly narrow down your search results by suggesting possible matches as you type.
Showing results for
- CheckMates
- :
- Products
- :
- General Topics
- :
- Re: My Top 3 Check Point CLI commands
Options
- Subscribe to RSS Feed
- Mark Topic as New
- Mark Topic as Read
- Float this Topic for Current User
- Bookmark
- Subscribe
- Mute
- Printer Friendly Page
Turn on suggestions
Auto-suggest helps you quickly narrow down your search results by suggesting possible matches as you type.
Showing results for
Are you a member of CheckMates?
×
Sign in with your Check Point UserCenter/PartnerMap account to access more great content and get a chance to win some Apple AirPods! If you don't have an account, create one now for free!
- Mark as New
- Bookmark
- Subscribe
- Mute
- Subscribe to RSS Feed
- Permalink
- Report Inappropriate Content
My Top 3 Check Point CLI commands
Just had a fun geeky conversation with Dameon Welch Abernathy (AKA Phoneboy) Jony Fischbein , Jeff Schwartz and Michael Poublon (over 100 accumulated years of experience in Check Point products) , on what are our favorite & most useful commands in a Check Point environment.
Below are my 3 , plz add yours in the comments (we will do a poll for the top 5 after getting your feedback ... ).
1) fw ctl zdebug drop
used to quickly see all dropped connections and more importantly the reason (e.g. anti-spoofing, IPS , FW rule , ....)
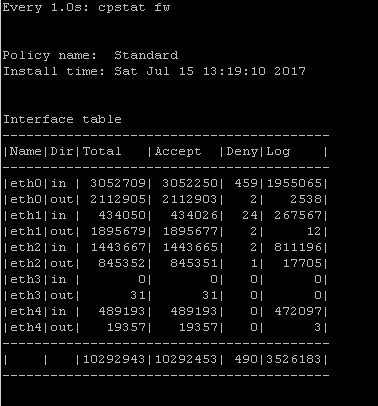
2) cpstat fw
quickly see stats of number of connections (accepted,denied,logged) with a breakdown
if the FW was under a high load i would usually run " watch --interval=1 'cpstat fw' " (would see a real-time to see the interface that is causing this)
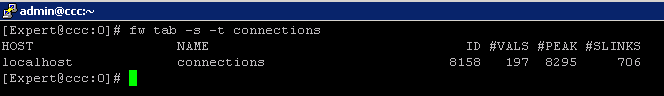
3) fw tab -s -t connections
allowed me to quickly see how much load is (and was i.e "peak" ) on the FW
that's it (i have more , but i want to hear yours ...)
plz add yours in the comments (we will do a poll for the top 5 after getting your feedback ... )
195 Replies
- Mark as New
- Bookmark
- Subscribe
- Mute
- Subscribe to RSS Feed
- Permalink
- Report Inappropriate Content
My list is super simple, but these are the good old tried and true commands I've used more times than I can count over the years.
fw stat. Number one go to just to see what the heck is going on. Is a policy loaded? When? Yeah, I just pushed, but did the firewall actually get it? And yes, I've seen a policy push and the firewall report an older version in state. Is it loaded on all the interfaces? Over the years, this has been the most consistent starting place when shooting a problem. Many interesting roads began with fw stat.
fw unloadlocal. Absolute life saver. This one has pulled my chestnuts from the fire on many occasions. Mostly to clear 18000 series port errors between management server and firewall, but highly useful on other occasions. And thank goodness for persistent ssh connections after a bad policy push! (Yeah, I know, it's not good to have a firewall sitting there without a policy, but when it's 2:00 a.m., "now" was five hours ago and there is nobody in the DC to kick the box if it doesn't come back... fw unloadlocal and move forward.)
cpstart/stop/restart. Another handy deal that didn't kill ssh sessions. I've been amazed how many times a simple boot has cleared things up. Often needed after doing heart surgery on various files, as well. Great for looking at which daemons and processes are coming up and then throwing a flag on the field. Clear elg files, cprestart and start fresh. Great way to see what's going wrong right now. Honestly, a pretty critical tool just for figuring out whether to continue shooting, back off a version or rebuild a gateway.
Honorable mentions:
I cannot walk away without mentioning fwm ike_reset - the mother of all VPN shooting bombs and fwm load [target - by freaking IP address!]. Yeah, yeah, API. But I miss fwm. It had certain powers that the API will never understand. And didn't always need objects to work. Nice sledge hammer. But, no more. Sad panda.
- Mark as New
- Bookmark
- Subscribe
- Mute
- Subscribe to RSS Feed
- Permalink
- Report Inappropriate Content
Tcpdump
fw ctl zdebug drop
cpview
fw ctl pstat
cphaprob stat / -a if/ -l list
- Mark as New
- Bookmark
- Subscribe
- Mute
- Subscribe to RSS Feed
- Permalink
- Report Inappropriate Content
We experienced long waiting times during making of snapshots on VSX systems, and also during CPUSE. The cause of all this was the existence of millions of zero-byte temporary files. CPUSE ran in a time-out since these files needed to be backupped first before installation of a Jumbo Hotfix continued.
Deleting these files manually with a variation of 'rm *' results in a "argument list too long" error message.
So specific for this issue, here are my top 3 CLI commands 🙂
To find zero-byte files and print to screen:
find / -size 0 -print
You'll soon see the directory containing a lot (perhaps millions) zero-byte files. In this example we found a lot zero-byte files starting with fileAxxxx, fileBxxxx etc in a tmp directory of a Virtual System. So the following commands are based on these filenames and VS 3.
To find zero-byte files in a specific directory and count them:
find /opt/CPshrd-R77/CTX/CTX00003/tmp/ -size 0 -print -type f -name "file*" | wc -l
To find and delete zero-byte files named file* in a specific directory:
find /opt/CPshrd-R77/CTX/CTX00003/tmp/ -size 0 -type f -name "file*" -delete
Last year I posted this on my blog. CPUSE timeout during ‘Saving File Permissions’ – checkpointengineer
Unfortunately we never received an answer on the questions we had back then. Perhaps I will contact TAC again as this issue still exists.
[UPDATE]
Found sk116679. It seems there is a hotfix available but unfortunately it's not included in a Jumbo Hotfix.
The SK is mentioning $CPDIR/tmp/ which is the exact same directory as in my example above.
Snapshot creation on Gaia OS is stuck at 1-2%
[UPDATE 2]
Currently available hotfix is only compatible with versions up to Take 225 on R77.30. Filed an SR for a portfix to install on top of the current GA and also requested to include this permanently in a future Jumbo Hotfix Take.
My blog: https://checkpoint.engineer
- Mark as New
- Bookmark
- Subscribe
- Mute
- Subscribe to RSS Feed
- Permalink
- Report Inappropriate Content
1. top
2. cphaprob stat
3. show bgp peers
- Mark as New
- Bookmark
- Subscribe
- Mute
- Subscribe to RSS Feed
- Permalink
- Report Inappropriate Content
View connections sorted by rule.
R77.30:
fw tab -u -t connections -f | awk -F ';' '{print $11,"\t", $7,"\t", $3,"\t", $5,"\t", $6}' |grep Rule | sort -ng
R80.10:
fw tab -u -t connections -f | awk -F ';' '{print $16,"\t", $8,"\t", $10,"\t", $11,"\t", $12}' |grep Rule | sort -ng
➜ CCSM Elite, CCME, CCTE, CCVS ➜ www.checkpoint.tips
- Mark as New
- Bookmark
- Subscribe
- Mute
- Subscribe to RSS Feed
- Permalink
- Report Inappropriate Content
nice command
- Mark as New
- Bookmark
- Subscribe
- Mute
- Subscribe to RSS Feed
- Permalink
- Report Inappropriate Content
cpstat -f log_server mg
cpstat -f indexer mg
cpwd_admin list
cpview
top or ps auxwf
fw stat
show ip arp dynamic all | grep x.x.x.x
fw ver
installed_jumbo_take or cpinfo -y all
- Mark as New
- Bookmark
- Subscribe
- Mute
- Subscribe to RSS Feed
- Permalink
- Report Inappropriate Content
"fw ctl zdebug" is a powertool that is not exhausted from being used with "fw ctl zdebug drop". There is not much to be found in Check Point KB or in the documentation.
Here are some good examples for debugging:
fw ctl zdebug + packet
fw ctl zdebug + packet | grep -B 1 TCP |grep -B 1 "(SYN)" <<< change SYN-ACK,ACK,FIN,... and/or UDP,TCP...
fw ctl zdebug + all |grep -A 1 "Monitor" | grep "1.1.1.1" <<< change IP address
fw ctl zdebug + all |grep -A 2 "Monitor"
fw ctl zdebug + sync
fw ctl zdebug + conn |grep "After VM:" |grep "(SYN)"
fw ctl zdebug + xlate
fw ctl zdebug + monitorall <<< use with host IP "| grep 1.1.1.1" or network range "| grep 1.1."
fw ctl zdebug + monitor <<< use with host IP "| grep 1.1.1.1" or network range "| grep 1.1."
fw ctl zdebug + filter conn | grep -A 8 "rule 1" <<< change rule number
fw ctl zdebug + filter monitor | grep -A 8 "rule 2" <<< change rule number - show connetions to rule xyz
Attention, if you turn on debugging, this will affect the performance of the firewall.
➜ CCSM Elite, CCME, CCTE, CCVS ➜ www.checkpoint.tips
- Mark as New
- Bookmark
- Subscribe
- Mute
- Subscribe to RSS Feed
- Permalink
- Report Inappropriate Content
i've just read through the entire thread - amazing content, full of experience and knowledge.
thanks!
- Mark as New
- Bookmark
- Subscribe
- Mute
- Subscribe to RSS Feed
- Permalink
- Report Inappropriate Content
does anyone know a way or a cli command to monitor performance of VPN cores? I know of 'vpn tu mstat' and 'vpn multik ipsec stat'
- Mark as New
- Bookmark
- Subscribe
- Mute
- Subscribe to RSS Feed
- Permalink
- Report Inappropriate Content
First off, there are SmartView Monitor reports called Traffic..."Top Tunnels", System Counters..."VPN", and System Counters..."VPN History" that might prove helpful for measuring VPN throughput. I'm pretty sure these numbers only show IPSec traffic that was not fully accelerated by SecureXL in the SXL path (see below). These reports also show how much CPU is actually being used by IPSec VPN processing, not sure how to get these numbers from the CLI.
However the cores that handle IPSec VPN traffic will vary depending on the version of your gateway.
For R77.30 gateway and earlier, all non-accelerated IPSec VPN traffic will be handled by firewall kernel instance (worker) #0, which is usually assigned to the highest numbered CPU core. As far as CPU usage you can use top..1 to monitor that single highest-numbered core or alternatively cpstat os -f multi_cpu -o 1. To measure current VPN throughput use cpstat -f statistics vpn like this:
IKE Successes (per sec): ?
IKE Failures (per sec): ?
Encryption Throughput (bytes per sec): ?
Decryption Throughput (bytes per sec): ?
Encrypted Packets (per sec): ?
Decrypted Packets (per sec): ?
Encryption Errors (per sec): ?
Decryption Errors (per sec): ?
VPN Accel Enc Throughput (bytes per sec): ?
VPN Accel Dec Throughput (bytes per sec): ?
VPN Accel Encryption Errors (per sec): ?
VPN Accel Decryption Errors (per sec): ?
Compressed Packets (per sec): ?
Decompressed Packets (per sec): ?
Compression Errors (per sec): ?
Decompression Errors (per sec): ?
To see if IPSec VPN traffic is being accelerated, use fwaccel stats and look in the Accelerated VPN Path section. This will just show you raw counters, and I don't think there is a way to show current throughput numbers for accelerated VPN traffic. Not much VPN traffic tends to be eligible for acceleration like this anyway due to most traffic on firewalls today taking the Medium (PXL) Path.
For R80.10 and later IPSec VPN traffic is spread across all Firewall Worker cores by default, and the distribution can be observed with vpn tu mstats and vpn tu tlist. So in that case you'd need to examine the CPU utilization of all Firewall Workers using the various tools above.
--
Second Edition of my "Max Power" Firewall Book
Now Available at http://www.maxpowerfirewalls.com
New Book: "Max Power 2026" Coming Soon
Check Point Firewall Performance Optimization
Check Point Firewall Performance Optimization
- Mark as New
- Bookmark
- Subscribe
- Mute
- Subscribe to RSS Feed
- Permalink
- Report Inappropriate Content
My top 3 commands.
#asg monitor vs all
#asg perf -vs all -v -p
#g_tcpdump
Best regard
- Mark as New
- Bookmark
- Subscribe
- Mute
- Subscribe to RSS Feed
- Permalink
- Report Inappropriate Content
My top 3 commands.
# watch tecli s s
# tail -f /var/log/messages
# cphacu start <IP> 1
- Mark as New
- Bookmark
- Subscribe
- Mute
- Subscribe to RSS Feed
- Permalink
- Report Inappropriate Content
Hi team,
with which command we check if a policy is already allowed
My top 3 command are:
cphaprob stat
tcpdump
fw monitor
Regards,
- Mark as New
- Bookmark
- Subscribe
- Mute
- Subscribe to RSS Feed
- Permalink
- Report Inappropriate Content
Hi, I want to suggest a new way for this: "show access-rulebase name MyPolicy filter 'src:2.2.2.2 AND dst:4.5.6.7'"
- Mark as New
- Bookmark
- Subscribe
- Mute
- Subscribe to RSS Feed
- Permalink
- Report Inappropriate Content
My top 3 commands:
reboot ![]()
netstat -ni
cplic print
- Mark as New
- Bookmark
- Subscribe
- Mute
- Subscribe to RSS Feed
- Permalink
- Report Inappropriate Content
when I have devices around me, taking a dump -connectivity wise... and I have to prove the Gateway's innocence:
ip -s -s neigh flush all
...after running netstat and arp'ing and checking my inferfaces.
Alan Stanwyck: "If you reject the proposition, you keep the thousand – and your mouth shut."
Fletch: "Does this proposition entail my dressing up as Little Bo Peep?"
Alan Stanwyck: "It’s nothing of a sexual nature, I assure you."
Fletch: "Yeah, I assure you."
Alan Stanwyck: "One thousand just to listen. I don’t see how you can pass that up, Mister…?"
Fletch: "Nugent. Ted Nugent."
Fletch: "Does this proposition entail my dressing up as Little Bo Peep?"
Alan Stanwyck: "It’s nothing of a sexual nature, I assure you."
Fletch: "Yeah, I assure you."
Alan Stanwyck: "One thousand just to listen. I don’t see how you can pass that up, Mister…?"
Fletch: "Nugent. Ted Nugent."
- Mark as New
- Bookmark
- Subscribe
- Mute
- Subscribe to RSS Feed
- Permalink
- Report Inappropriate Content
Hahahaha....
1. top
2. cpstop/cpstart
3. reboot
- Mark as New
- Bookmark
- Subscribe
- Mute
- Subscribe to RSS Feed
- Permalink
- Report Inappropriate Content
My top 3:
vsx_util vsls
fw vsx rssctrl monitor enable
fw vsx stat –l
- Mark as New
- Bookmark
- Subscribe
- Mute
- Subscribe to RSS Feed
- Permalink
- Report Inappropriate Content
My Top 3:
Install Policy
# mgmt_cli install-policy
Show unused objekts:
# mgmt_cli show unused-objects offset 0 limit 50 details-level "standard" --format json
R80.10+ debug VPN
# iketool
Shows Cluster informations
> show routed cluster-state detailed
- Mark as New
- Bookmark
- Subscribe
- Mute
- Subscribe to RSS Feed
- Permalink
- Report Inappropriate Content
1. Ping
2. ifconfig
3. cd
![]()
- Mark as New
- Bookmark
- Subscribe
- Mute
- Subscribe to RSS Feed
- Permalink
- Report Inappropriate Content
Shows the health stat of various blades.
# ./healthckeck.sk (sk121447)
Displays a lot of information about ClusterXL:
- Time of the last cluster switch (Master<>Slave)
# clish -c "show routed cluster-state detailed"
- Mark as New
- Bookmark
- Subscribe
- Mute
- Subscribe to RSS Feed
- Permalink
- Report Inappropriate Content
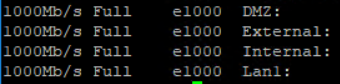
Interface Status of phisical interfaces (speed,duplex,driver type) in one line:
# ifconfig -a | grep encap | awk '{print $1}' | grep -v lo | grep -v bond | grep -v ":" | grep -v ^lo | xargs -I % sh -c 'ethtool %; ethtool -i %' | grep '^driver\|Speed\|Duplex\|Setting' | sed "s/^/ /g" | tr -d "\t" | tr -d "\n" | sed "s/Settings for/\nSettings for/g" | awk '{print $5 " "$7 "\t " $9 "\t" $3}' | grep -v "Unknown" | grep -v "\."
- Mark as New
- Bookmark
- Subscribe
- Mute
- Subscribe to RSS Feed
- Permalink
- Report Inappropriate Content
Awesome command mate, I have added a small modification to show the link status, so we can check the state of all the interfaces quickly
ifconfig -a | grep encap | awk '{print $1}' | grep -v lo | grep -v bond | grep -v ":" | grep -v ^lo | xargs -I % sh -c 'ethtool %; ethtool -i %' | grep '^driver\|Speed\|Link\|Setting' | sed "s/^/ /g" | tr -d "\t" | tr -d "\n" | sed "s/Settings for/\nSettings for/g" | awk '{print $3 " \t" $5 "\t " $10 "\t" $8}' | grep -v "\."

- Mark as New
- Bookmark
- Subscribe
- Mute
- Subscribe to RSS Feed
- Permalink
- Report Inappropriate Content
In R80.20, cphaprob stat shows info about last failover and bit more as well.
and now to something completely different - CCVS, CCAS, CCTE, CCCS, CCSM elite
- Mark as New
- Bookmark
- Subscribe
- Mute
- Subscribe to RSS Feed
- Permalink
- Report Inappropriate Content
Here are some of my popular ones ..
Acceleration
fwaccel off/on
fwaccel stat
fw ctl multik stat
fw ctl affinity -l -a -v
fwaccel conns |grep 10.20.32.12 | more
fw tab –t connections –s
- Mark as New
- Bookmark
- Subscribe
- Mute
- Subscribe to RSS Feed
- Permalink
- Report Inappropriate Content
My top 3 are:
1) fw ctl zdebug + drop | grep <ip_address> //to quickly know what is the reason a connection is being dropped//
2) fw tab -t connections -s //to know what is the number of concurrent connections that the FW is handling//
3) cphaprob stat //to know the status of the cluster members//
Regards
- Mark as New
- Bookmark
- Subscribe
- Mute
- Subscribe to RSS Feed
- Permalink
- Report Inappropriate Content
I've put all your commands into this script:
Common Check Point Commands (ccc)
- Mark as New
- Bookmark
- Subscribe
- Mute
- Subscribe to RSS Feed
- Permalink
- Report Inappropriate Content
I think the most important commands have been mentioned. And didn't know there was a 'pinj of test' (pune intended). Here some more tips:
Really recommend the book for Firewall Performance Optimization where we can learn a lot of great commands for that purpose http://www.maxpowerfirewalls.com/
Also recomend this blog with a lot of interesting information specially on troubleshooting http://todorovicmarko.blogspot.sk/p/blog-page.html
WVT - Web Visualisation Tool I didn't see mentioned and has been Beta all the time but for me has been an amazing tool for documentation
Attached a compilation of commands and how-to I've done along the many years working with Check Point products and also other good tips I've learned.
My "all time" favorite command is below - applies to Check Point but also in general to other platforms where tcpdump can be run. The purpose is to connect remotely to a device, run tcpdump with specific filters if needed and then through a SSH tunnel have a live view of the capture on Wireshark running on the local computer.
plink.exe -l <u> -pw <p> <IP> "tcpdump -s0 -npi any -w - '(host 1.1.1.1)'"|"c:\Wireshark\wireshark.exe" -k -i -
- Mark as New
- Bookmark
- Subscribe
- Mute
- Subscribe to RSS Feed
- Permalink
- Report Inappropriate Content
fwaccel stats >
- Displays SecureXL acceleration statistics
cpview >
- Shows statistical data that contain general system information (cpu, memory, disk, interfaces , connections...) and information for different blades.
cphaprob state / -a if / -l list >
- Cluster member status / Cluster interfaces / critical devices (sync, filter, cphad, fwd) status.
Leaderboard
Epsum factorial non deposit quid pro quo hic escorol.
| User | Count |
|---|---|
| 12 | |
| 8 | |
| 5 | |
| 4 | |
| 4 | |
| 2 | |
| 2 | |
| 1 | |
| 1 | |
| 1 |
Upcoming Events
Tue 28 Jul 2026 @ 11:00 AM (EDT)
Under the Hood - Check Point and Illumio – Modern Network Defense Against AI-Based ThreatsThu 30 Jul 2026 @ 10:00 AM (PDT)
AI Security Masters E12: READY OR NOT: Securing the AI Enterprise 4/5 - AI GatewayThu 20 Aug 2026 @ 10:00 AM (PDT)
AI Security Masters E13: READY OR NOT: Securing the AI Ent 5/5 - AI Research & Threat LandscapeTue 28 Jul 2026 @ 11:00 AM (EDT)
Under the Hood - Check Point and Illumio – Modern Network Defense Against AI-Based ThreatsThu 30 Jul 2026 @ 10:00 AM (PDT)
AI Security Masters E12: READY OR NOT: Securing the AI Enterprise 4/5 - AI GatewayThu 20 Aug 2026 @ 10:00 AM (PDT)
AI Security Masters E13: READY OR NOT: Securing the AI Ent 5/5 - AI Research & Threat LandscapeAbout CheckMates
Learn Check Point
Advanced Learning
YOU DESERVE THE BEST SECURITY

©1994-2026 Check Point Software Technologies Ltd. All rights reserved.
Copyright
Privacy Policy
About Us
UserCenter