- Products
- Learn
- Local User Groups
- Partners
- More

This website uses Cookies. Click Accept to agree to our website's cookie use as described in our Privacy Policy. Click Preferences to customize your cookie settings.
- Products
- Learn
- Local User Groups
- Upcoming Events
- Americas
- EMEA
- Czech Republic and Slovakia
- Denmark
- Netherlands
- Germany
- Sweden
- United Kingdom and Ireland
- France
- Spain
- Norway
- Ukraine
- Baltics and Finland
- Greece
- Portugal
- Austria
- Kazakhstan and CIS
- Switzerland
- Romania
- Turkey
- Belarus
- Belgium & Luxembourg
- Russia
- Poland
- Georgia
- DACH - Germany, Austria and Switzerland
- Iberia
- Africa
- Adriatics Region
- Eastern Africa
- Israel
- Nordics
- Middle East and Africa
- Balkans
- Italy
- Bulgaria
- Cyprus
- APAC
- Partners
- More
- ABOUT CHECKMATES & FAQ
- Sign In
- Leaderboard
- Events
On-Premises SD-WAN Management
Register HereThe industry's first AI Network Firewall
Securing AI traffic, everywhere
AI Security Masters E8:
Claude Mythos: New Era in Cyber Security
CheckMates Go:
No Attack Required
Turn on suggestions
Auto-suggest helps you quickly narrow down your search results by suggesting possible matches as you type.
Showing results for
- CheckMates
- :
- Products
- :
- General Topics
- :
- Re: Ifconfig dropped explanation
Options
- Subscribe to RSS Feed
- Mark Topic as New
- Mark Topic as Read
- Float this Topic for Current User
- Bookmark
- Subscribe
- Mute
- Printer Friendly Page
Turn on suggestions
Auto-suggest helps you quickly narrow down your search results by suggesting possible matches as you type.
Showing results for
Are you a member of CheckMates?
×
Sign in with your Check Point UserCenter/PartnerMap account to access more great content and get a chance to win some Apple AirPods! If you don't have an account, create one now for free!
- Mark as New
- Bookmark
- Subscribe
- Mute
- Subscribe to RSS Feed
- Permalink
- Report Inappropriate Content
Jump to solution
Ifconfig dropped explanation
Hi Guys,
Can you please explain what is drops and overruns and how to overcome it.
Sync Link encap:Ethernet HWaddr 00:1C:7F:42:D6:3B
inet addr:192.168.63.1 Bcast:192.168.63.3 Mask:255.255.255.252
UP BROADCAST RUNNING MULTICAST MTU:1500 Metric:1
RX packets:26449716 errors:0 dropped:9 overruns:9 frame:0
TX packets:775834 errors:0 dropped:0 overruns:0 carrier:0
collisions:0 txqueuelen:1000
RX bytes:30156388367 (28.0 GiB) TX bytes:132001919 (125.8 MiB)
Sync Link encap:Ethernet HWaddr 00:1C:7F:42:D6:03
inet addr:192.168.63.2 Bcast:192.168.63.3 Mask:255.255.255.252
UP BROADCAST RUNNING MULTICAST MTU:1500 Metric:1
RX packets:4800024911 errors:0 dropped:313 overruns:313 frame:0
TX packets:1342815369 errors:0 dropped:0 overruns:0 carrier:0
collisions:0 txqueuelen:1000
RX bytes:5372479988332 (4.8 TiB) TX bytes:1237081394605 (1.1 TiB)
And is there any command to check CRC errors ?
1 Solution
Accepted Solutions
- Mark as New
- Bookmark
- Subscribe
- Mute
- Subscribe to RSS Feed
- Permalink
- Report Inappropriate Content
Hi,
Presence of interface errors is an indicator that your firewall needs tuning or if you have tuned it already that the platform hardware is under pressure and needs more powerful appliance/open server.
You can run the command: netstat -ni to get a nice overview of errors on all your network cards.
From CheckPoint:
- RX-DRP implies the appliance is dropping packets at the network. If the ratio of RX-DRP to RX-OK is greater than 0.1% attention is required as it is a sign that the firewall does not have enough FIFO memory buffer (descriptors) to hold the packets while waiting for a free interrupt to process them.
- RX-OVR = the number of times the receiver hardware was unable to hand received data to a hardware buffer - the internal FIFO buffer of the chip is full, but is still tries to handle incoming traffic ; most likely, the input rate of traffic exceeded the ability of the receiver to handle the data.
The Linux OS (Red Hat) is not cleanly delivering packets to CheckPoint. I will let the experts assist you in solving your problems.
24 Replies
- Mark as New
- Bookmark
- Subscribe
- Mute
- Subscribe to RSS Feed
- Permalink
- Report Inappropriate Content
Hi,
Presence of interface errors is an indicator that your firewall needs tuning or if you have tuned it already that the platform hardware is under pressure and needs more powerful appliance/open server.
You can run the command: netstat -ni to get a nice overview of errors on all your network cards.
From CheckPoint:
- RX-DRP implies the appliance is dropping packets at the network. If the ratio of RX-DRP to RX-OK is greater than 0.1% attention is required as it is a sign that the firewall does not have enough FIFO memory buffer (descriptors) to hold the packets while waiting for a free interrupt to process them.
- RX-OVR = the number of times the receiver hardware was unable to hand received data to a hardware buffer - the internal FIFO buffer of the chip is full, but is still tries to handle incoming traffic ; most likely, the input rate of traffic exceeded the ability of the receiver to handle the data.
The Linux OS (Red Hat) is not cleanly delivering packets to CheckPoint. I will let the experts assist you in solving your problems.
- Mark as New
- Bookmark
- Subscribe
- Mute
- Subscribe to RSS Feed
- Permalink
- Report Inappropriate Content
For problems with overruns you can take a look at interface bonding (link aggregation). Link aggregation joins multiple physical interfaces into one virtual interface (bond interface).The bond interface shares the load among the joined interfaces and gives you fault tolerance and increases throughput.
From CheckPoint:
A bond interface (also known as a bonding group or bond) is identified by its Bond ID (for example: bond1) and is assigned an IP address. The physical interfaces included in the bond are called slaves and do not have IP addresses.
You can define a bond interface to use one of these functional strategies:
• High Availability (Active/Backup): Gives redundancy when there is an interface or a link failure. This strategy also supports switch redundancy. High Availability works in Active/Backup mode - Interface Active/Standby mode. When an active slave interface is down, the connection automatically fails over to the primary slave interface. If the primary slave interface is not available, the connection fails over to a different slave interface.
• Load Sharing (Active/Active): Slave interfaces are active simultaneously. Traffic is distributed among the slave interfaces to maximize throughput. Load Sharing does not support switch redundancy. You can configure load sharing to use one of these modes:
• Round Robin - Selects the active slave interface sequentially.
• 802.3ad - Dynamically uses active slaves to share the traffic load. This mode uses the LACP protocol, which fully monitors the interface between the gateway and a switch.
• XOR - Selects the algorithm for slave selection based on the TCP/IP layer.
- Mark as New
- Bookmark
- Subscribe
- Mute
- Subscribe to RSS Feed
- Permalink
- Report Inappropriate Content
May I have the www for reference above?
- Mark as New
- Bookmark
- Subscribe
- Mute
- Subscribe to RSS Feed
- Permalink
- Report Inappropriate Content
Hello together,
I have also a problem with RX-OVR. In this environment SecureXL is disabled (because of an old "policy" in this company comming from R60). The Interface where I have the problem is already an bond.
I wonder if I can make these RX-OVR go away by enabling SecureXL? At normal operation we have no problems, but when we install the policy some Connections get lost and the RX-OVR counter increases. When I understand Timothy Halls book right, the assignment of CPUs to Interfaces is better and more dynamic when SecureXL is enabled. Could enabling SecureXL solve my problem?
If I look at the connected Switch, I don't see any errors on the appropriate switch-interface.
We have R77.30 running on Check Point 23500 appliances. In normal operation the gateways running at 5 to 7% of CPU-Load (according to SmartView Monitor). When we install policy the cpu-load rises to 10%.
How can I investigate this issue further? I tried to measure the cpu-load with "nmon" during policy Installation. There was one processor which goes up to 75%.
Any hint would be appreciatet.
Best regards Sascha
- Mark as New
- Bookmark
- Subscribe
- Mute
- Subscribe to RSS Feed
- Permalink
- Report Inappropriate Content
Hi Sascha,
Turning on SecureXL may help as it will enable automatic interface affinity which will assign more than one SND/IRQ core to empty interface ring buffers, but that typically helps avoid RX-DRPs, not RX-OVRs. It is possible however that frames are getting backed up in the NIC's hardware buffer due to constantly full ring buffers and being lost to RX-OVRs.
Please provide the output of "netstat -ni" run on your firewall as I need to see the other counters. On the problematic interface(s) also please provide the output of "ethtool -S (interfacename)".
--
Second Edition of my "Max Power" Firewall Book
Now Available at http://www.maxpowerfirewalls.com
New Book: "Max Power 2026" Coming Soon
Check Point Firewall Performance Optimization
Check Point Firewall Performance Optimization
- Mark as New
- Bookmark
- Subscribe
- Mute
- Subscribe to RSS Feed
- Permalink
- Report Inappropriate Content
Hello Timothy,
thank your for your reply and please excuse my delayed answer. I had to come back to work again for gathering the information you need.
Here comes the output from the two commands:
Kernel Interface table
Iface MTU Met RX-OK RX-ERR RX-DRP RX-OVR TX-OK TX-ERR TX-DRP TX-OVR Flg
Sync 1500 0 7328294935 0 0 0 41413517 0 0 0 BMsRU
bond0 1500 0 9048414719 4 0 0 22994929759 0 0 0 BMmRU
bond1 9216 0 8744713065 0 0 0 7744539947 0 0 0 BMmRU
bond1.411 9216 0 349523906 0 0 0 325117534 0 0 0 BMmRU
bond1.3073 9216 0 8391272904 0 0 0 7416811534 0 0 0 BMmRU
bond2 9216 0 362424970693 745 1151959 1151959 316723998361 0 0 0 BMmRU
bond2.10 9216 0 362419538404 0 0 0 316721387585 0 0 0 BMmRU
bond3 9216 0 480266691808 0 2443 0 523231391186 0 0 0 BMmRU
bond3.11 9216 0 2379446058 0 0 0 1167994665 0 0 0 BMmRU
bond3.12 9216 0 1526445627 0 0 0 468645893 0 0 0 BMmRU
bond3.13 9216 0 1572019373 0 0 0 322065773 0 0 0 BMmRU
bond3.14 9216 0 1524996780 0 0 0 301482132 0 0 0 BMmRU
bond3.21 9216 0 139283659108 0 0 0 127485706715 0 0 0 BMmRU
bond3.24 9216 0 214975474536 0 0 0 295802590825 0 0 0 BMmRU
bond3.101 9216 0 7590048591 0 0 0 509953757 0 0 0 BMmRU
bond3.102 9216 0 320384413 0 0 0 301545910 0 0 0 BMmRU
bond3.103 9216 0 61471579174 0 0 0 34935517725 0 0 0 BMmRU
bond3.104 9216 0 5398435810 0 0 0 5789230865 0 0 0 BMmRU
bond3.105 9216 0 4688468783 0 0 0 4270428459 0 0 0 BMmRU
bond3.106 9216 0 320384423 0 0 0 301542853 0 0 0 BMmRU
bond3.107 9216 0 320425547 0 0 0 301609300 0 0 0 BMmRU
bond3.108 9216 0 1109861580 0 0 0 2150879185 0 0 0 BMmRU
bond3.109 9216 0 320384401 0 0 0 301582175 0 0 0 BMmRU
bond3.110 9216 0 320384402 0 0 0 301582546 0 0 0 BMmRU
bond3.111 9216 0 10056794219 0 0 0 18185207716 0 0 0 BMmRU
bond3.112 9216 0 320384405 0 0 0 301653645 0 0 0 BMmRU
bond3.113 9216 0 320384416 0 0 0 301555121 0 0 0 BMmRU
bond3.114 9216 0 320384414 0 0 0 301565349 0 0 0 BMmRU
bond3.115 9216 0 347088603 0 0 0 305894329 0 0 0 BMmRU
bond3.116 9216 0 320770148 0 0 0 301992744 0 0 0 BMmRU
bond3.121 9216 0 24256798972 0 0 0 27685762455 0 0 0 BMmRU
bond3.161 9216 0 335102012 0 0 0 316038632 0 0 0 BMmRU
bond3.162 9216 0 344942645 0 0 0 333455397 0 0 0 BMmRU
bond3.1172 9216 0 259854298 0 0 0 240195171 0 0 0 BMmRU
bond3.1173 9216 0 255319208 0 0 0 240490853 0 0 0 BMmRU
eth1-01 1500 0 1720119793 4 0 0 22953516347 0 0 0 BMsRU
eth1-02 1500 0 22263179382 654 24 24 16275195207 0 0 0 BMRU
eth1-03 9216 0 322319396 0 0 0 190421067416 0 0 0 BMsRU
eth1-04 9216 0 362102653198 745 1151959 1151959 126302933128 0 0 0 BMsRU
eth2-01 9216 0 5257767598 0 0 0 4170483319 0 0 0 BMsRU
eth2-02 9216 0 130950036244 0 152 0 121342122054 0 0 0 BMsRU
eth3-01 9216 0 3486945473 0 0 0 3574056632 0 0 0 BMsRU
eth3-02 9216 0 138743790512 0 0 0 118395834415 0 0 0 BMsRU
eth3-03 9216 0 136903393940 0 1460 0 166674595766 0 0 0 BMsRU
eth3-04 9216 0 73669474382 0 831 0 116818841944 0 0 0 BMsRU
lo 16436 0 25593339 0 0 0 25593339 0 0 0 LRU
ethtool -S eth1-04
NIC statistics:
rx_packets: 362103638440
tx_packets: 126303479177
rx_bytes: 294503297876960
tx_bytes: 61213346090829
rx_broadcast: 4028
tx_broadcast: 654446
rx_multicast: 67084922
tx_multicast: 1958037
multicast: 67084922
collisions: 0
rx_crc_errors: 602
rx_no_buffer_count: 33786
rx_missed_errors: 1151959
tx_aborted_errors: 0
tx_carrier_errors: 0
tx_window_errors: 0
tx_abort_late_coll: 0
tx_deferred_ok: 0
tx_single_coll_ok: 0
tx_multi_coll_ok: 0
tx_timeout_count: 0
rx_long_length_errors: 0
rx_short_length_errors: 0
rx_align_errors: 0
tx_tcp_seg_good: 0
tx_tcp_seg_failed: 0
rx_flow_control_xon: 0
rx_flow_control_xoff: 0
tx_flow_control_xon: 0
tx_flow_control_xoff: 0
rx_long_byte_count: 294503297876960
tx_dma_out_of_sync: 0
lro_aggregated: 0
lro_flushed: 0
lro_recycled: 0
tx_smbus: 0
rx_smbus: 0
dropped_smbus: 0
os2bmc_rx_by_bmc: 0
os2bmc_tx_by_bmc: 0
os2bmc_tx_by_host: 0
os2bmc_rx_by_host: 0
rx_errors: 745
tx_errors: 0
tx_dropped: 0
rx_length_errors: 0
rx_over_errors: 0
rx_frame_errors: 0
rx_fifo_errors: 1151959
tx_fifo_errors: 0
tx_heartbeat_errors: 0
tx_queue_0_packets: 126303479177
tx_queue_0_bytes: 60101692092153
tx_queue_0_restart: 26
rx_queue_0_packets: 362103638442
rx_queue_0_bytes: 291606479635784
rx_queue_0_drops: 0
rx_queue_0_csum_err: 1447709
rx_queue_0_alloc_failed: 0
The problematic interface (bond2) consists of the two interfaces eth1-03 and eth1-04 and with eth1-04 we see the errors.
Maybe it is of interest for you, the two interfaces are copper-GBit. With the 10GBit-interfaces we don't see this behavior. I realize on another cluster we have similar problems, so I could imagine, that we have a generell issue with the config of the GBIt-copper interfaces.
Thank you for your help in advance
Best regards
Sascha
- Mark as New
- Bookmark
- Subscribe
- Mute
- Subscribe to RSS Feed
- Permalink
- Report Inappropriate Content
OK I've seen this before, where the output reported by netstat -ni increments RX-DRP and RX-OVR in lockstep, and it is impossible to determine if the drop issue is a ring buffer overflow (RX-DRP) or NIC hardware buffering drop (RX-OVR) solely from that output. However the output of ethtool -S reveals that there have been 33786 overruns in the NIC hardware (rx_no_buffer_count) and 1151959 ring buffer misses (rx_fifo_errors/rx_missed_errors). Given that ~362 trillion frames have come through the eth1-04 interface these error numbers on a percentage basis are negligible.
It is interesting to note that eth1-03 and eth1-04 are part of the same bond interface, yet eth1-04 is the one getting pummeled with traffic to the point of losing frames, but very little traffic is coming in on eth1-03. It would appear that the bond interface is configured in High Availability (Active/Backup) mode, and there is no traffic load-balancing between the two interfaces that are part of the bond.
As a first step I'd recommend enabling Load Sharing (Active/Active) mode on this bond interface and regardless of which distribution mode you choose, be sure to match settings on the firewall's bond interface to that of the switch ports to help ensure relatively even distribution of traffic between the two physical interfaces. I'm pretty sure this will alleviate the bottleneck and drops, and there is no need to adjust ring buffer sizes, SND/IRQ core allocations, or anything involving SecureXL.
--
Second Edition of my "Max Power" Firewall Book
Now Available at http://www.maxpowerfirewalls.com
New Book: "Max Power 2026" Coming Soon
Check Point Firewall Performance Optimization
Check Point Firewall Performance Optimization
- Mark as New
- Bookmark
- Subscribe
- Mute
- Subscribe to RSS Feed
- Permalink
- Report Inappropriate Content
Hello Timothy,
thank you for your reply. The difference between eth1-03 and eth1-04 I also noticed. Today I talked to a network-colleague. He told me, that on the switch (Cisco with etherchannel) the load distribution-mechanism is set to default, meaning distributing based on source-mac-address (not a good idea between two "routers"). On the Check Point Gateways the distribution is set to "Layer3 and 4" and on the switch only one bond-member is used because of the distribution based on source-mac-address
OK So we will try to adjust the distribution alghorithm on the switch side to "Layer3 and 4" (like set on Check Point Gateway side).
Many thanks for your help.
Best regards
Sascha
P.S. Your book is great.
- Mark as New
- Bookmark
- Subscribe
- Mute
- Subscribe to RSS Feed
- Permalink
- Report Inappropriate Content
I got excited when I came across this post as we have been battling random packet loss to the internet the past few months. This post seems similar to some of what we are seeing and I feel hopeful that someone may be able to help us out. The packet loss events only occur for a few seconds and happen at random times. We have RX-DRP and RX-OVR on both our inside and outside interfaces. Due to the randomness of the packet loss it has been very hard to get real time captures. The inside and outside interfaces had pretty high bandwidth utilization during peak business hours of 6am - 6pm. The packet loss does not always occur during these peak business hours. As part of the troubleshooting we have bonded 2 interfaces for inside and 2 interfaces for outside to provide more bandwidth but this did not fix the packet loss.
We have had CheckPoint and Cisco TAC involved in the troubleshooting. First CheckPoint TAC had us try enabling multi-queuing and that ended up making things worse (started seeing gateway fail overs the next day) so we disabled multi-queuing and set each interface to a different SND core with "sim affinity -s". CheckPoint TAC could not explain what we saw after the multi-queuing was enabled. Setting the sim affinity did not fix the random packet loss.
Packet captures did show that traffic is leaving the gateway outside interface but not returning when the packet loss is occurring. The Cisco switch interfaces that the gateways connect show output drops but these drops do not increment during the packet loss. However Cisco TAC discovered that these switch interfaces were seeing pause frames. We were able to see the pause frames increment during the packet loss. This is when we configured to the bonded interfaces.
Could the Cisco pause frames indicate that the switch interfaces are receiving a signal from the gateway interfaces to pause the frame transmission? If so, what would cause the gateways to send the pause?
Any feedback or insight would be greatly appreciated. We have been unsuccessful trying to track down the cause of this random packet loss for several months and it does have some business impacts at times.
bond1 (inside) is eth2-01 and eth2-05
bond2 (outside) is eth2-02 and eth2-06
[Expert@xxxx]# netstat -ni
Kernel Interface table
Iface MTU Met RX-OK RX-ERR RX-DRP RX-OVR TX-OK TX-ERR TX-DRP TX-OVR Flg
Mgmt 1500 0 0 0 0 0 0 0 0 0 BMU
Sync 1500 0 7 0 0 0 19 0 0 0 BMRU
bond1 1500 0 2657883398 0 955 955 2498665596 0 0 0 BMmRU
bond2 1500 0 2349795486 0 743 743 2517600887 0 0 0 BMmRU
eth2-01 1500 0 1318320859 0 442 442 1220015273 0 0 0 BMsRU
eth2-02 1500 0 1149755688 0 359 359 1251580935 0 0 0 BMsRU
eth2-03 1500 0 213618345 0 23 23 202971722 0 0 0 BMRU
eth2-04 1500 0 10899955 0 0 0 108293895 0 0 0 BMRU
eth2-04.121 1500 0 10899956 0 0 0 108293901 0 0 0 BMRU
eth2-05 1500 0 1339563279 0 513 513 1278651001 0 0 0 BMsRU
eth2-06 1500 0 1200040413 0 384 384 1266020732 0 0 0 BMsRU
lo 16436 0 5422267 0 0 0 5422267 0 0 0 LRU
- Mark as New
- Bookmark
- Subscribe
- Mute
- Subscribe to RSS Feed
- Permalink
- Report Inappropriate Content
To get a full picture of your situation, please provide the outputs of the Super Seven commands taken on the active cluster member during the firewall's typically busiest period if possible. There is a convenient script to run them all here:
Super Seven Performance Assessment Commands (s7pac)
Based on what you have provided so far:
1) Run sar -n EDEV as this can provide up to 30 days of history about precisely when the RX-DRP/RX-ERR counters are being incremented. If it is only during policy loads on the gateway, these are somewhat expected since SecureXL must restart and recalculate all its tables, and it can easily fall behind on SoftIRQ operations during that period. The SecureXL restart during policy push no longer happens on R80.20 gateway.
2) You need to run ethtool -S on the interfaces as detailed earlier in this thread to determine if it is really a NIC overrun (RX-OVR) or RX-DRP (buffering miss) since RX-OVR and RX-DRP are getting incremented in lock-step. Based on the pause frames being seen it sounds like the underlying issue is RX-OVR, but that could actually be caused by backpressure from the RX ring buffers being full, that backs up frames into the NIC's hardware buffers which then get close to full, which then causes the pauses (xoff) to be sent to the Cisco.
3) The fact that turning on Multi-Queue made things worse absolutely SCREAMS that you need more SND/IRQ cores. Manually assigning interface affinity via sim affinity -s might help I guess, but it is usually more productive to add more SND/IRQ cores if available and let automatic interface affinity take over (assuming of course SecureXL is enabled).
4) Looks like your bonds are properly set up and are balancing traffic quite well between the underlying physical interfaces.
Assuming that the underlying packet loss is caused by RX-DRPs, you can't necessarily expect that RX-DRP will always be zero in a real network even on a well-tuned firewall. RX-OVR and RX-ERR however should be zero or extremely close to it for reasons that are explained in my book.
--
Second Edition of my "Max Power" Firewall Book
Now Available at http://www.maxpowerfirewalls.com
New Book: "Max Power 2026" Coming Soon
Check Point Firewall Performance Optimization
Check Point Firewall Performance Optimization
- Mark as New
- Bookmark
- Subscribe
- Mute
- Subscribe to RSS Feed
- Permalink
- Report Inappropriate Content
Wow Tim, thank you so much for the reply. We have been experiencing an elevated frequency of Internet packet loss throughout most of today. We have 15600s with 16 physical cores and 16 virtual cores (hyper threading is enabled). Current CoreXL configuration is 28 workers and 4 SNDs. I had mentioned that as part of the early troubleshooting we had manually set the sim affinity. CheckPoint TAC has recommended to change the CoreXL configuration to 24 workers and 8 SNDs which we made the change this afternoon. After making the CoreXL changes the sim affinity automatically put all the interfaces on CPU 0 so we manually assigned sim affinity. Current levels included in the Super 7 Performance Commands Output pasted below.
We have had many instances of the packet loss today before the CoreXL changes and we have had a few instances after the CoreXL changes so I don't think that helped the issue. Even with the packet loss today the sar -n EDEV output has all 0s in the output. I have run the ethtool -S on all the interfaces but I wasn't sure if I should include all 4 interfaces in the post since that may clutter it up.
Thanks for any further insight into this issue.
[Expert@xxxx]# fwaccel stat
Accelerator Status : on
Accept Templates : disabled by Firewall
Layer Policy_Name Security disables template offloads from rule #358
Throughput acceleration still enabled.
Drop Templates : disabled
NAT Templates : disabled by user
NMR Templates : enabled
NMT Templates : enabled
Accelerator Features : Accounting, NAT, Cryptography, Routing,
HasClock, Templates, Synchronous, IdleDetection,
Sequencing, TcpStateDetect, AutoExpire,
DelayedNotif, TcpStateDetectV2, CPLS, McastRouting,
WireMode, DropTemplates, NatTemplates,
Streaming, MultiFW, AntiSpoofing, Nac,
ViolationStats, AsychronicNotif, ERDOS,
McastRoutingV2, NMR, NMT, NAT64, GTPAcceleration,
SCTPAcceleration
Cryptography Features : Tunnel, UDPEncapsulation, MD5, SHA1, NULL,
3DES, DES, CAST, CAST-40, AES-128, AES-256,
ESP, LinkSelection, DynamicVPN, NatTraversal,
EncRouting, AES-XCBC, SHA256
----------------------------------------------------------------------------------------------------------------
[Expert@xxxx]# fwaccel stats -s
Accelerated conns/Total conns : 24893/142851 (17%)
Accelerated pkts/Total pkts : 43711937/466883732 (9%)
F2Fed pkts/Total pkts : 17172038/466883732 (3%)
PXL pkts/Total pkts : 405999757/466883732 (86%)
QXL pkts/Total pkts : 0/466883732 (0%)
----------------------------------------------------------------------------------------------------------------
[Expert@xxxx]# grep -c ^processor /proc/cpuinfo
32
----------------------------------------------------------------------------------------------------------------
[Expert@isus5:0]# fw ctl affinity -l -r
CPU 0: eth2-01
CPU 1: eth2-02
CPU 2: eth2-06
CPU 3: eth2-05
CPU 4: fw_23
rad usrchkd pdpd scanengine_k lpd in.geod mpdaemon in.acapd vpnd in.asessiond scanengine_b fwd in.msd pepd cprid cpd
CPU 5: fw_21
rad usrchkd pdpd scanengine_k lpd in.geod mpdaemon in.acapd vpnd in.asessiond scanengine_b fwd in.msd pepd cprid cpd
CPU 6: fw_19
rad usrchkd pdpd scanengine_k lpd in.geod mpdaemon in.acapd vpnd in.asessiond scanengine_b fwd in.msd pepd cprid cpd
CPU 7: fw_17
rad usrchkd pdpd scanengine_k lpd in.geod mpdaemon in.acapd vpnd in.asessiond scanengine_b fwd in.msd pepd cprid cpd
CPU 8: fw_15
rad usrchkd pdpd scanengine_k lpd in.geod mpdaemon in.acapd vpnd in.asessiond scanengine_b fwd in.msd pepd cprid cpd
CPU 9: fw_13
rad usrchkd pdpd scanengine_k lpd in.geod mpdaemon in.acapd vpnd in.asessiond scanengine_b fwd in.msd pepd cprid cpd
CPU 10: fw_11
rad usrchkd pdpd scanengine_k lpd in.geod mpdaemon in.acapd vpnd in.asessiond scanengine_b fwd in.msd pepd cprid cpd
CPU 11: fw_9
rad usrchkd pdpd scanengine_k lpd in.geod mpdaemon in.acapd vpnd in.asessiond scanengine_b fwd in.msd pepd cprid cpd
CPU 12: fw_7
rad usrchkd pdpd scanengine_k lpd in.geod mpdaemon in.acapd vpnd in.asessiond scanengine_b fwd in.msd pepd cprid cpd
CPU 13: fw_5
rad usrchkd pdpd scanengine_k lpd in.geod mpdaemon in.acapd vpnd in.asessiond scanengine_b fwd in.msd pepd cprid cpd
CPU 14: fw_3
rad usrchkd pdpd scanengine_k lpd in.geod mpdaemon in.acapd vpnd in.asessiond scanengine_b fwd in.msd pepd cprid cpd
CPU 15: fw_1
rad usrchkd pdpd scanengine_k lpd in.geod mpdaemon in.acapd vpnd in.asessiond scanengine_b fwd in.msd pepd cprid cpd
CPU 16: Mgmt
CPU 17: eth2-03
CPU 18: eth2-04
CPU 19: Sync
CPU 20: fw_22
rad usrchkd pdpd scanengine_k lpd in.geod mpdaemon in.acapd vpnd in.asessiond scanengine_b fwd in.msd pepd cprid cpd
CPU 21: fw_20
rad usrchkd pdpd scanengine_k lpd in.geod mpdaemon in.acapd vpnd in.asessiond scanengine_b fwd in.msd pepd cprid cpd
CPU 22: fw_18
rad usrchkd pdpd scanengine_k lpd in.geod mpdaemon in.acapd vpnd in.asessiond scanengine_b fwd in.msd pepd cprid cpd
CPU 23: fw_16
rad usrchkd pdpd scanengine_k lpd in.geod mpdaemon in.acapd vpnd in.asessiond scanengine_b fwd in.msd pepd cprid cpd
CPU 24: fw_14
rad usrchkd pdpd scanengine_k lpd in.geod mpdaemon in.acapd vpnd in.asessiond scanengine_b fwd in.msd pepd cprid cpd
CPU 25: fw_12
rad usrchkd pdpd scanengine_k lpd in.geod mpdaemon in.acapd vpnd in.asessiond scanengine_b fwd in.msd pepd cprid cpd
CPU 26: fw_10
rad usrchkd pdpd scanengine_k lpd in.geod mpdaemon in.acapd vpnd in.asessiond scanengine_b fwd in.msd pepd cprid cpd
CPU 27: fw_8
rad usrchkd pdpd scanengine_k lpd in.geod mpdaemon in.acapd vpnd in.asessiond scanengine_b fwd in.msd pepd cprid cpd
CPU 28: fw_6
rad usrchkd pdpd scanengine_k lpd in.geod mpdaemon in.acapd vpnd in.asessiond scanengine_b fwd in.msd pepd cprid cpd
CPU 29: fw_4
rad usrchkd pdpd scanengine_k lpd in.geod mpdaemon in.acapd vpnd in.asessiond scanengine_b fwd in.msd pepd cprid cpd
CPU 30: fw_2
rad usrchkd pdpd scanengine_k lpd in.geod mpdaemon in.acapd vpnd in.asessiond scanengine_b fwd in.msd pepd cprid cpd
CPU 31: fw_0
rad usrchkd pdpd scanengine_k lpd in.geod mpdaemon in.acapd vpnd in.asessiond scanengine_b fwd in.msd pepd cprid cpd
All:
----------------------------------------------------------------------------------------------------------------
[Expert@xxxx]# netstat -ni
Kernel Interface table
Iface MTU Met RX-OK RX-ERR RX-DRP RX-OVR TX-OK TX-ERR TX-DRP TX-OVR Flg
Mgmt 1500 0 0 0 0 0 0 0 0 0 BMU
Sync 1500 0 4 0 0 0 11 0 0 0 BMRU
bond1 1500 0 254300996 0 6 6 233477951 0 0 0 BMmRU
bond2 1500 0 219134251 0 12 12 240256222 0 0 0 BMmRU
eth2-01 1500 0 131466729 0 5 5 112578562 0 0 0 BMsRU
eth2-02 1500 0 107497629 0 8 8 123872361 0 0 0 BMsRU
eth2-03 1500 0 23810438 0 0 0 22063373 0 0 0 BMRU
eth2-04 1500 0 898454 0 0 0 11982994 0 0 0 BMRU
eth2-04.121 1500 0 898455 0 0 0 11982996 0 0 0 BMRU
eth2-05 1500 0 122834984 0 1 1 120899924 0 0 0 BMsRU
eth2-06 1500 0 111637136 0 4 4 116384564 0 0 0 BMsRU
lo 16436 0 56057 0 0 0 56057 0 0 0 LRU
----------------------------------------------------------------------------------------------------------------
[Expert@isus5:0]# fw ctl multik stat
ID | Active | CPU | Connections | Peak
----------------------------------------------
0 | Yes | 31 | 5736 | 8686
1 | Yes | 15 | 5739 | 8793
2 | Yes | 30 | 6223 | 9461
3 | Yes | 14 | 5948 | 9312
4 | Yes | 29 | 5633 | 8906
5 | Yes | 13 | 5823 | 8569
6 | Yes | 28 | 5065 | 8276
7 | Yes | 12 | 5817 | 9130
8 | Yes | 27 | 6247 | 9278
9 | Yes | 11 | 6083 | 9205
10 | Yes | 26 | 5450 | 9175
11 | Yes | 10 | 5527 | 8619
12 | Yes | 25 | 5579 | 8854
13 | Yes | 9 | 5572 | 8385
14 | Yes | 24 | 5031 | 8408
15 | Yes | 8 | 5206 | 8660
16 | Yes | 23 | 5975 | 9726
17 | Yes | 7 | 6065 | 9332
18 | Yes | 22 | 5971 | 9236
19 | Yes | 6 | 5315 | 9539
20 | Yes | 21 | 6269 | 9228
21 | Yes | 5 | 5903 | 8935
22 | Yes | 20 | 6167 | 9359
23 | Yes | 4 | 6449 | 8603
----------------------------------------------------------------------------------------------------------------
[Expert@xxxx]# cpstat os -f multi_cpu -o 1
Processors load
---------------------------------------------------------------------------------
|CPU#|User Time(%)|System Time(%)|Idle Time(%)|Usage(%)|Run queue|Interrupts/sec|
---------------------------------------------------------------------------------
| 1| 0| 11| 89| 11| ?| 89917|
| 2| 0| 10| 90| 10| ?| 89918|
| 3| 5| 10| 85| 15| ?| 89919|
| 4| 0| 12| 88| 12| ?| 89920|
| 5| 2| 9| 89| 11| ?| 89921|
| 6| 2| 9| 89| 11| ?| 89921|
| 7| 1| 9| 89| 11| ?| 89922|
| 8| 1| 10| 89| 11| ?| 89923|
| 9| 1| 13| 86| 14| ?| 89923|
| 10| 1| 12| 87| 13| ?| 89924|
| 11| 1| 12| 87| 13| ?| 89925|
| 12| 1| 10| 89| 11| ?| 89925|
| 13| 1| 12| 87| 13| ?| 89926|
| 14| 0| 11| 89| 11| ?| 89927|
| 15| 1| 11| 89| 11| ?| 89927|
| 16| 1| 11| 88| 12| ?| 89928|
| 17| 21| 1| 79| 21| ?| 89928|
| 18| 0| 3| 97| 3| ?| 89929|
| 19| 0| 2| 98| 2| ?| 89930|
| 20| 0| 0| 100| 0| ?| 89931|
| 21| 1| 9| 89| 11| ?| 89931|
| 22| 2| 9| 88| 12| ?| 89932|
| 23| 1| 9| 90| 10| ?| 89933|
| 24| 1| 10| 89| 11| ?| 89935|
| 25| 1| 12| 87| 13| ?| 89936|
| 26| 1| 11| 87| 13| ?| 89937|
| 27| 1| 12| 87| 13| ?| 89937|
| 28| 1| 11| 88| 12| ?| 89938|
| 29| 1| 11| 89| 11| ?| 89939|
| 30| 0| 10| 89| 11| ?| 89940|
| 31| 0| 10| 89| 11| ?| 89941|
| 32| 1| 12| 87| 13| ?| 89941|
---------------------------------------------------------------------------------
- Mark as New
- Bookmark
- Subscribe
- Mute
- Subscribe to RSS Feed
- Permalink
- Report Inappropriate Content
Hi Ed,
sar -n EDEV is showing zeroes since the occurrence of RX-DRP/RX-OVR is so low, more on this later...
We will need to see the ethool -S outputs for all 4 interfaces to determine if the nonzero counters are NIC overruns or ring buffer drops, feel free to zip them up and attach as a file. Also please provide the output of ethtool -g for the four physical interfaces, as I'm curious to see if TAC had you change the ring buffer size.
Please provide the output of enabled_blades as well, you have a high PXL percentage which may be justified depending on what blades are enabled. Even so you may have large amounts of traffic getting pulled into PXL unnecessarily or consuming excessive CPU while in there, so some optimizations there might help.
Even if the drops being reported by netstat -ni turn out to be RX-DRP (ring buffer misses), the packet loss rate for the statistics you provided is approximately 0.0000055%. There is simply no way that you would notice this amount of packet loss in your production traffic so there must be something else going on if you are seeing noticeable slowdowns. While focusing on nonzero RX-DRP values seems like a good place to start, that loss rate is far too low to explain what you are seeing. In my experience RX-DRP percentages of 0.1% or higher cause noticeable performance impact.
--
Second Edition of my "Max Power" Firewall Book
Now Available at http://www.maxpowerfirewalls.com
New Book: "Max Power 2026" Coming Soon
Check Point Firewall Performance Optimization
Check Point Firewall Performance Optimization
- Mark as New
- Bookmark
- Subscribe
- Mute
- Subscribe to RSS Feed
- Permalink
- Report Inappropriate Content
Hi Tim.
I have attached the ethtool -S and -g output for all 4 interfaces as a zip file. TAC did not have us change any ring buffer size.
# enabled_blades
fw vpn urlf av appi ips identityServer anti_bot ThreatEmulation vpn
I will go into a little bit of blades background to maybe help explain where we have come from and try to relate when the packet loss issue was first noticed seems to be around the time we added Antibot, Antivirus, and ThreatEmulation into a Threat Prevention policy. Antibot, Antivirus, and ThreatEmulation had been active blades but not part of a Threat Prevention policy. We came from Nokia IPSO to our current 15600s. On the Nokia we had turned on IPS to make use of Geo Policy with IPS using Default_Protection Profile with everything set to detect. We have another vendor IPS product at the moment but hope to transfer that over to the CheckPoint once we get the packet loss stable. The Antibot, Antivirus, and ThreatEmulation are set to detect mode and then around July we removed IPS policy (that came in as a separate ThreatPrevention layer when upgraded to 80.10) and added a new profile that included IPS, Antibot, Antivirus, and Threat Emulation all included in one profile set to recommended profile. It seemed to be soon after that the packet loss was noticed. We ended up removing the Antibot, Antivirus, and ThreatEmulation from the profile and keeping IPS with same settings as we had in R77. Packet loss has never gone completely away since July with some high levels of it occurring from time to time (today was one of those days). Those items were removed from profile but blades are still enabled. I am not sure if any of this has relation to the packet loss but thought I would share.
We are using application control with a few rate limit rules and drop rules for some application categories. We started using application control after R80.10 to help control user browsing demands of streaming media and other high demand (gaming, streaming audio, etc.) Internet destinations.
Identity Server is being used and working with an Identity Collector. We are not really doing any rules based off Identity Awareness but more for reporting aspect at this time.
We do not use ipsec vpn on the CheckPoint and have not for many years. We
Hope this extra information may be of some value.
Many Many Thanks!
- Mark as New
- Bookmark
- Subscribe
- Mute
- Subscribe to RSS Feed
- Permalink
- Report Inappropriate Content
OK now we are getting somewhere. Let's use the ethtool output for eth2-01 as as an example, relevant counters are:
rx_no_buffer_count: 927
rx_missed_errors: 33
rx_fifo_errors: 33
rx_packets: 491826829
tx_flow_control_xon: 177
tx_flow_control_xoff: 206
First off Ed can you confirm that the rx_missed_errors/rx_fifo_errors values reported by ethtool -S correspond to the RX-DRP/RX-OVR values reported by netstat -ni in lockstep for that interface? These values represent the actual number of frames dropped. Once again that value seems way too low on a percentage basis to fully explain the performance hit you are seeing. Are you sure that the packet loss is the sole cause of the slowdowns and not increased latency or jitter?
As you saw earlier the NIC card is indeed sending pause/xoff frames to the Cisco switch. By default though the Cisco will ignore these and keep right on sending anyway. Flow control is on by default on a Check Point firewall. The question about whether to enable flow control on both sides is a bit controversial, as introducing a new flow control mechanism may conflict with TCP's congestion avoidance algorithm and cause some odd performance effects such as 'head of line' blocking. However doing so might be a good way to establish that this trivial amount of packet loss is not the main cause of the slowdowns, as I strongly suspect they will continue even after the packet loss is resolved.
Given the great information you provided about your use of various blades, I'm suspecting that you may have elephant flows passing through PXL and various Firewall Worker cores are getting CPU spiked during the slowdowns. I'd suggest checking out cpview's history mode via the -t option on the gateway and step back into the time period where slowdowns were occurring. Is there excessive CPU load on your SND/IRQ cores (0-3, 16-19) or the Firewall Worker Cores (4-15, 20-31)? This will provide a major clue about where to look next.
My suspicion is that you will see one or more Firewall Worker cores getting spiked during the slowdowns. If so, given your history with the various Threat Prevention blades I'd suggest the following:
Run command ips off and leave the gateway in that state for awhile. Do any more slowdowns occur? If they seem to stop that suggests some IPS tuning is needed, as even running signatures in Detect mode can cause a lot of overhead.
If slowdowns still occur next run fw amw unload and leave the gateway in that state for awhile. Do any more slowdowns occur? If they seem to stop that suggests some TP policy tuning is needed.
Note that the above commands completely disable IPS and TP respectively, and may expose your network to attacks. For more information about the commands please see my CPX presentation here:
I suspect your IPS/TP config is the real issue here.
--
Second Edition of my "Max Power" Firewall Book
Now Available at http://www.maxpowerfirewalls.com
New Book: "Max Power 2026" Coming Soon
Check Point Firewall Performance Optimization
Check Point Firewall Performance Optimization
- Mark as New
- Bookmark
- Subscribe
- Mute
- Subscribe to RSS Feed
- Permalink
- Report Inappropriate Content
Hi Tim.
We checked and flow control was on both CheckPoint and Cisco Switch side. We have taken flow control off of the Cisco Switch side and still have seen a couple of packet loss events.
Cpview history is shows pretty constant usage for all CPUs except for CPU 16 and 17. They see the lower Idle % from time to time but these times do not always line up to the packet loss. CPU 16 has hit 90% usage at times but not quite around the packet loss times.
If we turn off IPS will that affect the Geo Policy? I think in 80.10 Geo Policy is separated from IPS but not positive. Geo Policy was the main reason we turned on the IPS in R77 a couple years ago.
We are not currently using (as far as aware of in policy) Antibot, Antivirus, or ThreatEmulation. What all does fw amw unload turn off?
Thanks.
-Ed
- Mark as New
- Bookmark
- Subscribe
- Mute
- Subscribe to RSS Feed
- Permalink
- Report Inappropriate Content
Geo Policy is separate from IPS on R80.10 gateway so the ips off command will not impact it. Doubtful Geo Policy is the source of the problem.
fw amw unload turns off the other four blades of TP (av/abot/temu/text).
If the slowdowns are happening often enough, I say go for broke and try running these commands in the middle of the slowdown and see if it immediately abates.
If there is no effect, next step is to disable the apcl and urlf blades on the gateway object and see if the slowdowns no longer happen.
New Book: "Max Power 2026" Coming Soon
Check Point Firewall Performance Optimization
Check Point Firewall Performance Optimization
- Mark as New
- Bookmark
- Subscribe
- Mute
- Subscribe to RSS Feed
- Permalink
- Report Inappropriate Content
Hi Tim.
We discovered a couple of things this afternoon. I tested running the ips off and fw amw unload during some packet loss times but neither made any difference. We found that the fwaccel stats -s showed PXL pretty high at 90% and Accelerated around high teens. We decided to completely disable Antibot, Antivirus, and Threat Emulation blades from the cluster object since we were not actively using them in Threat Prevention Policy and then pushed policy. The PXL stats started to come down some and Accelerated started going up some.
It was also discovered that the pdpd was coring (crashing) frequently causing gzip to consume high CPU which in turn was causing the different CPU cores to hit 100%. Watching cvpiew Overview the CPU cores for our busy inside or outside interfaces would hit 100%. Cpview was showing under Network – Traffic – Drops a very high number that would go up of Instance high CPU. Also cpview was showing under CPU – Overview the Interrupts were very high for CPU 0 and 1 compared to all other CPU Interrupts. This was not ideal either. We were not seeing packet loss every time there was a 100% CPU core but it wasn’t good at the rate they were happening. After this discovery TAC recommended we go from R80.10 Take 85 to Take 154 which there have been some Identity Awareness fixes. After installing Take 154 and disabling the 3 TP blades the Instance high CPU has remained 0. Fwaccel stats -s has been showing around 35% for Accelerated conns, around 20% Accelerated pkts, and around 70% for PXL. There have not been any drops since these changes and Jumbo HotFix but we are continuing to monitor closely.
I am not sure if we fixed the overall packet loss issue that was happening with less frequency until this week or if fixed the more frequent packet loss maybe due to the pdpd service coring. I cannot say if the pdpd service has been running high or not since the packet loss was noticed in July. Time will tell if we may have gotten the overall packet loss under control.
We have been considering using some of these blades (IPS and HTTPS inspection for URL Filtering in particular) to consolidate these under one hood and remove the other vendor appliances we have performing those functions. I am hoping we don’t get to the point of having to disable app control and url filter to further test. If disabling some of these blades helps the performance and packet loss it will be tough to have confidence in being able to use our gateway for any or all of these services. When we got the 15600 it was with the intention of utilizing a lot of the blades and was supposedly sized with those intentions in mind.
Do you know if Geo Policy will still work if the IPS blade is disabled (unchecked from cluster object)?
- Mark as New
- Bookmark
- Subscribe
- Mute
- Subscribe to RSS Feed
- Permalink
- Report Inappropriate Content
The recommendation to disable IPS/TP/APCL/URLF was for testing purposes only. Once the culprit is identified, the policy rules and configuration for that blade can be tuned to eliminate the slowdown issue. The blades work great once tuned up for a specific environment so please don't get the impression that I recommended turning them off permanently, or that they are not viable for use in production.
Typical process execution in process/user space (us) never impacts the availability of CPU slices to kernel drivers such as INSPECT & SND/SecureXL, since kernel drivers can always preempt a process if they want the CPU and frankly the processes can starve to death for all the kernel cares. However if a process is coring over and over I believe the kernel has to be involved in system space (sy) with the constant cleanup of the crashed process, so that could most definitely compete with other drivers trying to utilize the CPU to perform their functions and cause performance issues.
Geo Policy will work just fine with IPS disabled on an R80.10 gateway because Geo Policy is part of the Access Policy starting in R80.10.
More and more it sounds to me like the packet loss is a red herring and just another symptom of the slowdowns (basically the inability to process packets in a timely fashion), and the high CPU load caused by pdpd coring and/or the blade configurations is the actual cause.
--
Second Edition of my "Max Power" Firewall Book
Now Available at http://www.maxpowerfirewalls.com
New Book: "Max Power 2026" Coming Soon
Check Point Firewall Performance Optimization
Check Point Firewall Performance Optimization
- Mark as New
- Bookmark
- Subscribe
- Mute
- Subscribe to RSS Feed
- Permalink
- Report Inappropriate Content
Hi Tim.
After the Jumbo HotFix Take154 we have had a full day without any packet loss. We have been closely watching fwaccel stats -s and cpview throughout the day.
Acceleration example.
# fwaccel stats -s
Accelerated conns/Total conns : 22896/79721 (28%)
Accelerated pkts/Total pkts : 78484180/590832986 (13%)
F2Fed pkts/Total pkts : 13850206/590832986 (2%)
PXL pkts/Total pkts : 498498600/590832986 (84%)
QXL pkts/Total pkts : 0/590832986 (0%)
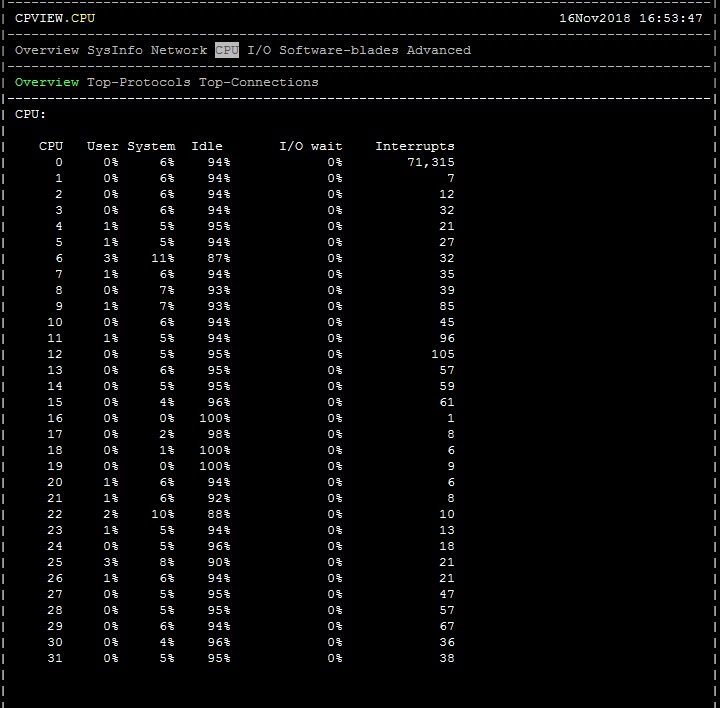
None of the CPUs hit 100% today or go over 20%. I do see that the Interrupts on CPU0 is far higher than all the other CPUs (I have attached a screen shot). All the other CPU interrupts seem to stay closer together in number but far lower than the CPU0. I am not sure if this is expected behavior or not.
I agree with correct tuning the gateways should be able to handle what we throw at it. I feel pretty good about not seeing the packet loss events today but I also want to continue to look for areas of improvement or further tuning that would help the gateways to perform optimally.
I appreciate all your input and knowledge.
- Mark as New
- Bookmark
- Subscribe
- Mute
- Subscribe to RSS Feed
- Permalink
- Report Inappropriate Content
Hi Ed,
I don't see the screenshot you attached, and wouldn't worry about the high level of interrupts on CPU 0 since that is where a lot of default OS interrupt handling tends to happen. You can do a cat /proc/interrupts to see where all those interrupts are coming from if you are interested.
--
Second Edition of my "Max Power" Firewall Book
Now Available at http://www.maxpowerfirewalls.com
New Book: "Max Power 2026" Coming Soon
Check Point Firewall Performance Optimization
Check Point Firewall Performance Optimization
- Mark as New
- Bookmark
- Subscribe
- Mute
- Subscribe to RSS Feed
- Permalink
- Report Inappropriate Content
Hi Guys, can anyone give me advise regarding this dropped and overrun packet. The issues previously have causing incorrect state on secondary cluster. After checking few details for Sync interface, I suspect the problem only occured on the secondary cluster Sync interface. I share with you guys the output that I collected.
# ifconfig Sync
Sync Link encap:Ethernet HWaddr 00:1C:7F:43:5B:11
inet addr:10.9.0.8 Bcast:10.9.0.255 Mask:255.255.255.0
UP BROADCAST RUNNING MULTICAST MTU:1500 Metric:1
RX packets:915995684 errors:0 dropped:2 overruns:2 frame:0
TX packets:1784234902 errors:0 dropped:0 overruns:0 carrier:0
collisions:0 txqueuelen:1000
RX bytes:705163510274 (656.7 GiB) TX bytes:171062081250 (159.3 GiB)
# ethtool -S Sync
NIC statistics:
rx_packets: 1091276685
tx_packets: 1869584632
rx_bytes: 852909541803
tx_bytes: 186762035242
rx_broadcast: 44662992
tx_broadcast: 34070334
rx_multicast: 1025076349
tx_multicast: 1822883085
multicast: 1025076349
collisions: 0
rx_crc_errors: 0
rx_no_buffer_count: 39
rx_missed_errors: 3
tx_aborted_errors: 0
tx_carrier_errors: 0
tx_window_errors: 0
tx_abort_late_coll: 0
tx_deferred_ok: 0
tx_single_coll_ok: 0
tx_multi_coll_ok: 0
tx_timeout_count: 0
rx_long_length_errors: 0
rx_short_length_errors: 0
rx_align_errors: 0
tx_tcp_seg_good: 0
tx_tcp_seg_failed: 0
rx_flow_control_xon: 0
rx_flow_control_xoff: 0
tx_flow_control_xon: 31
tx_flow_control_xoff: 34
rx_long_byte_count: 852909541803
tx_dma_out_of_sync: 0
lro_aggregated: 0
lro_flushed: 0
lro_recycled: 0
tx_smbus: 0
rx_smbus: 0
dropped_smbus: 0
os2bmc_rx_by_bmc: 0
os2bmc_tx_by_bmc: 0
os2bmc_tx_by_host: 0
os2bmc_rx_by_host: 0
rx_errors: 0
tx_errors: 0
tx_dropped: 0
rx_length_errors: 0
rx_over_errors: 0
rx_frame_errors: 0
rx_fifo_errors: 3
tx_fifo_errors: 0
tx_heartbeat_errors: 0
tx_queue_0_packets: 1869584632
tx_queue_0_bytes: 178684946880
tx_queue_0_restart: 0
rx_queue_0_packets: 1091276685
rx_queue_0_bytes: 848544435063
rx_queue_0_drops: 0
rx_queue_0_csum_err: 0
rx_queue_0_alloc_failed: 0
# netstat -ni
Kernel Interface table
Iface MTU Net RX-OK RX-ERR RX-DRP RX-OVR TX-OK TX-ERR TX-DRP TX-OVR Flg
Sync 1500 0 1091262103 0 3 3 1869580819 0 0 0 BMRU
Any idea on what can I do to make the dropped and overrun packet become 0 ?
Thanks
- Mark as New
- Bookmark
- Subscribe
- Mute
- Subscribe to RSS Feed
- Permalink
- Report Inappropriate Content
Those RX-DRP/RX-OVR numbers are negligible compared to the number of frames successfully received, and highly unlikely to be causing your problem.
--
"IPS Immersion Training" Self-paced Video Class
Now Available at http://www.maxpowerfirewalls.com
New Book: "Max Power 2026" Coming Soon
Check Point Firewall Performance Optimization
Check Point Firewall Performance Optimization
- Mark as New
- Bookmark
- Subscribe
- Mute
- Subscribe to RSS Feed
- Permalink
- Report Inappropriate Content
Hi Timothy,
Last time the RX-DRP/RX-OVR numbers are quit high and causing incorrect state on secondary cluster whereby the secondary cluster trying to be the active gateway when checking HA status at secondary cluster it shows primary Down and Secondary active. Right now it becomes back to normal. Is there possibilities that it is cause from performance ability ? I'm trying to find the root cause if you have any idea about it.
Thanks
- Mark as New
- Bookmark
- Subscribe
- Mute
- Subscribe to RSS Feed
- Permalink
- Report Inappropriate Content
Those counters are almost certainly not the root cause of your issue. Next time the cluster gets into that state, run these commands:
cphaprob -a if
cphaprob -l list
cphaprob state
In R80.20+ cphaprob state shows the reason for the last cluster transition which is quite handy...
--
"IPS Immersion Training" Self-paced Video Class
Now Available at http://www.maxpowerfirewalls.com
New Book: "Max Power 2026" Coming Soon
Check Point Firewall Performance Optimization
Check Point Firewall Performance Optimization
Leaderboard
Epsum factorial non deposit quid pro quo hic escorol.
| User | Count |
|---|---|
| 13 | |
| 7 | |
| 5 | |
| 3 | |
| 2 | |
| 1 | |
| 1 | |
| 1 | |
| 1 | |
| 1 |
Upcoming Events
Tue 28 Jul 2026 @ 11:00 AM (EDT)
Under the Hood - Check Point and Illumio – Modern Network Defense Against AI-Based ThreatsWed 29 Jul 2026 @ 12:00 PM (SGT)
The AI Security Report 2026: A Turning Point for Enterprise Defense - SGTWed 29 Jul 2026 @ 02:00 PM (IDT)
The AI Security Report 2026: A Turning Point for Enterprise Defense - AMERWed 29 Jul 2026 @ 03:00 PM (CEST)
The AI Security Report 2026: A Turning Point for Enterprise Defense EMEATue 28 Jul 2026 @ 11:00 AM (EDT)
Under the Hood - Check Point and Illumio – Modern Network Defense Against AI-Based ThreatsWed 29 Jul 2026 @ 12:00 PM (SGT)
The AI Security Report 2026: A Turning Point for Enterprise Defense - SGTWed 29 Jul 2026 @ 02:00 PM (IDT)
The AI Security Report 2026: A Turning Point for Enterprise Defense - AMERWed 29 Jul 2026 @ 03:00 PM (CEST)
The AI Security Report 2026: A Turning Point for Enterprise Defense EMEAThu 30 Jul 2026 @ 10:00 AM (PDT)
AI Security Masters E12: READY OR NOT: Securing the AI Enterprise 4/5 - AI GatewayThu 20 Aug 2026 @ 08:30 AM (COT)
Medellin: Workspace Evolution: Hybrid Mesh Management - Visibilidad, Automatización e IAThu 20 Aug 2026 @ 06:00 PM (COT)
Medellin: Workspace Intelligence: IA Generativa en Acción para Equipos de SeguridadAbout CheckMates
Learn Check Point
Advanced Learning
YOU DESERVE THE BEST SECURITY

©1994-2026 Check Point Software Technologies Ltd. All rights reserved.
Copyright
Privacy Policy
About Us
UserCenter