- Products
- Learn
- Local User Groups
- Partners
- More

This website uses Cookies. Click Accept to agree to our website's cookie use as described in our Privacy Policy. Click Preferences to customize your cookie settings.
- Products
- Learn
- Local User Groups
- Upcoming Events
- Americas
- EMEA
- Czech Republic and Slovakia
- Denmark
- Netherlands
- Germany
- Sweden
- United Kingdom and Ireland
- France
- Spain
- Norway
- Ukraine
- Baltics and Finland
- Greece
- Portugal
- Austria
- Kazakhstan and CIS
- Switzerland
- Romania
- Turkey
- Belarus
- Belgium & Luxembourg
- Russia
- Poland
- Georgia
- DACH - Germany, Austria and Switzerland
- Iberia
- Africa
- Adriatics Region
- Eastern Africa
- Israel
- Nordics
- Middle East and Africa
- Balkans
- Italy
- Bulgaria
- Cyprus
- APAC
- Partners
- More
- ABOUT CHECKMATES & FAQ
- Sign In
- Leaderboard
- Events
On-Premises SD-WAN Management
Register HereThe industry's first AI Network Firewall
Securing AI traffic, everywhere
AI Security Masters E8:
Claude Mythos: New Era in Cyber Security
CheckMates Go:
No Attack Required
Turn on suggestions
Auto-suggest helps you quickly narrow down your search results by suggesting possible matches as you type.
Showing results for
- CheckMates
- :
- Products
- :
- General Topics
- :
- Re: High CPU Load while packets processed through ...
Options
- Subscribe to RSS Feed
- Mark Topic as New
- Mark Topic as Read
- Float this Topic for Current User
- Bookmark
- Subscribe
- Mute
- Printer Friendly Page
Turn on suggestions
Auto-suggest helps you quickly narrow down your search results by suggesting possible matches as you type.
Showing results for
Are you a member of CheckMates?
×
Sign in with your Check Point UserCenter/PartnerMap account to access more great content and get a chance to win some Apple AirPods! If you don't have an account, create one now for free!
- Mark as New
- Bookmark
- Subscribe
- Mute
- Subscribe to RSS Feed
- Permalink
- Report Inappropriate Content
Jump to solution
High CPU Load while packets processed through slow path
Hello community,
we moved to R80 in February and since then from time to time we receive alert Mail from our SMS (R80.30) that it lost connection to the active gateway of our Check Point Cluster (R80.10).
The result of my investigation was a high CPU Load (100%) on all cores due to high load on the fw_worker processes across this period.
This issue had impact to all parts of the network which are routed through the firewall. We had increased latency in the network and our SMS couldn't get data from the fw node. That is why we have a brake in the graph of SmartView Monitor and had to investigate on the affected node.
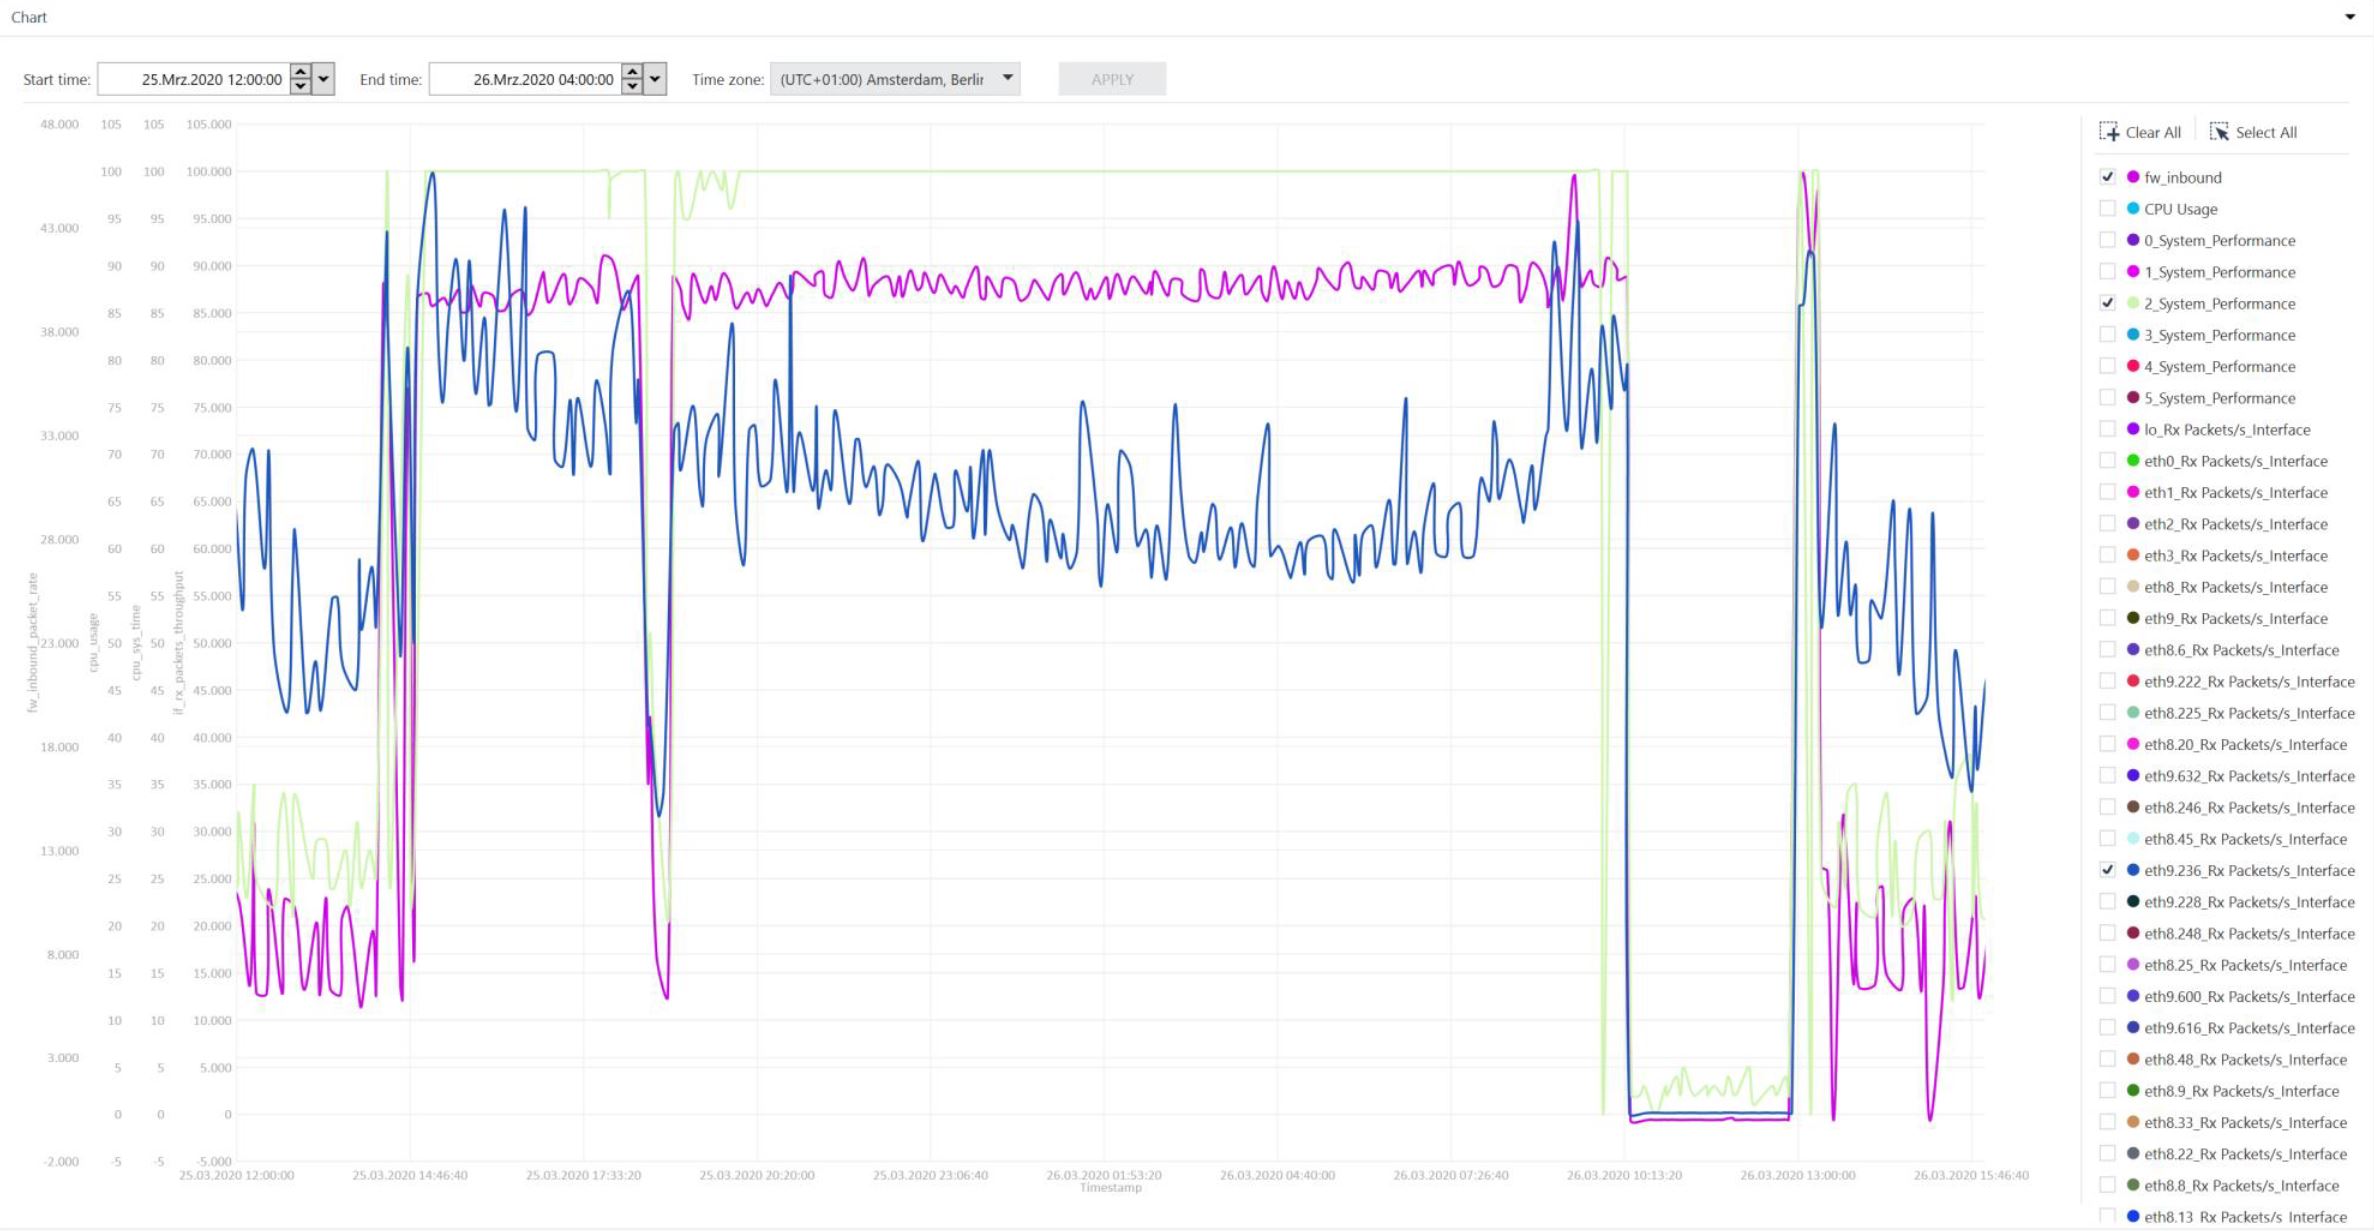
In the affected period I recognized an increased amount of inbound packets/sec on our external interface with CPVIEW history. Futhermore I saw also a rise of packets/sec handled by slow path (FW). The amount of inbound packets on the external interface and packets handled by slow path are quite close.
I created a CPInfo file with export of the CPVIEW History for visualization and compared the graph of fw_inbound packets and system_performance and they correlate.
That leads me to the conclusion that the packets has been inspected by default inspection but i'm not able to find information about inspected packets in the logging and although dynamic dispatcher is active, in CPVIEW no Top-Connections are listet under CPVIEW.CPU.Top-Connections.
I'm not sure how to find the connections that was responsible to that behaviour.
Here some values of CPVIEW of the second before and while high CPU load.
CPVIEW.Overview 25Mar2020 14:17:46
|---------------------------------------|
| Num of CPUs: 6 |
| CPU Used |
| 2 45% |
| 1 44% |
| 3 40% |
|---------------------------------------|
| CPU: |
| CPU User System Idle I/O wait Interrupts |
| 0 0% 25% 75% 0% 41,234 |
| 1 12% 32% 56% 0% 41,234 |
| 2 17% 28% 55% 0% 41,234 |
| 3 13% 27% 60% 0% 41,234 |
| 4 0% 1% 99% 0% 41,234 |
| 5 0% 0% 100% 0% 41,234
|---------------------------------------|
| Traffic Rate: |
| Total FW PXL SecureXL |
| Inbound packets/sec 155K 9,255 1,432 145K |
| Outbound packets/sec 156K 9,805 1,432 145K |
| Inbound bits/sec 958M 6,380K 10,354K 941M |
| Outbound bits/sec 1,002M 33,917K 10,537K 958M |
CPVIEW.Overview 25Mar2020 14:17:47
|---------------------------------------|
| Num of CPUs: 6 |
| CPU Used |
| 1 89% |
| 2 89% |
| 3 89% |
|---------------------------------------|
| CPU: |
| CPU User System Idle I/O wait Interrupts |
| 0 0% 29% 71% 0% 39,075 |
| 1 22% 67% 10% 0% 39,075 |
| 2 4% 85% 11% 0% 39,075 |
| 3 3% 86% 11% 0% 39,075 |
| 4 0% 0% 100% 0% 39,075 |
| 5 0% 0% 100% 0% 39,075 |
|---------------------------------------|
| Traffic Rate: |
| Total FW PXL SecureXL |
| Inbound packets/sec 182K 30,459 1,032 150K |
| Outbound packets/sec 157K 5,877 1,032 150K |
| Inbound bits/sec 1,010M 12,437K 7,394K 991M |
| Outbound bits/sec 1,040M 24,715K 7,526K 1,008M |
I also attached the graph of CPU-Load (one core), fw_inbound, RX on external interface.
I did a manual failover to see if the cpu load is just an issue of one node. You can see it in the graph.
The load suddenly went down at around 13:15 at the 26 of march.
I hope you have ideas for further investigation or preventing this. I thought about creating an own inspection profile and set the most actions to inactive.
Thanks in advance and best regards. Stay healthy
Martin Reppich
System Administrator
Helmholtz-Zentrum Potsdam
Deutsches GeoForschungsZentrum GFZ
1 Solution
Accepted Solutions
- Mark as New
- Bookmark
- Subscribe
- Mute
- Subscribe to RSS Feed
- Permalink
- Report Inappropriate Content
> And maybe it's useful to say that we have a public class B network.
Oooof, yep you are going to have a lot of drops from all the background noise crap of the Internet with a potential attack surface of that size. Looking at your screenshots confirms that you have lots of drops coming in from the Internet. This is a common issue, here is what you need to do:
1) If possible, configure Geo Policy in a blacklist configuration to drop traffic to/from countries that your organization has no business talking to.
Geo Policy drops happen very early in INSPECT processing (right after antispoofing), and can substantially lower CPU usage (I've seen CPU load dive 30% after configuring it with clients like yourself who have a large block of Internet-routable addresses). Normally I'd suggest using Geo Updatable Objects here instead, but support for those was added in R80.20 and you're still on R80.10 gateway. Depending on the scope and geographic reach of your organization using Geo Policy may not be feasible though. Edit: Be sure to define a Geo Policy exception for DNS traffic (both TCP and UDP port 53) to avoid some rather random-looking DNS problems that can result, this nasty situation was covered on pages 280-281 of my latest book)
2) Enable the SecureXL penalty box. The default is to penalty-box an IP address with 500+ drops/sec for a period of 3 minutes, and only for traffic on the external interface. I'd suggest enabling it with the default settings and see how it behaves for a week or so; assuming it doesn't break anything in production with the defaults, in the real world I usually tweak down the threshold from 500 drops down to the 200 range or so with no adverse impacts. Do not attempt to use the optimized drops feature as it is much older.
3) Over time if you have repeat offenders that keep getting tossed in the penalty box, create an explicit rule at the top of your rulebase that matches these bad actors and silently drops them with no logging.
Let us know how it goes...
New Book: "Max Power 2026" Coming Soon
Check Point Firewall Performance Optimization
Check Point Firewall Performance Optimization
28 Replies
- Mark as New
- Bookmark
- Subscribe
- Mute
- Subscribe to RSS Feed
- Permalink
- Report Inappropriate Content
- Mark as New
- Bookmark
- Subscribe
- Mute
- Subscribe to RSS Feed
- Permalink
- Report Inappropriate Content
Hello Wolfgang,
it's open server hardware.
We use two IBM x3550 M4.
Best regards
Martin
- Mark as New
- Bookmark
- Subscribe
- Mute
- Subscribe to RSS Feed
- Permalink
- Report Inappropriate Content
I think CoreXL balances the per connection, so a high CPU usage on all cores would rule out one elephant connection causing the problem. Something like a parallel download of windows updates maybe, but i can't explain why this suddenly a problem with R80.10. I'd upgrade to R80.30 if possible and definitly fine-tune your thread prevention profile. An application control rule to limit non-essential apps like twitch, youtube and spotify to 50mbit also works wonders sometimes.
I assume you're using an open server with 6 cores, licensed for 4 cores, right? Can you post the output of "enabled_blades" and "fwaccel stats -s" please?
I assume you're using an open server with 6 cores, licensed for 4 cores, right? Can you post the output of "enabled_blades" and "fwaccel stats -s" please?
- Mark as New
- Bookmark
- Subscribe
- Mute
- Subscribe to RSS Feed
- Permalink
- Report Inappropriate Content
Hi Benedikt,
yes we use open server hardware (IBM x3550 M4) and have licensed 4 cores.
Currently we don't use any threat prevention. Here are the outputs you asked for.
[Expert@gw2:0]# enabled_blades
fw vpn mon vpn
[Expert@gw2:0]# fwaccel stats -s
Accelerated conns/Total conns : 24367/32954 (73%)
Accelerated pkts/Total pkts : 51251182933/57415297311 (89%)
F2Fed pkts/Total pkts : 6074120093/57415297311 (10%)
PXL pkts/Total pkts : 89994285/57415297311 (0%)
QXL pkts/Total pkts : 0/57415297311 (0%)
Kind regards
Martin
- Mark as New
- Bookmark
- Subscribe
- Mute
- Subscribe to RSS Feed
- Permalink
- Report Inappropriate Content
Hi @Martin_Reppich,
You can see that the main part of the packets goes through the SecureXL past path red marked.
| Traffic Rate: |
| Total FW PXL SecureXL |
| Inbound packets/sec 155K 9,255 1,432 145K |
| Outbound packets/sec 156K 9,805 1,432 145K |
| Inbound bits/sec 958M 6,380K 10,354K 941M |
| Outbound bits/sec 1,002M 33,917K 10,537K 958M |

More to firewall path F2F, PXL, Acceleration path read here in my article:
RIt could also be elephant flows!80.x - Security Gateway Architecture (Logical Packet Flow)
Please could you provide the following information. Then I can be more specific.
# fwaccel stats
# fw ctl affinity -l
# top | grep fw_worker
Do you use 10GBit/s or 1 GBit/s interfaces?
With 1 GBit/s interfaces, your interface can be busy (red).
Inbound bits/sec 958M 6,380K 10,354K 941M
| Outbound bits/sec 1,002M 33,917K 10,537K 958M
Provide infos to nic errors:
# netstat -in
With 10GBit/s interfaces enable multi queueing. More read here: R80.x - Performance Tuning Tip - Multi Queue
To reduce the load on the CoreXL instances, you can do the following:
- use IPS default profile (only events with no performnce impact)
- use IPS only to and from the internet
- optimize av, anti-bot, https interception,...
It could also be elephant flows!
The big question is, how do you found elephat flows on an R80 gateway?
Evaluation of heavy connections (epehant flows)
A first indication is a high CPU load on a core if all other cores have a normal CPU load. This can be displayed very nicely with "top". Ok, now a core has 100% CPU usage. What can we do now? For this there is a SK105762 to activate "Firewall Priority Queues". This feature allows the administrator to monitor the heavy connections that consume the most CPU resources without interrupting the normal operation of the Firewall. After enabling this feature, the relevant information is available in CPView Utility. The system saves heavy connection data for the last 24 hours and CPDiag has a matching collector which uploads this data for diagnosis purposes.
Heavy connection flow system definition on Check Point gateways:
- Specific instance CPU is over 60%
- Suspected connection lasts more than 10s
- Suspected connection utilizes more than 50% of the total work the instance does. In other words, connection CPU utilization must be > 30%
Enable the monitoring of heavy connections.
To enable the monitoring of heavy connections that consume high CPU resources:
# fw ctl multik prioq 1
# reboot
Found heavy connection on the gateway with print_heavy connections“
On the system itself, heavy connection data is accessible using the command:
# fw ctl multik print_heavy_conn
Found heavy connection on the gateway with cpview
# cpview CPU > Top-Connection > InstancesX
More read here:
R80.x - Performance Tuning Tip - Elephant Flows (Heavy Connections)
➜ CCSM Elite, CCME, CCTE, CCVS ➜ www.checkpoint.tips
- Mark as New
- Bookmark
- Subscribe
- Mute
- Subscribe to RSS Feed
- Permalink
- Report Inappropriate Content
at first thanks for detailed reply.
I agree with you that most of the packets goes through SecureXL fast path.
You refered to the output of CPVIEW Traffic Rate when the cpu utilization was fine.
In my second output with traffic rate also most of the packets go through SecureXL fast path but additionaly the packet rate for slow path is increased and after reading serveral posts regarding high cpu load i thought this probably is the reason in a kind of way.
We use two 10Bit/s interfaces with VLANs where the most traffic went through and four dedicated 1GBit/s interfaces without VLANs.
We don't use any threat prevention only the default inspection which is installed with the access policy is active.
Here are the outputs you asked for.
[Expert@gw2:0]# enabled_blades
fw vpn mon vpn
[Expert@gw2:0]# fwaccel stats
Name Value Name Value
-------------------- --------------- -------------------- ---------------
Accelerated Path
------------------------------------------------------------------------------
accel packets 51409121939 accel bytes 35156919263700
conns created 301133996 conns deleted 180397325
C total conns 32193 C templates 0
C TCP conns 23063 C delayed TCP conns 0
C non TCP conns 9130 C delayed nonTCP con 0
conns from templates 3272 temporary conns 15524747
nat conns 5879735 dropped packets 3603731
dropped bytes 302928490 nat templates 0
port alloc templates 0 conns from nat tmpl 0
port alloc conns 0 conns auto expired 105182996
Accelerated VPN Path
------------------------------------------------------------------------------
C crypt conns 32 enc bytes 1143833360
dec bytes 27895854656 ESP enc pkts 13239884
ESP enc err 42 ESP dec pkts 22706430
ESP dec err 0 ESP other err 40
AH enc pkts 0 AH enc err 0
AH dec pkts 0 AH dec err 0
AH other err 0 espudp enc pkts 0
espudp enc err 0 espudp dec pkts 0
espudp dec err 0 espudp other err 0
Medium Path
------------------------------------------------------------------------------
PXL packets 90048662 PXL async packets 90073798
PXL bytes 67374416312 C PXL conns 40
C PXL templates 0 PXL FF conns 0
PXL FF packets 0 PXL FF bytes 0
PXL FF acks 0
Accelerated QoS Path
------------------------------------------------------------------------------
QXL packets 0 QXL async packets 0
QXL bytes 0 C QXL conns 0
C QXL templates 0
Firewall Path
------------------------------------------------------------------------------
F2F packets 6090346522 F2F bytes 458028184070
C F2F conns 8671 TCP violations 22964531
C partial conns 0 C anticipated conns 0
port alloc f2f 0 C no-match ranges 0
GTP
------------------------------------------------------------------------------
gtp tunnels created 0 gtp tunnels 0
gtp accel pkts 0 gtp f2f pkts 0
gtp spoofed pkts 0 gtp in gtp pkts 0
gtp signaling pkts 0 gtp tcpopt pkts 0
gtp apn err pkts 0
General
------------------------------------------------------------------------------
memory used 0 free memory 0
C used templates 0 pxl tmpl conns 0
C conns from tmpl 0 C non TCP F2F conns 239
C tcp handshake conn 3271 C tcp established co 15167
C tcp closed conns 4625 C tcp f2f handshake 297
C tcp f2f establishe 7689 C tcp f2f closed con 446
C tcp pxl handshake 0 C tcp pxl establishe 39
C tcp pxl closed con 1 outbound packets 51409121237
outbound pxl packets 90048662 outbound f2f packets 6107881879
outbound bytes 35899348079681 outbound pxl bytes 68762023621
outbound f2f bytes 3349002292752
(*) Statistics marked with C refer to current value, others refer to total value
[Expert@gw2:0]# fw ctl affinity -l
eth0: CPU 0
eth1: CPU 0
eth2: CPU 0
eth3: CPU 0
eth8: CPU 0
eth9: CPU 0
Kernel fw_0: CPU 3
Kernel fw_1: CPU 2
Kernel fw_2: CPU 1
Daemon mpdaemon: CPU 1 2 3
Daemon vpnd: CPU 1 2 3
Daemon fwd: CPU 1 2 3
Daemon in.asessiond: CPU 1 2 3
Daemon lpd: CPU 1 2 3
Daemon cpd: CPU 1 2 3
Daemon cprid: CPU 1 2 3
The current license permits the use of CPUs 0, 1, 2, 3 only.
[Expert@gw2:0]# top | grep fw_worker
5712 admin 15 0 0 0 0 R 32 0.0 7431:42 fw_worker_0
5713 admin 15 0 0 0 0 S 32 0.0 6815:17 fw_worker_1
5714 admin 15 0 0 0 0 R 24 0.0 5219:04 fw_worker_2
[Expert@gw2:0]# netstat -in
No RX-ERR and TX-ERR on any Interface.
I read your article to firewall path and activate the monitoring of heavy connections.
Thank you and best regards.
Martin
- Mark as New
- Bookmark
- Subscribe
- Mute
- Subscribe to RSS Feed
- Permalink
- Report Inappropriate Content
Item 1:
we moved to R80 in February and since then from time to time we receive alert Mail from our SMS (R80.30) that it lost connection to the active gateway of our Check Point Cluster (R80.10). The result of my investigation was a high CPU Load (100%) on all cores due to high load on the fw_worker processes across this period.
F2F/slowpath is 6.3M inbound and 33.9M outbound by one measurement and 12.4M inbound and 24.7 M outbound in another measurement. Traffic directly to and from the gateway (including logging) always goes F2F, and these imbalances and the behavior described above screams excessive logging rate, and fwd is starving out when the 3 worker cores get busy, not sure if that is just a symptom or cause. Would suggest trying to reduce logging rate, focus on disabling logging for DNS, NetBIOS and other UDP-based protocols, perhaps HTTP connections as well.
Item 2: There is only one SND core so Multi-Queue will not help.
Item 3: Please provide output of fwaccel stat, packet and connections acceleration looks good but if NAT templates are disabled it will cause a lot of F2F and worker overhead if you have a high new connection rate, see next item. Would caution against enabling NAT templates unless latest Jumbo HFA has been installed on your R80.10 gateway, early implementations of NAT Templates caused SecureXL problems when enabled.
Item 4: During a high CPU period please provide new connection rate, on cpview screen this can be seen on the Overview page, scroll down to the Network section make sure to show the whole Network section.
Item 5: Your single SND core seems to be doing OK so there is probably not much RX-DRP, but your bandwidth numbers under load are suspiciously close to exactly 1Gbit as Heiko noticed, if you are pushing a 1Gbps interface that close to its theoretical limit you are probably racking up overruns (RX-OVR) like crazy. Please provide full output of netstat -ni for analysis.
Item 6: You're not using SHA-384 for any of your VPN's are you? Looks like most of your VPN traffic is fully accelerated but using SHA-384 will cause VPN traffic to go F2F.
Item 7: Even under load it looks like your firewall workers are pretty evenly balanced by the Dynamic Dispatcher, so I doubt it is an elephant flow issue but still worth investigating as Heiko mentioned.
Item 8: High load can be caused by an overloaded sync network in a cluster, please provide output of fw ctl pstat. Might need to do selective synchronization for protocols mentioned in Item 1, as combo of suddenly high connection rates and having to state sync them too is a nasty double whammy on the workers.
Item 9: Doubtful you are having memory issues, but please provide output of free -m anyway.
Item 10: You could be getting flooded with fragmented packets during a high CPU event (frags always go F2F in your version), please provide output of fwaccel stats -p.
New Book: "Max Power 2026" Coming Soon
Check Point Firewall Performance Optimization
Check Point Firewall Performance Optimization
- Mark as New
- Bookmark
- Subscribe
- Mute
- Subscribe to RSS Feed
- Permalink
- Report Inappropriate Content
Thank you for the detailed information.
I answered the Itmes and attached it as txt file for the formatting.
Best regards
Martin
- Mark as New
- Bookmark
- Subscribe
- Mute
- Subscribe to RSS Feed
- Permalink
- Report Inappropriate Content
Item 1: OK great so it looks like you did have excessive logging due to duplicating your logs to another log server, good to see a 10% drop in CPU.
Item 3: While your accept templating rate is pretty good, due to output of fwaccel stat take a look at rule #11. You probably have some kind of DCE/RPC service in use there. Try to move that rule or service as far down in your rulebase as you can, right before your cleanup rule if possible. Install policy and check fwaccel stat again, rinse and repeat until disablement of template offloads doesn't happen until one of the very last rules in your rulebase, this will help reduce F2F by increasing connection templating rate even further.
NAT Templates are disabled as expected, it might help to enable them but we won't know until I see new connection rate during high CPU period as requested in Item 4.
Item 5: Your interfaces are running clean and your single SND is doing fine with the load; you don't need to adjust your CoreXL split to add another SND or enable Multi-Queue. Some negligible RX-DRP on eth9 but not nearly enough to worry about.
Item 6: Confirmed no SHA-384 in use for VPNs.
Item 7: Definitely do NOT want to adjust CoreXL split and reduce number of firewall workers.
Item 8: Hmm your sync network does appear to be struggling a bit based on fw ctl pstat (but underlying network sync interface is running clean) which can cause high CPU on firewall workers, would suggest disabling state synchronization for DNS and HTTP for sure and perhaps HTTPS service as well like this:

Also look at Top-Protocols in cpview and consider disabling synchronization for those services as well to help reduce sync traffic.
Item 9: Memory looks good, no allocation failures.
Item 10: Given overall number of frames, frag numbers do not look excessive.
Summary: Major action items are #3 and #8 which should help quite a bit. Beyond that enabling NAT Templates (with latest Jumbo HFA) may help, but we need to see Network screen of cpview and new connection rate during a high CPU period first.
New Book: "Max Power 2026" Coming Soon
Check Point Firewall Performance Optimization
Check Point Firewall Performance Optimization
- Mark as New
- Bookmark
- Subscribe
- Mute
- Subscribe to RSS Feed
- Permalink
- Report Inappropriate Content
Item 3: Rule #11 had zero hits since the upgrade and I checked it. This rule is not necessary anymore so I disabled it for now. Afterwards the output of fwaccel stat shows the following.
Accept Templates : disabled by Firewall
Layer Network disables template offloads from rule #69
Throughput acceleration still enabled.
Rule #69 is a rule for nfs to a ftp-filer and has the service group "NFS" included which has RPC-Services inside.
I analyzed the rule and only five services are matching. Thats why I changed the current services from NFS, udp/111, tcp/111 and tcp-high-ports to nfsd-tcp (2049), nfsd (2049/udp), tcp/111, udp/111 and tcp/4046.
Of course after performing fwaccel stat now again i've got a new rule which i have to analyze. I probably I will go your way and put the upcoming rules from fwaccel stat to the bottom of the rule base. It needs a little time because I have to check if it is easyly possible to move those rules down in context to the rulebase.
Item4: Last weekend the problem occured again. Here are the first outputs of the cpview overview after it startet at 11Apr2020 03:13:27 AM. The period ended at 12Apr2020 22:35.
1Apr2020 03:13:27 AM
CPU Used
1 25%
2 25%
3 24%
----------------------------------------
Network:
Bits/sec 184M
Packets/sec 43,240
Connections/sec 332
Concurrent connections 24,367
11Apr2020 3:13:28
CPU Used
1 81%
2 81%
3 81%
----------------------------------------
Network:
Bits/sec 261M
Packets/sec 49,371
Connections/sec 362
Concurrent connections 25,677
11Apr2020 3:15:27
CPU Used
1 99%
2 99%
3 98%
----------------------------------------
Network:
Bits/sec 270M
Packets/sec 51,216
Connections/sec 370
Concurrent connections 25,425
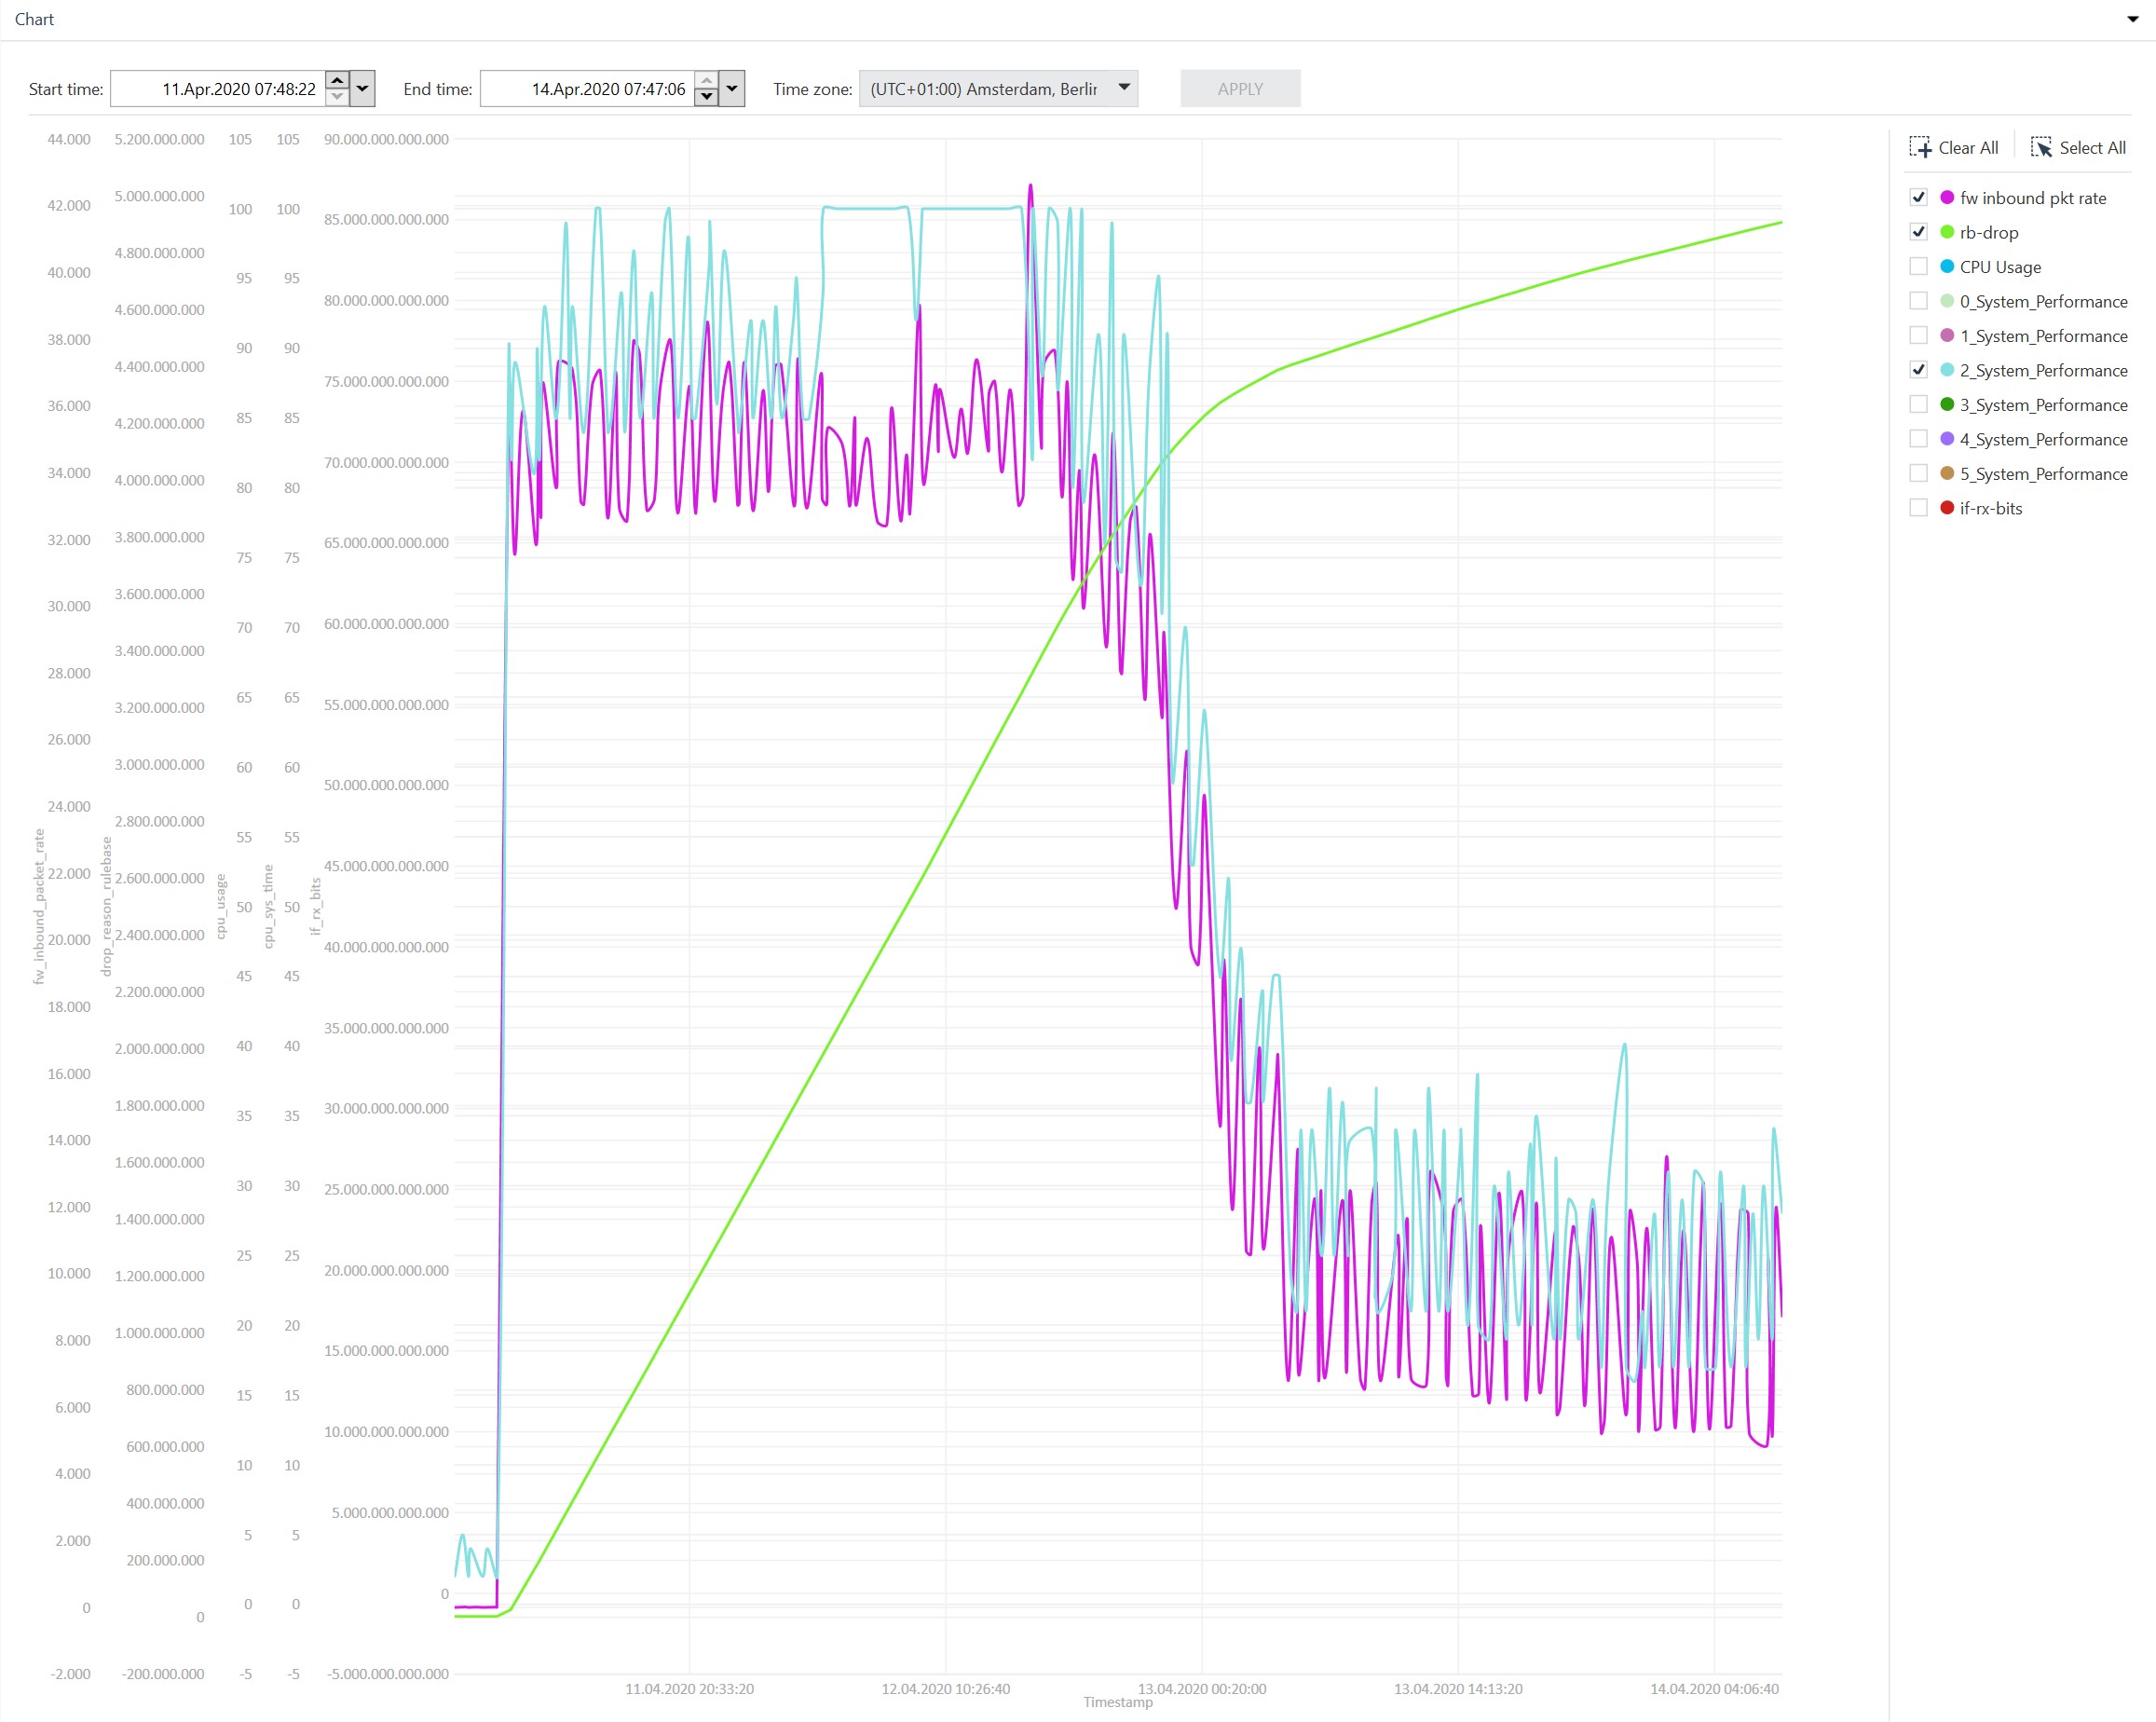
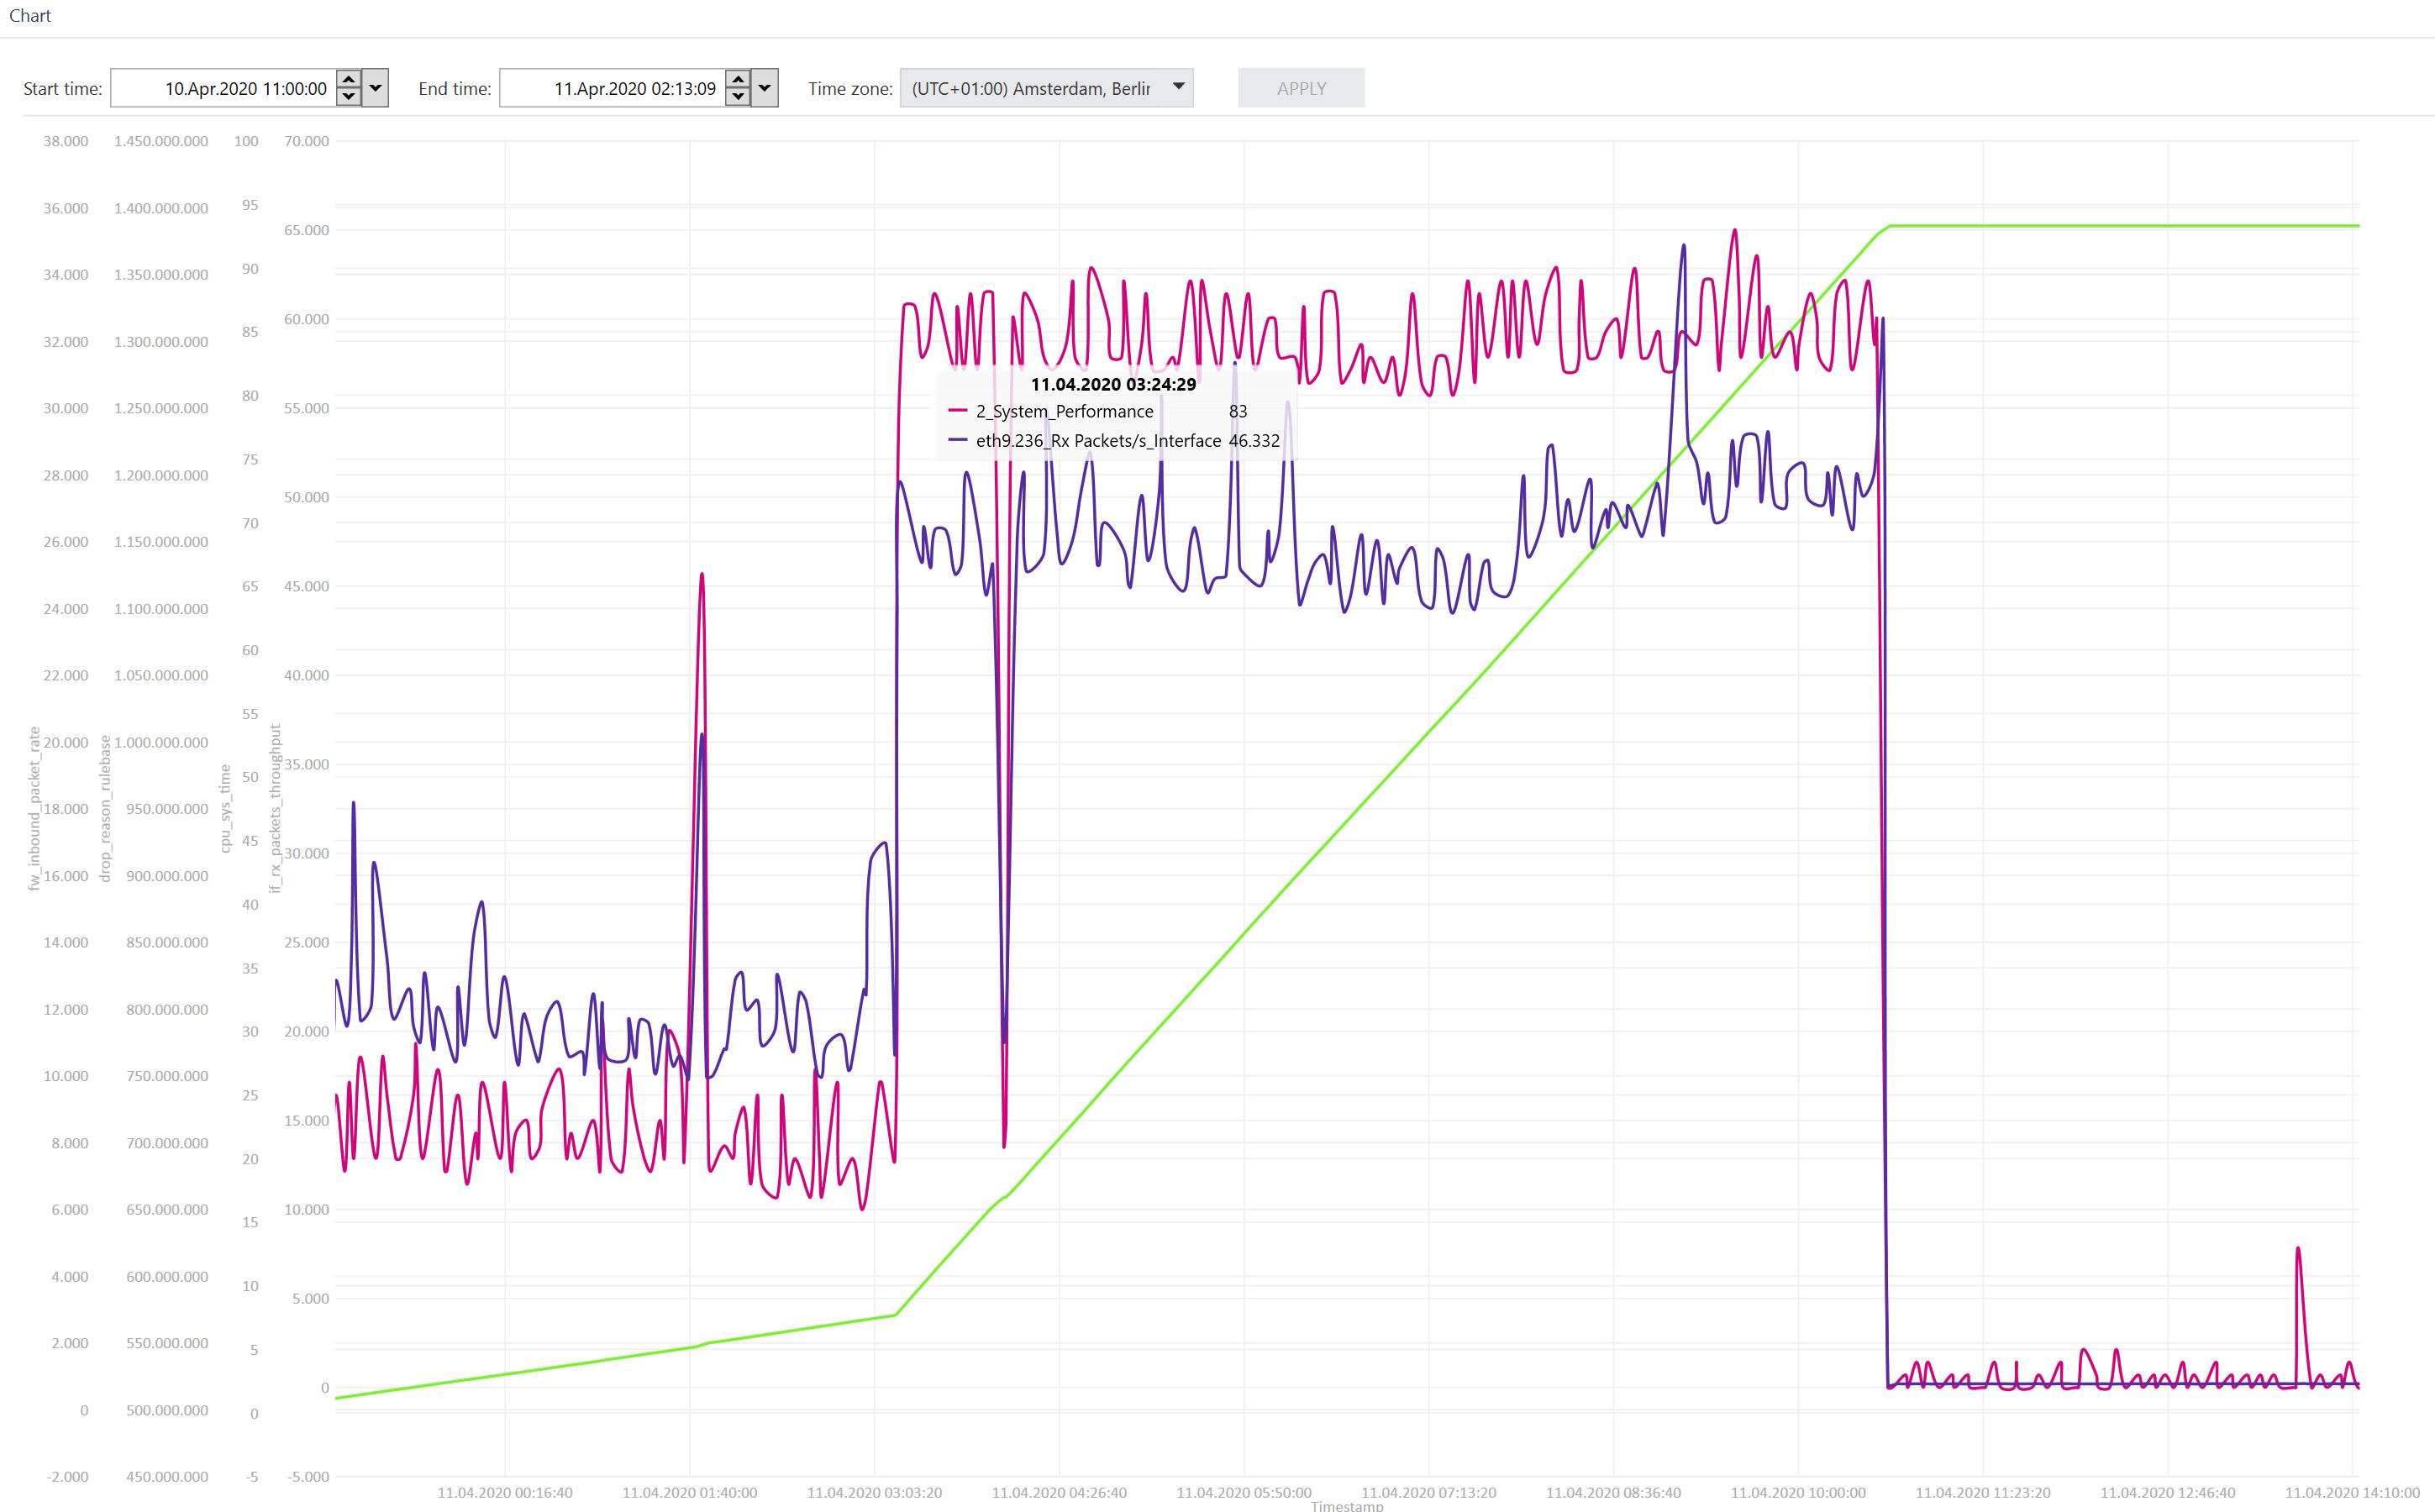
We had a failover at 11Apr2020 10:38:56 and I attached two screenshots because I mentioned that the rulebase drop rate for this period rised strongly.
Failover from GW2 --> GW1


Item 8: I disabled the synchronization for domain-udp, http and https. I will have a look on the average load.
Thanks and best regards
Martin
- Mark as New
- Bookmark
- Subscribe
- Mute
- Subscribe to RSS Feed
- Permalink
- Report Inappropriate Content
Item 3: Rule #11 had zero hits since the upgrade and I checked it. This rule is not necessary anymore so I disabled it for now. Afterwards the output of fwaccel stat shows the following.
Accept Templates : disabled by Firewall
Layer Network disables template offloads from rule #69
Throughput acceleration still enabled.
Rule #69 is a rule for nfs to a ftp-filer and has the service group "NFS" included which has RPC-Services inside.
I analyzed the rule and saw that only five services are matching. These are nfsd-tcp (2049), nfsd (udp/2049), tcp/111, udp/111 and tcp/4046.
I reduced the services for the rule to the necessary ones from formerly NFS (Group), udp-111, tcp-111 and tcp-high-ports.
After installation of the policy a new rule is given when executing fwaccel stat. I try to follow your advice and move those rules down to the rulebase. It will need a little time because I have to check that does not have negative effect in context to the rule base.
Item 4: The problem occured again last weekend for the period 11Apr 03:13:27 AM until 12Apr 10:35:00 PM. Here are the requested outputs of CPVIEW Overview when the cpu load starts to increase.
11Apr2020 3:13:27
| CPU Used
| 1 25%
| 2 25%
| 3 24%
| ----------------------------------------
| Network:
| Bits/sec 184M
| Packets/sec 43,240
| Connections/sec 332
| Concurrent connections 24,367
| ----------------------------------------
11Apr2020 3:13:28
| CPU Used
| 1 81%
| 2 81%
| 3 81%
| ----------------------------------------
| Network:
| Bits/sec 261M
| Packets/sec 49,371
| Connections/sec 362
| Concurrent connections 25,677
| ----------------------------------------
11Apr2020 3:15:27
CPU Used
| 1 99%
| 2 99%
| 3 98%
| ----------------------------------------
| Network:
| Bits/sec 270M
| Packets/sec 51,216
| Connections/sec 370
| Concurrent connections 25,425
In this time a failover happend because one interface was down.
Failover GW2 --> GW1
I mentioned a huge increase of firewall rulebase drop in this time. You can see this in the screenshots.
Item 8: As suggested I deactivated the synchronization for domain-udp, http and https.
Thank you, best regards
Martin
- Mark as New
- Bookmark
- Subscribe
- Mute
- Subscribe to RSS Feed
- Permalink
- Report Inappropriate Content
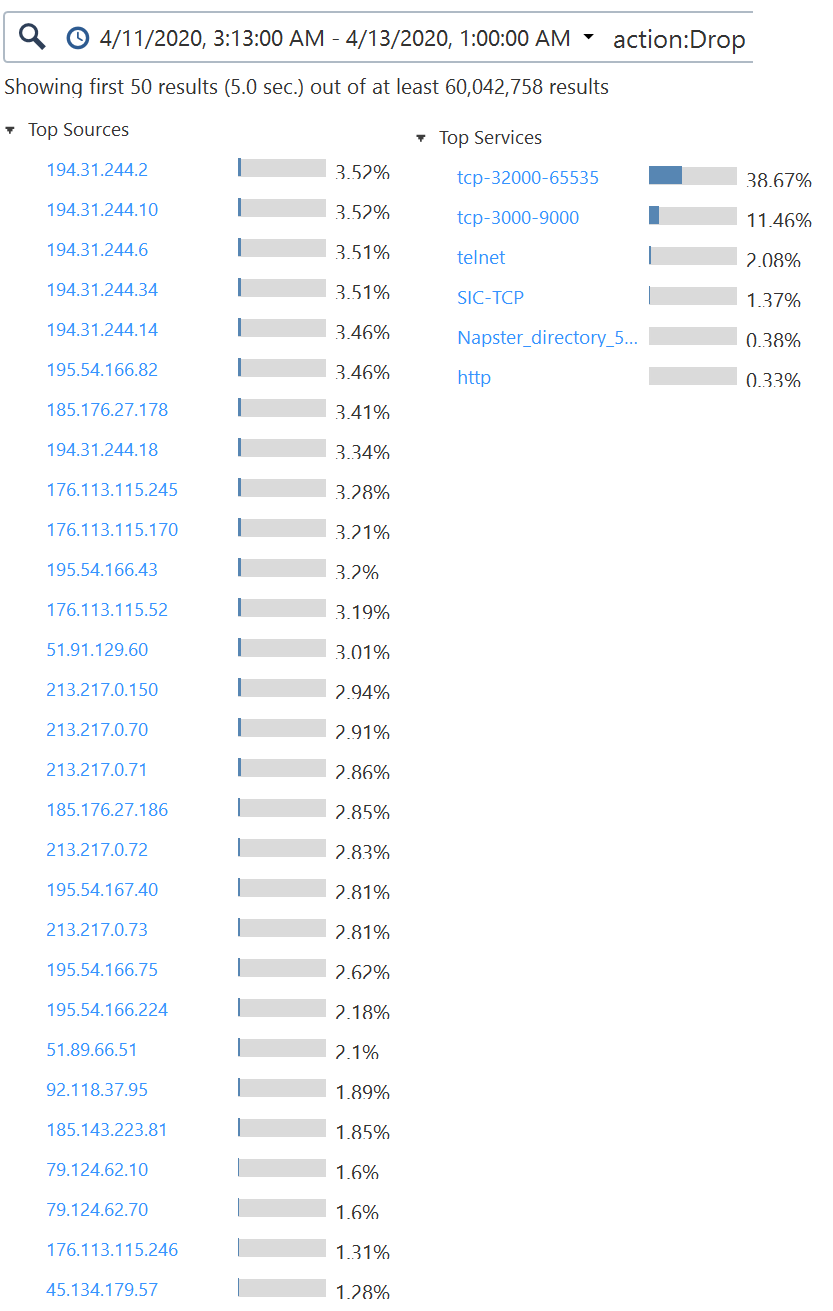
Your concurrent connections numbers are consistently and suspiciously close to 25,000 which is the old default hard limit for number of connections. On the firewall/cluster object under Optimizations, do you have "Capacity Optimization" set to Automatically?
Assuming you are set for Automatically, it looks like your firewall is getting blasted with drops (not legit accepted connections) during the high CPU period. You will need to look at the firewall logs during the slow periods and try to figure out if these blasts are coming from the inside/DMZ or the outside, I don't think you can view policy drops per interface from something like cpview but perhaps your graphing application that provided those screenshots can. The policy optimizations you are doing via fwaccel stat won't help for dropped traffic which still has to go through the whole rulebase. It is also possible these drops are a red herring caused by the failover since you enabled selective sync for various services.
If the blasts are from the outside, I would suggest enabling the SecureXL penalty box feature which will blacklist the offending IP address(es) and efficiently drop all their traffic for awhile in SecureXL. If the blasts are coming from the inside you'll have some more latitude to hopefully deal with whatever is causing them, be on the lookout for NMS systems sending lots of SNMP/ICMP probes, and auditors running some kind of automated port-scanning tools. sk74520: What is the SecureXL penalty box mechanism for offending IP addresses?
The SecureXL penalty box will only drop traffic coming in from outside interfaces by default, but it can be set to penalty-box traffic coming from the inside as well. However I wouldn't recommend doing that until you understand what is going on, as the penalty box will drop ALL traffic from an offending IP address on the inside, so that could adversely impact production.
New Book: "Max Power 2026" Coming Soon
Check Point Firewall Performance Optimization
Check Point Firewall Performance Optimization
- Mark as New
- Bookmark
- Subscribe
- Mute
- Subscribe to RSS Feed
- Permalink
- Report Inappropriate Content
"Capacity Optimization" is set to Automatically. And here is the calculated value of the active node.
Active Node
[Expert@gw1:0]# fw tab -t connections -s
HOST NAME ID #VALS #PEAK #SLINKS
localhost connections 8158 30566 65171 91753
I used Check Point diagnostics view for the visualization of the cpview history database. In my opinion there is a correlation. The packet rate on our outside interface increases and at the same time the system performance and rulebase drops go up. See the attached Screenshot.
Every Sunday I generate a Rule Usage Report with Tufin Secure Track. The result from last sunday, our most used rule is the CleanUp Rule with 91% (20,694,963,845 Hits) followed by another CleanUp rule with 2% hits (536,587,767).
We have activated Logging for this rules. Maybe not the drop is the issue but the risen logging rate?
And maybe it's useful to say that we have a public class B network.
I filtert with SmartConsole for the last period with high cpu load last weekend (4/11/2020 - 4/13/2020). I have a result for top sources and services. It's suspicious that there are several IP addresses from the same network. I also attached a Screenshot.
SecureXL penalty box sounds interesting I never heard of it before read the SK at first.
Best regards
- Mark as New
- Bookmark
- Subscribe
- Mute
- Subscribe to RSS Feed
- Permalink
- Report Inappropriate Content
> And maybe it's useful to say that we have a public class B network.
Oooof, yep you are going to have a lot of drops from all the background noise crap of the Internet with a potential attack surface of that size. Looking at your screenshots confirms that you have lots of drops coming in from the Internet. This is a common issue, here is what you need to do:
1) If possible, configure Geo Policy in a blacklist configuration to drop traffic to/from countries that your organization has no business talking to.
Geo Policy drops happen very early in INSPECT processing (right after antispoofing), and can substantially lower CPU usage (I've seen CPU load dive 30% after configuring it with clients like yourself who have a large block of Internet-routable addresses). Normally I'd suggest using Geo Updatable Objects here instead, but support for those was added in R80.20 and you're still on R80.10 gateway. Depending on the scope and geographic reach of your organization using Geo Policy may not be feasible though. Edit: Be sure to define a Geo Policy exception for DNS traffic (both TCP and UDP port 53) to avoid some rather random-looking DNS problems that can result, this nasty situation was covered on pages 280-281 of my latest book)
2) Enable the SecureXL penalty box. The default is to penalty-box an IP address with 500+ drops/sec for a period of 3 minutes, and only for traffic on the external interface. I'd suggest enabling it with the default settings and see how it behaves for a week or so; assuming it doesn't break anything in production with the defaults, in the real world I usually tweak down the threshold from 500 drops down to the 200 range or so with no adverse impacts. Do not attempt to use the optimized drops feature as it is much older.
3) Over time if you have repeat offenders that keep getting tossed in the penalty box, create an explicit rule at the top of your rulebase that matches these bad actors and silently drops them with no logging.
Let us know how it goes...
New Book: "Max Power 2026" Coming Soon
Check Point Firewall Performance Optimization
Check Point Firewall Performance Optimization
- Mark as New
- Bookmark
- Subscribe
- Mute
- Subscribe to RSS Feed
- Permalink
- Report Inappropriate Content
1.) As scientific institution we operate world wide thats why installing a Geo Policy isn't an opportunity for us.
2.) I activated the Penalty Box with default values and it already seems to have a a gepositive effects against the internet background noice. The average CPU usage dives 5-10%. I keep the default values for the first time and monitor the fw performance for the next weeks. I won't change to much in one step to see which activity works for us and I will wait if some problems are reported regarding the activated penalty box.
I provide our experiences with this settings by the end of the next week.
Thanks for the fast support and best regards
Martin
- Mark as New
- Bookmark
- Subscribe
- Mute
- Subscribe to RSS Feed
- Permalink
- Report Inappropriate Content
> 1.) As scientific institution we operate world wide thats why installing a Geo Policy isn't an opportunity for us.
Yup suspected this would be the case for your organization since you have a whole Class B to yourselves.
Now that the penalty box is enabled with the default settings, I'd start keeping an eye on which IPs are constantly getting tossed into it with the sim tab dos_penalty_box command. If you check out the offending IPs and they are not legit, start building a rule at the top of your policy dropping all their traffic all the time. Even with the penalty box enabled, offenders are able to rack up 500 drops in one second before they get penalty-boxed which still causes a lot of CPU overhead.
I don't think insertions into the penalty box are logged by default, you can turn that on with sim erdos -l 1 which might be helpful.
New Book: "Max Power 2026" Coming Soon
Check Point Firewall Performance Optimization
Check Point Firewall Performance Optimization
- Mark as New
- Bookmark
- Subscribe
- Mute
- Subscribe to RSS Feed
- Permalink
- Report Inappropriate Content
I enabled the logging with sim erdos -l 1 as i enabled the penalty box.
If I execute sim tab dos_penalty_box the information about hosts in the PB are written to /var/log/messages and dmesg.
But there is no log entry if a host is inserted into the PB. In the SK to the PB I can't find Informationen about the destination of the logs.
Do you know where the log is written to?
- Mark as New
- Bookmark
- Subscribe
- Mute
- Subscribe to RSS Feed
- Permalink
- Report Inappropriate Content
Pretty sure it is written to your regular firewall traffic logs available from the SmartConsole, but that may only apply to firewalls with a certain code level, not completely sure.
New Book: "Max Power 2026" Coming Soon
Check Point Firewall Performance Optimization
Check Point Firewall Performance Optimization
- Mark as New
- Bookmark
- Subscribe
- Mute
- Subscribe to RSS Feed
- Permalink
- Report Inappropriate Content
Found it in the Traffic Logs.
It's alright. Thanks
- Mark as New
- Bookmark
- Subscribe
- Mute
- Subscribe to RSS Feed
- Permalink
- Report Inappropriate Content
Since the penalty box is activated we wasn't faced to high cpu load issues again.
We still work with 500+ drops/sec. I used a trial license for smart event to figure out what are the most counted offenders but it does not work.
From access logs I get the value of approx. 20.000 alerts for penalty box drops per day. Some ip addreses repeat daily but for me it is not a proper solution to create a rule for all these suspicious ip ranges and continuously maintain the rule.
Currently the solution with activated penalty box works for us and because we have so many drops right now I prefere to stay at 500+ drops/sec as long we are not forced to handle.
Best regards
- Mark as New
- Bookmark
- Subscribe
- Mute
- Subscribe to RSS Feed
- Permalink
- Report Inappropriate Content
You may opt to disable logging for penalty box to further reduce stress on the firewall. Unless you need these logs for something else.
- Mark as New
- Bookmark
- Subscribe
- Mute
- Subscribe to RSS Feed
- Permalink
- Report Inappropriate Content
Hi @Martin_Reppich,
@Timothy_Hall has already given a couple of good tips here.
Here is good to see that the SecureXL must optimize.
| Path | Packets |
| Accelerated Path | 51409121939 |
| F2F Path | 6090346522 |
| Accelerated VPN Path ESP enc pkts | 13239884 |
| Medium Path PXL packets | 90048662 |
If you use 10 Gbps, you should definitely use multi queueing. This means you need more SND's to use MQ. I would definitely try that. More read here R80.x - Performance Tuning Tip - Multi Queue and here R80.x - Performance Tuning Tip - Intel Hardware.
With the "Accelerated VPN Path" you can see that only low processing is done here and many packets probably run into the F2F path. I would adjust the VPN encryption algorithms here so that more are processed in the "Accelerated VPN Path". With "fwaccel stat" you can see which algorithms are supported in SecureXL.
Regards
Heiko
➜ CCSM Elite, CCME, CCTE, CCVS ➜ www.checkpoint.tips
- Mark as New
- Bookmark
- Subscribe
- Mute
- Subscribe to RSS Feed
- Permalink
- Report Inappropriate Content
Any particular reason you're still on R80.10 for your gateway?
Lot of improvements in R80.20+ performance wise.
Not saying it will solve this particular issue but worth considering.
Lot of improvements in R80.20+ performance wise.
Not saying it will solve this particular issue but worth considering.
- Mark as New
- Bookmark
- Subscribe
- Mute
- Subscribe to RSS Feed
- Permalink
- Report Inappropriate Content
We did the upgrade with a service provider and they recommend to go to R80.10 and wait until R80.30 with kernel 3.10 is available for our open server IBM x3550 M4.
If such an release isn't planed we probably can talk about an upgrade too.
- Mark as New
- Bookmark
- Subscribe
- Mute
- Subscribe to RSS Feed
- Permalink
- Report Inappropriate Content
We're not planning support for additional Open Servers on R80.30-3.10.
R80.40 was released for all supported appliances with 3.10 kernel (no more 2.6 kernel).
R80.40 was released for all supported appliances with 3.10 kernel (no more 2.6 kernel).
- Mark as New
- Bookmark
- Subscribe
- Mute
- Subscribe to RSS Feed
- Permalink
- Report Inappropriate Content
you can print violations for SXL
SecureXL violations (F2F packets) - fwaccel stats -p
Did you manage to find what kind of traffic is that? Maybe some DoS or DDoS from Internet, fragmented traffic, IP options, some other protocol that is not TCP/UDP,
what kind of encryption algorithms you are using for VPN?
Maybe activate drop templates?
CPVIEW - top connections in the time of the problem.
Or analyze traffic by Traffic analysis using the 'CPMonitor' tool - sk103212
- Mark as New
- Bookmark
- Subscribe
- Mute
- Subscribe to RSS Feed
- Permalink
- Report Inappropriate Content
Thanks for the feedback.
My activitys are in the replys to Timothys posts.
My activitys are in the replys to Timothys posts.
- Mark as New
- Bookmark
- Subscribe
- Mute
- Subscribe to RSS Feed
- Permalink
- Report Inappropriate Content
Thanks for the information.
We did some configuration on our R80.10 Gateways recommended by @Timothy_Hall and @HeikoAnkenbrand. If it works for us to handle periods with high cpu load I guess we keep staying at this release at first.
I keep it in my mind as an optional activity.
Leaderboard
Epsum factorial non deposit quid pro quo hic escorol.
| User | Count |
|---|---|
| 15 | |
| 7 | |
| 5 | |
| 3 | |
| 2 | |
| 2 | |
| 1 | |
| 1 | |
| 1 | |
| 1 |
Upcoming Events
Tue 28 Jul 2026 @ 11:00 AM (EDT)
Under the Hood - Check Point and Illumio – Modern Network Defense Against AI-Based ThreatsWed 29 Jul 2026 @ 12:00 PM (SGT)
The AI Security Report 2026: A Turning Point for Enterprise Defense - SGTWed 29 Jul 2026 @ 02:00 PM (IDT)
The AI Security Report 2026: A Turning Point for Enterprise Defense - AMERWed 29 Jul 2026 @ 03:00 PM (CEST)
The AI Security Report 2026: A Turning Point for Enterprise Defense EMEATue 28 Jul 2026 @ 11:00 AM (EDT)
Under the Hood - Check Point and Illumio – Modern Network Defense Against AI-Based ThreatsWed 29 Jul 2026 @ 12:00 PM (SGT)
The AI Security Report 2026: A Turning Point for Enterprise Defense - SGTWed 29 Jul 2026 @ 02:00 PM (IDT)
The AI Security Report 2026: A Turning Point for Enterprise Defense - AMERWed 29 Jul 2026 @ 03:00 PM (CEST)
The AI Security Report 2026: A Turning Point for Enterprise Defense EMEAThu 30 Jul 2026 @ 10:00 AM (PDT)
AI Security Masters E12: READY OR NOT: Securing the AI Enterprise 4/5 - AI GatewayThu 20 Aug 2026 @ 08:30 AM (COT)
Medellin: Workspace Evolution: Hybrid Mesh Management - Visibilidad, Automatización e IAThu 20 Aug 2026 @ 06:00 PM (COT)
Medellin: Workspace Intelligence: IA Generativa en Acción para Equipos de SeguridadAbout CheckMates
Learn Check Point
Advanced Learning
YOU DESERVE THE BEST SECURITY

©1994-2026 Check Point Software Technologies Ltd. All rights reserved.
Copyright
Privacy Policy
About Us
UserCenter