- Products
- Learn
- Local User Groups
- Partners
- More

This website uses Cookies. Click Accept to agree to our website's cookie use as described in our Privacy Policy. Click Preferences to customize your cookie settings.
- Products
- Learn
- Local User Groups
- Upcoming Events
- Americas
- EMEA
- Czech Republic and Slovakia
- Denmark
- Netherlands
- Germany
- Sweden
- United Kingdom and Ireland
- France
- Spain
- Norway
- Ukraine
- Baltics and Finland
- Greece
- Portugal
- Austria
- Kazakhstan and CIS
- Switzerland
- Romania
- Turkey
- Belarus
- Belgium & Luxembourg
- Russia
- Poland
- Georgia
- DACH - Germany, Austria and Switzerland
- Iberia
- Africa
- Adriatics Region
- Eastern Africa
- Israel
- Nordics
- Middle East and Africa
- Balkans
- Italy
- Bulgaria
- Cyprus
- APAC
- Partners
- More
- ABOUT CHECKMATES & FAQ
- Sign In
- Leaderboard
- Events
On-Premises SD-WAN Management
Register HereThe industry's first AI Network Firewall
Securing AI traffic, everywhere
AI Security Masters E8:
Claude Mythos: New Era in Cyber Security
CheckMates Go:
No Attack Required
Turn on suggestions
Auto-suggest helps you quickly narrow down your search results by suggesting possible matches as you type.
Showing results for
- CheckMates
- :
- Products
- :
- General Topics
- :
- Bad Performance
Options
- Subscribe to RSS Feed
- Mark Topic as New
- Mark Topic as Read
- Float this Topic for Current User
- Bookmark
- Subscribe
- Mute
- Printer Friendly Page
Turn on suggestions
Auto-suggest helps you quickly narrow down your search results by suggesting possible matches as you type.
Showing results for
Are you a member of CheckMates?
×
Sign in with your Check Point UserCenter/PartnerMap account to access more great content and get a chance to win some Apple AirPods! If you don't have an account, create one now for free!
- Mark as New
- Bookmark
- Subscribe
- Mute
- Subscribe to RSS Feed
- Permalink
- Report Inappropriate Content
Bad Performance
We recently moved from OpenServers to VSX Clusters and now performance is really bad. Traffic to the internet is terrible.
People working over VPN can't hardly work. We just don't know were to look anymore. we are on R80.10 take 121.
Clusters are 15600 and 23500 models.
Has anybody any idea were to look?
60 Replies
- Mark as New
- Bookmark
- Subscribe
- Mute
- Subscribe to RSS Feed
- Permalink
- Report Inappropriate Content
How many concurrent connections you have there on that busy VS?
fw ctl pstat
is probably the best to check. That will help to decide if you need to switch to 64bit kernel
- Mark as New
- Bookmark
- Subscribe
- Mute
- Subscribe to RSS Feed
- Permalink
- Report Inappropriate Content
this is the print of fw ctl -pstat
But we want to move to 64 bit, it seems that out other VSX's all are turned over to 64 bit.
But i want to know if we can do that on the fly (reboot is probably required but thats ok)
[Expert@vsx-lvn-pub2:2]# fw ctl pstat
Virtual System Capacity Summary:
Physical memory used: 6% (5962 MB out of 96514 MB) - below watermark
Kernel memory used: 2% (2680 MB out of 96514 MB) - below watermark
Virtual memory used: 67% (2710 MB out of 4014 MB) - below watermark
Used: 2166 MB by FW, 544 MB by zeco
Concurrent Connections: 13% (65022 out of 499900) - below watermark
Aggressive Aging is enabled, not active
Hash kernel memory (hmem) statistics:
Total memory allocated: 883757180 bytes in 216395 (4084 bytes) blocks
Total memory bytes used: 0 unused: 883757180 (100.00%) peak: 1531028396
Total memory blocks used: 0 unused: 216395 (100%) peak: 384301
Allocations: 2289355014 alloc, 0 failed alloc, 2281399311 free
System kernel memory (smem) statistics:
Total memory bytes used: 1468882712 peak: 2242211448
Total memory bytes wasted: 243764300
Blocking memory bytes used: 1154498496 peak: 1830838796
Non-Blocking memory bytes used: 314384216 peak: 411372652
Allocations: 3927067 alloc, 0 failed alloc, 3634927 free, 0 failed free
vmalloc bytes used: 0 expensive: no
Kernel memory (kmem) statistics:
Total memory bytes used: 1325317216 peak: 1898565696
Allocations: 2292374163 alloc, 0 failed alloc
2284343899 free, 0 failed free
Cookies:
83076304 total, 0 alloc, 0 free,
1 dup, 282822537 get, 15437786 put,
86721889 len, 190864 cached len, 0 chain alloc,
0 chain free
Connections:
1609668 total, 688997 TCP, 884813 UDP, 35847 ICMP,
11 other, 19 anticipated, 22 recovered, 65022 concurrent,
72351 peak concurrent
Fragments:
36252 fragments, 14344 packets, 20 expired, 0 short,
0 large, 0 duplicates, 0 failures
NAT:
7644152/0 forw, 7054694/0 bckw, 14115350 tcpudp,
544912 icmp, 611203-429512 alloc
Sync:
Version: new
Status: Able to Send/Receive sync packets
Sync packets sent:
total : 2218640, retransmitted : 0, retrans reqs : 0, acks : 1127
Sync packets received:
total : 29242, were queued : 0, dropped by net : 0
retrans reqs : 0, received 93 acks
retrans reqs for illegal seq : 0
dropped updates as a result of sync overload: 0
[Expert@vsx-lvn-pub2:2]#
- Mark as New
- Bookmark
- Subscribe
- Mute
- Subscribe to RSS Feed
- Permalink
- Report Inappropriate Content
Yeah, do switch to 64bit kernel as you're already at nearly 70% utilisation, so you won't be able to run much more than 120k concurrent connections in total (even you have set the table to 500k you will never get there as you will run out of memory with 32bit kernel)
Virtual memory used: 67% (2710 MB out of 4014 MB) - below watermark
Used: 2166 MB by FW, 544 MB by zeco
Concurrent Connections: 13% (65022 out of 499900) - below watermark
And yes - even though it won't be full reboot, it will restart all VSes to enable 64bit kernel. It's done system wide so all VSes will be affected.
You might minimise impact by doing installing policy that allows out of state connections first, then do standby box, fail over and do the other box
- Mark as New
- Bookmark
- Subscribe
- Mute
- Subscribe to RSS Feed
- Permalink
- Report Inappropriate Content
What processes are running high during those 10mins? from top output
- Mark as New
- Bookmark
- Subscribe
- Mute
- Subscribe to RSS Feed
- Permalink
- Report Inappropriate Content
Also what do you do with connections during policy push? Rematch or keep? Try setting to keep if you use rematch

- Mark as New
- Bookmark
- Subscribe
- Mute
- Subscribe to RSS Feed
- Permalink
- Report Inappropriate Content
The keep connections solved also this one.
I think for now we have overcome all the issues on the firewall site as far as i can see.
We still have 1 issue, but that's not firewall related (vpn concentrator is running on his limits), so we can look again after we've solved that one.
Steps that we took to improve performance.
- Setting CPU affinity correct (we see now clearly that all cpu's are used)
- Turning it in to 64 bit
- enable multique on the highest loaded interfaces.
- Finetuning our application/url filter to get accelerated packets working.
- Turning on the keep all connections in the connection persistant.
Thank you all for your input, special thanks to Kaspars Zibarts
- Mark as New
- Bookmark
- Subscribe
- Mute
- Subscribe to RSS Feed
- Permalink
- Report Inappropriate Content
Good to hear that you are over the hill! ![]() Nice job for not giving up! And great summary - I was looking forward to it, that may help others in long run!
Nice job for not giving up! And great summary - I was looking forward to it, that may help others in long run!
- Mark as New
- Bookmark
- Subscribe
- Mute
- Subscribe to RSS Feed
- Permalink
- Report Inappropriate Content
Unfortunately we are still facing slow download. Our users are still complaining.
If they do a speedtest.net test they have a download of 60 Mbps while doing the same on our 5800 appliance they got 460Mbps.
Even during night when there is no traffic we are not getting a lot more out of it.
Also before moving to the 23600 and 15600 VSX cluster we were getting good results.
Any idea how we can improve this?
- Mark as New
- Bookmark
- Subscribe
- Mute
- Subscribe to RSS Feed
- Permalink
- Report Inappropriate Content
It's bit confusing as you keep referring to two clusters. So ideally, draw a diagram that shows VS and interfaces involved for one "slow" example. Then all relevant info regarding those:
- what blades are enabled on VS
- How many CoreXL instances you have
- CPU load on every core that's involved (CoreXL and SXL)
- statistics - concurrent connections, new connections per second, throughput (use cpview)
- acceleration stats, fwaccel stats -s
- fw ctl pstat
- interface config to see that it has negotiated correct speed (not 100Mbps for example and full duplex), use ethtool
- Mark as New
- Bookmark
- Subscribe
- Mute
- Subscribe to RSS Feed
- Permalink
- Report Inappropriate Content
These are the 2 clusters where i'm talking about.
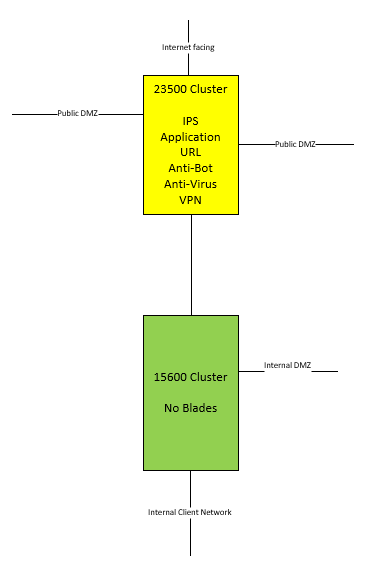
Both VS on yellow and green have 10 CoreXL instances assigned.
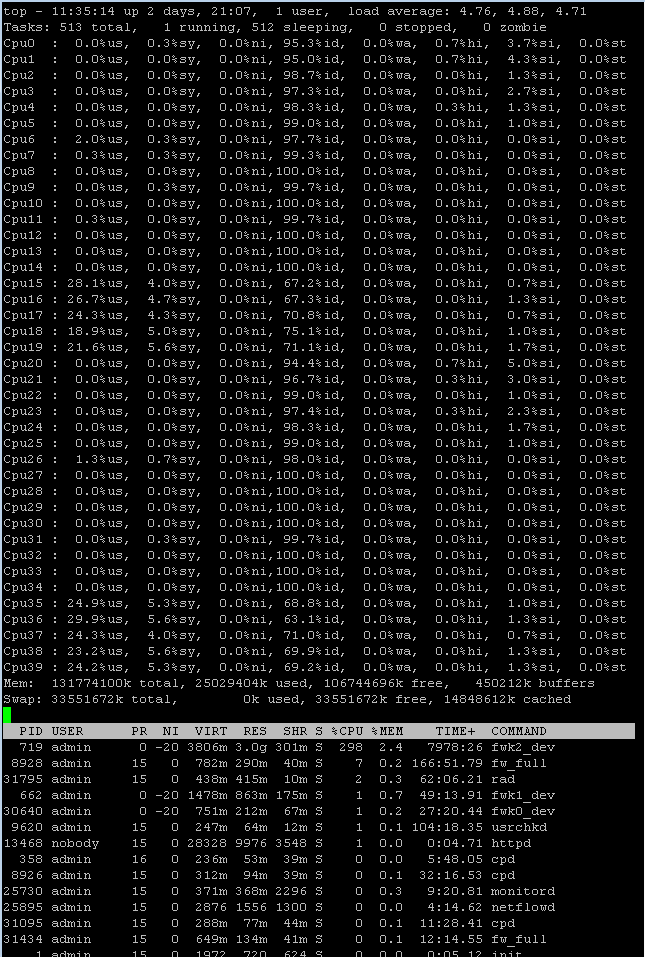
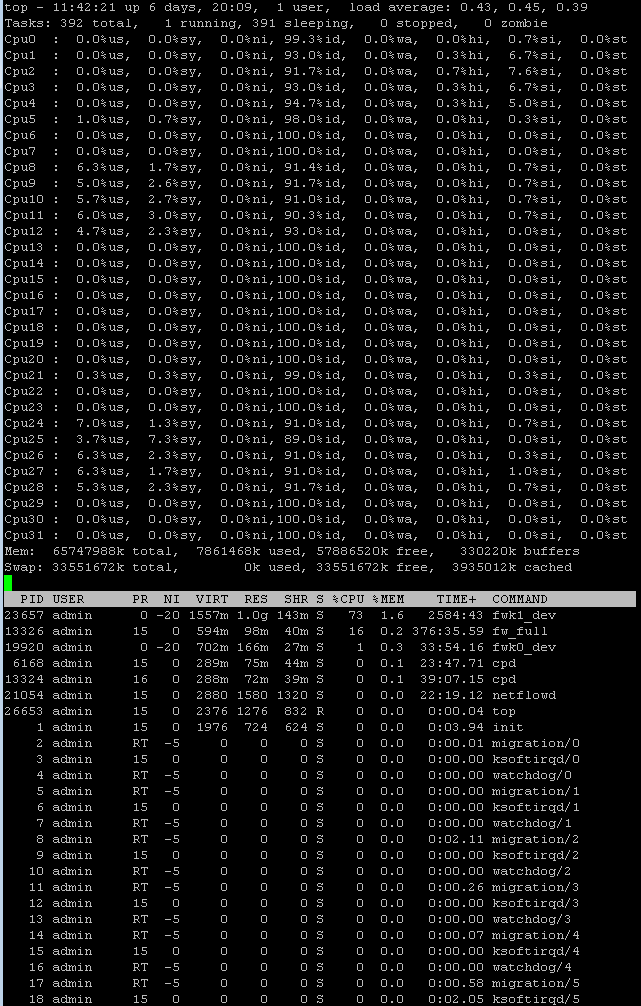
Load on both systems, left is yellow and right is green

fw ctl pstat on yellow
[Expert@vsx-lvn-pub2:2]# fw ctl pstat
Virtual System Capacity Summary:
Physical memory used: 7% (7153 MB out of 96514 MB) - below watermark
Kernel memory used: 2% (2716 MB out of 96514 MB) - below watermark
Virtual memory used: 3% (3805 MB out of 126111 MB) - below watermark
Used: 3191 MB by FW, 544 MB by zeco
Concurrent Connections: 15% (79307 out of 499900) - below watermark
Aggressive Aging is enabled, not active
Hash kernel memory (hmem) statistics:
Total memory allocated: 1529049360 bytes in 374767 (4080 bytes) blocks
Total memory bytes used: 0 unused: 1529049360 (100.00%) peak: 2035641024
Total memory blocks used: 0 unused: 374767 (100%) peak: 538968
Allocations: 680440758 alloc, 0 failed alloc, 669381679 free
System kernel memory (smem) statistics:
Total memory bytes used: 2414838560 peak: 3278514856
Total memory bytes wasted: 272920972
Blocking memory bytes used: 1972079228 peak: 2597806212
Non-Blocking memory bytes used: 442759332 peak: 680708644
Allocations: 156217721 alloc, 0 failed alloc, 155748746 free, 0 failed free
vmalloc bytes used: 0 expensive: no
Kernel memory (kmem) statistics:
Total memory bytes used: 2144385472 peak: 5049142464
Allocations: 811228223 alloc, 0 failed alloc
800079480 free, 0 failed free
Cookies:
935886491 total, 0 alloc, 0 free,
26982 dup, 343032389 get, 294366881 put,
1420790283 len, 41908242 cached len, 0 chain alloc,
0 chain free
Connections:
81120856 total, 30464506 TCP, 48960506 UDP, 1695733 ICMP,
111 other, 143 anticipated, 0 recovered, 79324 concurrent,
89651 peak concurrent
Fragments:
3636729 fragments, 1793644 packets, 7728 expired, 0 short,
0 large, 0 duplicates, 24 failures
NAT:
126051181/0 forw, 86114763/0 bckw, 178902146 tcpudp,
31815238 icmp, 42300083-27286299 alloc
Sync:
Version: new
Status: Able to Send/Receive sync packets
Sync packets sent:
total : 127776739, retransmitted : 57, retrans reqs : 46, acks : 82552
Sync packets received:
total : 1804709, were queued : 93, dropped by net : 47
retrans reqs : 27, received 1682 acks
retrans reqs for illegal seq : 0
dropped updates as a result of sync overload: 0
Callback statistics: handled 41 cb, average delay : 1, max delay : 1
fw ctl pstat on green
[Expert@vsx-lvn-int2:1]# fw ctl pstat
Virtual System Capacity Summary:
Physical memory used: 5% (2803 MB out of 48155 MB) - below watermark
Kernel memory used: 3% (1466 MB out of 48155 MB) - below watermark
Virtual memory used: 38% (1555 MB out of 4014 MB) - below watermark
Used: 1011 MB by FW, 544 MB by zeco
Concurrent Connections: 25% (128708 out of 499900) - below watermark
Aggressive Aging is enabled, not active
Hash kernel memory (hmem) statistics:
Total memory allocated: 248343956 bytes in 60809 (4084 bytes) blocks
Total memory bytes used: 0 unused: 248343956 (100.00%) peak: 266994792
Total memory blocks used: 0 unused: 60809 (100%) peak: 72612
Allocations: 3960930289 alloc, 0 failed alloc, 3959048176 free
System kernel memory (smem) statistics:
Total memory bytes used: 487971924 peak: 568568456
Total memory bytes wasted: 58266540
Blocking memory bytes used: 318718512 peak: 367767992
Non-Blocking memory bytes used: 169253412 peak: 200800464
Allocations: 9471597 alloc, 0 failed alloc, 9393111 free, 0 failed free
vmalloc bytes used: 0 expensive: no
Kernel memory (kmem) statistics:
Total memory bytes used: 432507296 peak: 665578012
Allocations: 3969795183 alloc, 0 failed alloc
3967896148 free, 0 failed free
Cookies:
2610393159 total, 0 alloc, 0 free,
0 dup, 1766145211 get, 12074869 put,
3230368160 len, 11418884 cached len, 0 chain alloc,
0 chain free
Connections:
459825573 total, 102872580 TCP, 259319185 UDP, 97633634 ICMP,
174 other, 78850 anticipated, 18075 recovered, 128708 concurrent,
175216 peak concurrent
Fragments:
12738060 fragments, 5702657 packets, 858 expired, 0 short,
0 large, 0 duplicates, 20 failures
NAT:
2994683/0 forw, 837006/0 bckw, 1584228 tcpudp,
2247415 icmp, 2368813-167492 alloc
Sync:
Version: new
Status: Able to Send/Receive sync packets
Sync packets sent:
total : 347544865, retransmitted : 20, retrans reqs : 4, acks : 218
Sync packets received:
total : 5035793, were queued : 21, dropped by net : 13
retrans reqs : 20, received 123 acks
retrans reqs for illegal seq : 0
dropped updates as a result of sync overload: 0
For Yellow
[Expert@vsx-lvn-pub2:2]# fwaccel stats -s
Accelerated conns/Total conns : 542/73815 (0%)
Accelerated pkts/Total pkts : 4383027/297348036 (1%)
F2Fed pkts/Total pkts : 11286627/297348036 (3%)
PXL pkts/Total pkts : 281678382/297348036 (94%)
QXL pkts/Total pkts : 0/297348036 (0%)
[Expert@vsx-lvn-pub2:2]#
For Green
[Expert@vsx-lvn-int2:1]# fwaccel stats -s
Accelerated conns/Total conns : 93933/129482 (72%)
Accelerated pkts/Total pkts : 6782429568/7331411243 (92%)
F2Fed pkts/Total pkts : 417742987/7331411243 (5%)
PXL pkts/Total pkts : 131238688/7331411243 (1%)
QXL pkts/Total pkts : 0/7331411243 (0%)
[Expert@vsx-lvn-int2:1]#
- Mark as New
- Bookmark
- Subscribe
- Mute
- Subscribe to RSS Feed
- Permalink
- Report Inappropriate Content
Ok, so green one has not been switched to 64 bit mode as far as I can see (max memory 4GB). It should not affect you too much as there's still plenty memory left.
Virtual System Capacity Summary:
Physical memory used: 5% (2803 MB out of 48155 MB) - below watermark
Kernel memory used: 3% (1466 MB out of 48155 MB) - below watermark
Virtual memory used: 38% (1555 MB out of 4014 MB) - below watermark
Secondly i need rest of the info: how many cores you have allocated to these VSes, what is CPU utilisation (top or ideally graphs) on cores that handles interfaces and CoreXL instances?
Interface speed check?
- Mark as New
- Bookmark
- Subscribe
- Mute
- Subscribe to RSS Feed
- Permalink
- Report Inappropriate Content
I know i need to move the green one still over to 64 bit. But like you are saying, it will not be a big win.
Top for Yellow (public)
I have allocated 10 Cores to the public VS
15 16 17 18 19 35 36 37 38
Cores allocated to the interface
| 1 | 21 | eth1-01 |
| 2 | 22 | eth1-02 |
| 3 | 23 | eth1-03 |
| 4 | 24 | eth1-04 |
| 5 | 25 | eth2-01 |
Top for green (internal)
I have also allocated 10 cores
8 9 10 11 12 24 25 26 27 28
Cores allocated to the interfaces
| 1 | 17 | eth1-01 |
| 2 | 18 | eth1-02 |
| 3 | 19 | eth1-03 |
| 4 | 20 | eth1-04 |
Interfaces on yellow
This is the public facing interface
[Expert@vsx-lvn-pub2:2]# ethtool eth2-01.802
Settings for eth2-01.802:
Supported ports: [ TP ]
Supported link modes: 10baseT/Half 10baseT/Full
100baseT/Half 100baseT/Full
1000baseT/Full
Supports auto-negotiation: Yes
Advertised link modes: 1000baseT/Full
Advertised auto-negotiation: Yes
Speed: 1000Mb/s
Duplex: Full
Port: Twisted Pair
PHYAD: 1
Transceiver: internal
Auto-negotiation: on
Supports Wake-on: pumbg
Wake-on: d
Current message level: 0x00000007 (7)
Link detected: yes
Internal interface on yellow going the green
[Expert@vsx-lvn-pub2:2]# ethtool eth1-02.724
Settings for eth1-02.724:
Supported ports: [ FIBRE ]
Supported link modes: 1000baseT/Full
10000baseT/Full
Supports auto-negotiation: Yes
Advertised link modes: 1000baseT/Full
10000baseT/Full
Advertised auto-negotiation: Yes
Speed: 10000Mb/s
Duplex: Full
Port: FIBRE
PHYAD: 0
Transceiver: external
Auto-negotiation: on
Supports Wake-on: d
Wake-on: d
Current message level: 0x00000007 (7)
Link detected: yes
Intefaces on green
Vlan going to the public (yellow)
[Expert@vsx-lvn-int2:1]# ethtool eth1-04.724
Settings for eth1-04.724:
Supported ports: [ FIBRE ]
Supported link modes: 1000baseT/Full
10000baseT/Full
Supports auto-negotiation: Yes
Advertised link modes: 1000baseT/Full
10000baseT/Full
Advertised auto-negotiation: Yes
Speed: 10000Mb/s
Duplex: Full
Port: FIBRE
PHYAD: 0
Transceiver: external
Auto-negotiation: on
Supports Wake-on: d
Wake-on: d
Current message level: 0x00000007 (7)
Link detected: yes
Interface going to the LAN (user networks)
[Expert@vsx-lvn-int2:1]# ethtool eth1-03.248
Settings for eth1-03.248:
Supported ports: [ FIBRE ]
Supported link modes: 1000baseT/Full
10000baseT/Full
Supports auto-negotiation: Yes
Advertised link modes: 1000baseT/Full
10000baseT/Full
Advertised auto-negotiation: Yes
Speed: 10000Mb/s
Duplex: Full
Port: FIBRE
PHYAD: 0
Transceiver: external
Auto-negotiation: on
Supports Wake-on: d
Wake-on: d
Current message level: 0x00000007 (7)
Link detected: yes
[Expert@vsx-lvn-int2:1]#
- Mark as New
- Bookmark
- Subscribe
- Mute
- Subscribe to RSS Feed
- Permalink
- Report Inappropriate Content
All looking pretty good, nothing is overly utilised from CP point of view.
Can you just double-check the physical interface state, not VLAN. I mean ethtool eth1-03 for example
Have you checked the switch side on all these ports?
Check netstat -ni for any errors
Try packet capture analyses - see if it's a latency, packet loss causing "slow" throughput
- Mark as New
- Bookmark
- Subscribe
- Mute
- Subscribe to RSS Feed
- Permalink
- Report Inappropriate Content
After comparing tcp packets from the vsx with the 5800.
I noticed that packets are set with SYN, ECN, CRW flags on the VSX and not on the 5800
- Mark as New
- Bookmark
- Subscribe
- Mute
- Subscribe to RSS Feed
- Permalink
- Report Inappropriate Content
What boxes did you have there before 23500? Was it VSX?
- Mark as New
- Bookmark
- Subscribe
- Mute
- Subscribe to RSS Feed
- Permalink
- Report Inappropriate Content
We had dell openservers. Before the 23500.
- Mark as New
- Bookmark
- Subscribe
- Mute
- Subscribe to RSS Feed
- Permalink
- Report Inappropriate Content
Please provide output from following commands on yellow:
netstat -ni
enabled_blades
fwaccel stat
Due to the extremely high PXL you almost certainly need to optimize your APCL/URLF and Threat Prevention rules to keep them from sucking so much traffic into PXL and then expending large amounts of CPU while in there. Try the following experiment in the public VS:
0) Baseline and note throughput through yellow
1) Run command ips off
2) Wait 60 seconds
3) Measure and note throughput through yellow
4) Run command fw amw unload
5) Measure and note throughput through yellow
6) Run command ips on
7) Run command fw amw fetch local
8) Uncheck APCL and URLF checkboxes on yellow gateway object, reinstall policy
9) Measure and note throughput through yellow
10) Recheck APCL and URLF checkboxes on yellow gateway, reinstall policy
11) Measure and note throughput through yellow
Did you see a big jump in throughput at steps 3, 5, or 9? That's telling you where you need to optimize your policy. You can also try having IPS/TP/APCL/URLF all disabled at the same time, but I prefer doing them one by one.
--
Second Edition of my "Max Power" Firewall Book
Now Available at http://www.maxpowerfirewalls.com
New Book: "Max Power 2026" Coming Soon
Check Point Firewall Performance Optimization
Check Point Firewall Performance Optimization
- Mark as New
- Bookmark
- Subscribe
- Mute
- Subscribe to RSS Feed
- Permalink
- Report Inappropriate Content
[Expert@vsx-lvn-pub2:2]# netstat -ni
Kernel Interface table
Iface MTU Met RX-OK RX-ERR RX-DRP RX-OVR TX-OK TX-ERR TX-DRP TX-OVR Flg
eth1-01.224 1500 0 447240389 0 0 0 23927329 0 0 0 BMRU
eth1-01.408 1500 0 2783866253 0 0 0 42747743 0 0 0 BMRU
eth1-02.246 1500 0 17196791 0 0 0 1217183 0 0 0 BMRU
eth1-02.724 1500 0 3682224371 0 0 0 145588068 0 0 0 BMRU
eth1-02.754 1500 0 1226700914 0 0 0 86991479 0 0 0 BMRU
eth1-03.166 1500 0 764551 0 0 0 692688 0 0 0 BMRU
eth1-03.706 1500 0 392240861 0 0 0 4343944 0 0 0 BMRU
eth1-03.716 1500 0 30807176 0 0 0 863851 0 0 0 BMRU
eth1-04.119 1500 0 715363 0 0 0 737135 0 0 0 BMRU
eth1-04.715 1500 0 18392928 0 0 0 2414008 0 0 0 BMRU
lo2 16436 0 48000466 0 0 0 48000466 0 0 0 LRU
wrp128 1500 0 299687 0 0 0 164267858 0 0 0 BMRU
[Expert@vsx-lvn-pub2:2]# enabled_blades
fw vpn urlf av appi ips anti_bot mon vpn
[Expert@vsx-lvn-pub2:2]#
[Expert@vsx-lvn-pub2:2]# fwaccel stat
Accelerator Status : on
Accept Templates : enabled
Drop Templates : enabled
NAT Templates : disabled by user
NMR Templates : enabled
NMT Templates : enabled
Accelerator Features : Accounting, NAT, Cryptography, Routing,
HasClock, Templates, Synchronous, IdleDetection,
Sequencing, TcpStateDetect, AutoExpire,
DelayedNotif, TcpStateDetectV2, CPLS, McastRouting,
WireMode, DropTemplates, NatTemplates,
Streaming, MultiFW, AntiSpoofing, Nac,
ViolationStats, AsychronicNotif, ERDOS,
McastRoutingV2, NMR, NMT, NAT64, GTPAcceleration,
SCTPAcceleration
Cryptography Features : Tunnel, UDPEncapsulation, MD5, SHA1, NULL,
3DES, DES, CAST, CAST-40, AES-128, AES-256,
ESP, LinkSelection, DynamicVPN, NatTraversal,
EncRouting, AES-XCBC, SHA256
I'm working on the throughput stats.
- Mark as New
- Bookmark
- Subscribe
- Mute
- Subscribe to RSS Feed
- Permalink
- Report Inappropriate Content
Thanks for the outputs that all looks clean, pretty sure policy optimizations are going to be what you need...
--
Second Edition of my "Max Power" Firewall Book
Now Available at http://www.maxpowerfirewalls.com
New Book: "Max Power 2026" Coming Soon
Check Point Firewall Performance Optimization
Check Point Firewall Performance Optimization
- Mark as New
- Bookmark
- Subscribe
- Mute
- Subscribe to RSS Feed
- Permalink
- Report Inappropriate Content
I think we identified the issue.
After running the command fw amw unload throughput was normal.
We are running a legacy threat prevention policy, so i need to find a way to rework this.
Thanks Timothy Merritt
- Mark as New
- Bookmark
- Subscribe
- Mute
- Subscribe to RSS Feed
- Permalink
- Report Inappropriate Content
Great news! I was about to suggest to turn off advanced inspection blades! Nice work!
- Mark as New
- Bookmark
- Subscribe
- Mute
- Subscribe to RSS Feed
- Permalink
- Report Inappropriate Content
Dear Bart, all,
Bart:
- Are the users happy now?
- Have you opened a Check Point TAC case for the Threat Protection issue? If yes, any feedback?
It looks like I experience the same issue, but then for R80.20 GA VSX/VSLS on 23800 appliances.
The 23800 appliances are freshly installed (i.e. not upgraded from a previous release). On 01/11/2018 - after doing some iPerf3 tests on our 23800 VSX/VSLS pair running R80.20 GA - I opened a TAC case (3-0612566491).
Feedback on the tests:
Diagram of the lab:
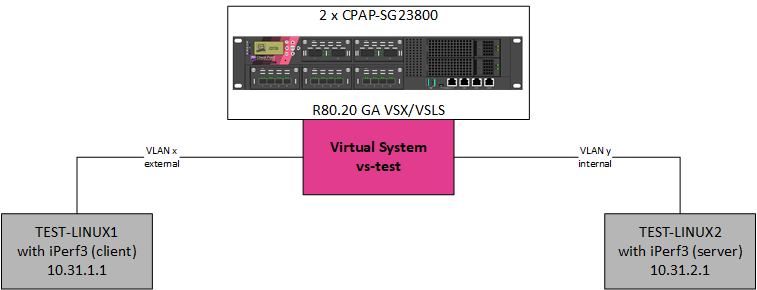
The maximum bandwidth/throughput between TEST-LINUX1 and TEST-LINUX2 is 10 Gbps.
Measured bandwidth between TEST-LINUX1 and TEST-LINUX2 without firewall is 9.10 Gbps.
The test results between TEST-LINUX1 and TEST-LINUX2, when using virtual system vs-test (running on the 23800s):
| Source | Destination | Enabled software blades | Profile | Bandwidth (measured at source) | Bandwidth (measured at destination) | Acceptable |
|---|---|---|---|---|---|---|
| TEST-LINUX1 | TEST-LINUX2 | Firewall | N.A. | 7.20 Gbps | 7.20 Gbps | Yes |
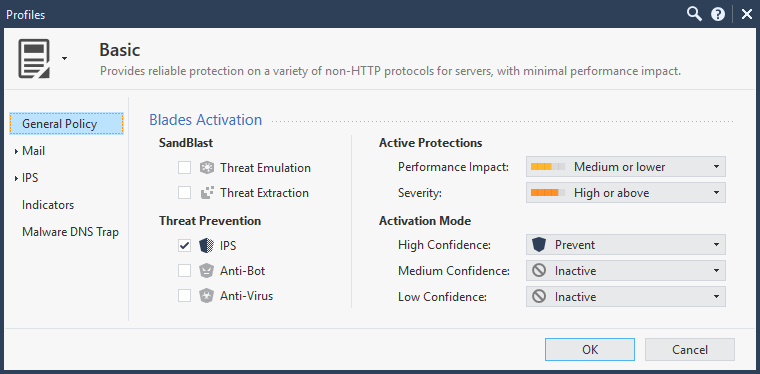
| TEST-LINUX1 | TEST-LINUX2 | Firewall + IPS | Basic | 7.15 Gbps | 7.15 Gpbs | Yes |
| TEST-LINUX1 | TEST-LINUX2 | Firewall + IPS | Optimized | 1.05 Gbps | 1.05 Gbps | No, see [1] |
| TEST-LINUX1 | TEST-LINUX2 | Firewall + IPS | Strict | 675 Mbps | 675 Mbps | No, see [1] |
| TEST-LINUX1 | TEST-LINUX2 | Firewall + IPS | Customized | Max. 7.0 Gbps | Max. 7.0 Gbps | It depends. |
For the customized profile: the more inspections you turn off, the better the performance becomes.
For a datacenter firewall - when using the optimized profile on the virtual system vs-test - you wouldn't expect that the performance would go down so drastically.
I ran the same tests on an open server (Dell R720) too. A big suprise is the following:
- R80.20 GA with VSX/VSLS: approximately the same results as mentioned in the table.
- However, R80.20 GA without VSX/VSLS (i.e. a regular gateway): the throughput - when using the optimized profile - goes up to 5.5 Gbps.
Is there anybody else from the community that can do the same tests?
Probably I made some mistakes during yesterday's bleary-eyed night (see [2], page 273).
Meanwhile, let's wait for the feedback from Check Point TAC.
Many thanks.
Regards,
Kris
References:
[1] Check Point 23800 Security Gateway Datasheet
[2] Max Power: Check Point Firewall Performance Optimization (Second Edition), Timothy C. Hall
[3] The tips and tricks from Kaspars, Tim, and all other community members.
[4] Check Point TAC case 3-0612566491.
- Mark as New
- Bookmark
- Subscribe
- Mute
- Subscribe to RSS Feed
- Permalink
- Report Inappropriate Content
Dear all,
After rebooting both 23800 appliances, the bandwidth - when using the optimized profile - went up.
After reading pages 308-315 in Tim's book (a book which I highly recommended to read), I customized the profile to:
After the policy redeployment, I initiated 4 connections from the linux client to the linux server using iPerf3. The measured bandwidth through the virtual system was max 1.25 Gbits/sec (per connection).
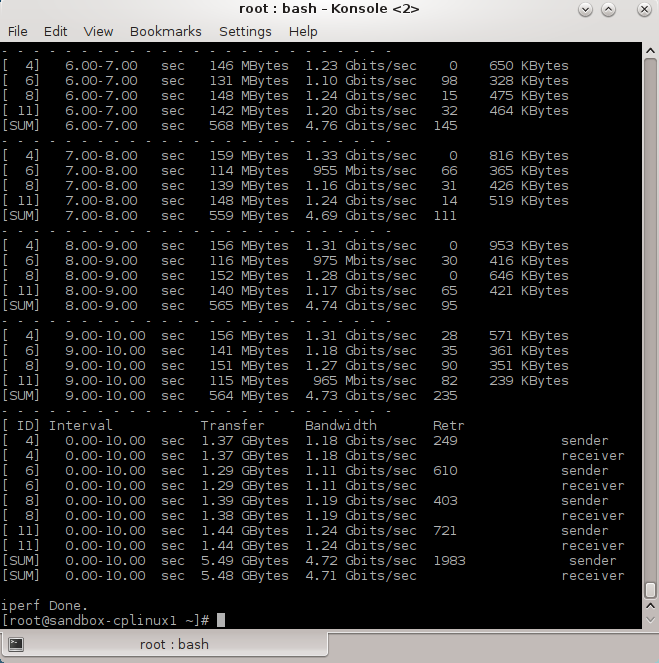
During the test, you see on the virtual system (top -H) some spiking CPUs (COMMAND fwk*):

When increasing the number of connections (read: users), the bandwidth available per connection (read: user) will become less.
E.g. for 60 connections, I measured a throughput of max. 100 Mbits/sec. At peak moments, when the untrusted Apple Mac mini (with the optional 10GigE NIC) user is transfering big photoshop files to a file server behind the virtual system, all hell breaks loose.
Meanwhile I've spoken with the Check Point TAC engineer; he mentioned, in order to gain performance on the virtual system, you must exclude the inspections you might think you do not need ... and that's more than a full time job.
Regards,
Kris
- Mark as New
- Bookmark
- Subscribe
- Mute
- Subscribe to RSS Feed
- Permalink
- Report Inappropriate Content
Timothy Hall, can you chime in on the post above?
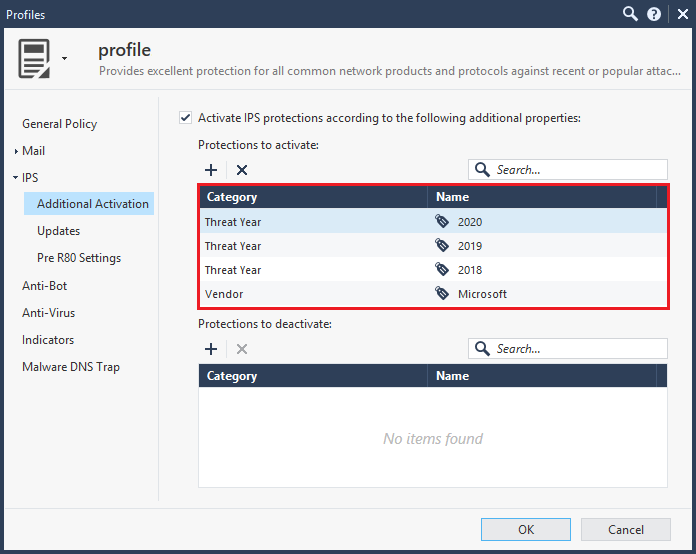
I have a question regarding "Additional activations" based on the tags:
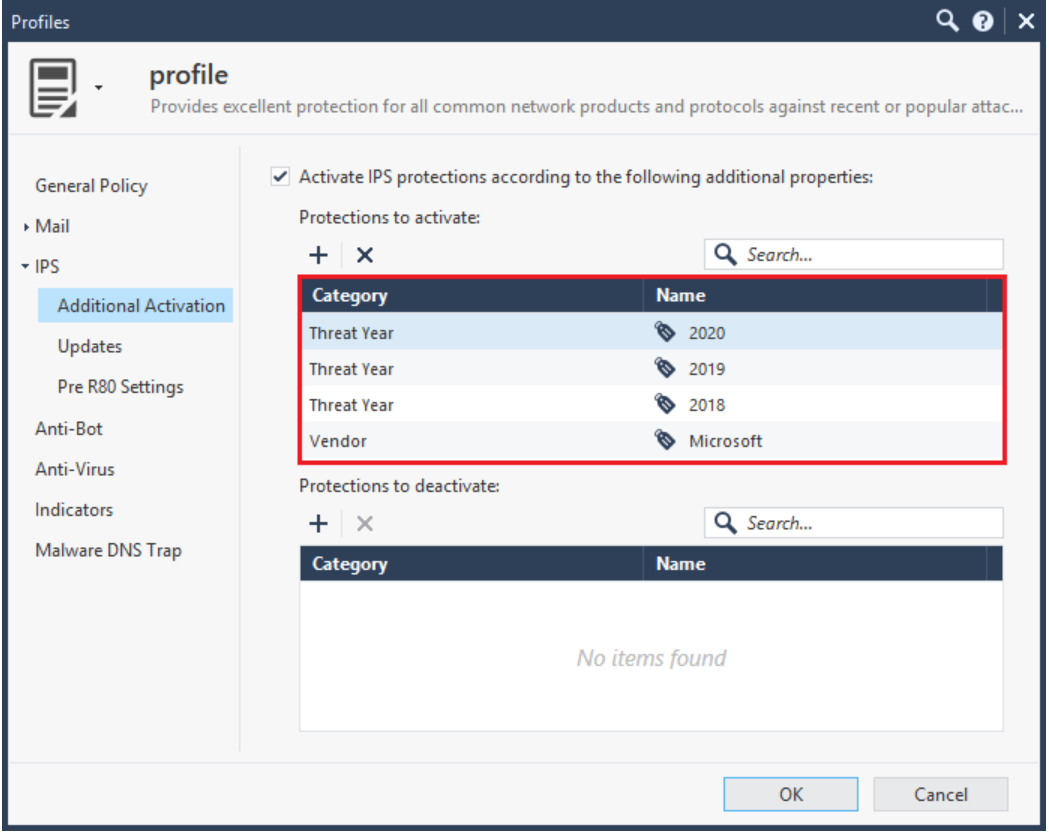
Would this override the selected profile activation or simply release the protections from staging into whatever selected profile dictates them to be, either Detect or Protect?
- Mark as New
- Bookmark
- Subscribe
- Mute
- Subscribe to RSS Feed
- Permalink
- Report Inappropriate Content
If an IPS Protection matches an Additional Activation tag under Protections to Activate:
1) A newly-downloaded Protection acquired in an IPS update will bypass staging mode and go straight to Prevent assuming that it meets the other General Policy criteria.
2) The General Policy rating criteria such as Performance Impact, Confidence, and Severity will still be considered and the matching IPS Protection may be activated.
3) The 39 "Core Activation" signatures (shield w/ firewall icon) are NOT impacted by Additional Activations; hopefully it goes without saying that Inspection Settings will not be affected by Additional Activations either.
--
Second Edition of my "Max Power" Firewall Book
Now Available at http://www.maxpowerfirewalls.com
New Book: "Max Power 2026" Coming Soon
Check Point Firewall Performance Optimization
Check Point Firewall Performance Optimization
- Mark as New
- Bookmark
- Subscribe
- Mute
- Subscribe to RSS Feed
- Permalink
- Report Inappropriate Content
In the meantime i figured it out how to optimize the threat prevention policy, unfortunately without any luck.
The download speed is still very low.
If i run the command fw amw unload everything performs well.
So i would assume that after do fw amw fetch local and then remove all blades from the firewall object would give me the same result, but no luck at all. This means with all threat prevention blades removed, so i assume that no threat prevention policy is active on that moment the download performance still sucks.
We don't see this behavior on a stand alone appliance or open server. We have this on all of our VSX clusters.
- Mark as New
- Bookmark
- Subscribe
- Mute
- Subscribe to RSS Feed
- Permalink
- Report Inappropriate Content
Hi Bart,
I'm also troubleshooting the issue you are experiencing.
What's the performance you get when you are selecting the basic profile in the Threat Prevention Policy?
When I select the optimized profile (with the latest IPS update), I get slow performance for both standalone (Open Server) and VSX (Open Server and 23800); for a single connection throughput drops from 7 Gbps (basic) to 700 Mbps (optimized).
When you deselect all the blades on the virtual system, you first have to do a fw amw unload and then redeploy the policy from SmartConsole.
Check Point TAC is now investigating it for our set-up; I will let you know once they provide feedback (I'm already waiting for 5 days now).
Kind regards,
Kris
- Mark as New
- Bookmark
- Subscribe
- Mute
- Subscribe to RSS Feed
- Permalink
- Report Inappropriate Content
The basic profile is giving me exactly the same performance as my customized profile
- Mark as New
- Bookmark
- Subscribe
- Mute
- Subscribe to RSS Feed
- Permalink
- Report Inappropriate Content
This thread is starting to get hard to follow due to all the participants, and we should probably see what TAC has to say. Based on where things stand now I do have a few observations:
1) While I am not a VSX expert, the difference you are seeing with IPS between a VSX host and a bare metal firewall appliance may come down to where the Medium and F2F paths are processed. On a bare metal gateway all three paths are handled in the kernel (as well as SoftIRQ functions) which can be done pretty efficiently. However on the VSX system I believe the SXL/fastpath (along with SoftIRQ) is handled in the kernel, but the Medium Path and Firewall Path are handled in process space by fwk. Any time a transition is required between kernel and process space on any OS you are going to take a performance hit - there is really no way around it. However the hit being reported seems awfully high to be completely explained by this effect.
2) R80.10 VSX does not have the Dynamic Dispatcher, as such similar flows of traffic can and will congregate on a single fwk instance and promptly pound it to 100% utilization thus limiting performance.
3) A single elephant flow can only be handled by one Firewall Worker Core/Kernel Instance/fwk and cannot be spread around to multiple cores, regardless of whether the Dynamic Dispatcher is present or not. Trying to do so would raise the specter of out-of-order delivery which is a unmitigated disaster from a TCP performance perspective; doing iperf tests is essentially creating elephant flows so keep that in mind.
4) Try setting up a so-called TP "null profile" matching traffic that you want to benchmark with iperf, by unchecking all five TP blades on it. This should allow matching traffic to be fully accelerated in the kernel by SecureXL assuming some other blade such as APCL or URLF is not calling for PXL inspection on that traffic. Note that a TP exception *will not* improve performance in any meaningful way, it simply changes the action/decision rendered by TP once inspection has already been performed in PXL/F2F.
--
Second Edition of my "Max Power" Firewall Book
Now Available at http://www.maxpowerfirewalls.com
New Book: "Max Power 2026" Coming Soon
Check Point Firewall Performance Optimization
Check Point Firewall Performance Optimization
- Mark as New
- Bookmark
- Subscribe
- Mute
- Subscribe to RSS Feed
- Permalink
- Report Inappropriate Content
I am now reading through your @Timothy Hall book and i noticed next thing.
with the command show routed cluster-state detailed i see this
vsx-lvn-pub2:0> show routed cluster-state detailed
show instance 0 routed cluster-state detailed
Cluster: Clustered
Master/Slave: Slave
Master IP: NO_MASTER_ADDRESS
Sync IP: 10.100.118.2
Cluster Sync: In_Progress
Last Sent: NO_MESSAGE_SENT
Last Received: NO_MESSAGE_RECEIVED
Cluster Sync: In_Progress
Does this means that synchronization can't be finalized?
btw: it's a very interesting book, it's a must have.
Leaderboard
Epsum factorial non deposit quid pro quo hic escorol.
| User | Count |
|---|---|
| 13 | |
| 7 | |
| 5 | |
| 3 | |
| 2 | |
| 2 | |
| 1 | |
| 1 | |
| 1 | |
| 1 |
Upcoming Events
Tue 28 Jul 2026 @ 11:00 AM (EDT)
Under the Hood - Check Point and Illumio – Modern Network Defense Against AI-Based ThreatsWed 29 Jul 2026 @ 12:00 PM (SGT)
The AI Security Report 2026: A Turning Point for Enterprise Defense - SGTWed 29 Jul 2026 @ 02:00 PM (IDT)
The AI Security Report 2026: A Turning Point for Enterprise Defense - AMERWed 29 Jul 2026 @ 03:00 PM (CEST)
The AI Security Report 2026: A Turning Point for Enterprise Defense EMEATue 28 Jul 2026 @ 11:00 AM (EDT)
Under the Hood - Check Point and Illumio – Modern Network Defense Against AI-Based ThreatsWed 29 Jul 2026 @ 12:00 PM (SGT)
The AI Security Report 2026: A Turning Point for Enterprise Defense - SGTWed 29 Jul 2026 @ 02:00 PM (IDT)
The AI Security Report 2026: A Turning Point for Enterprise Defense - AMERWed 29 Jul 2026 @ 03:00 PM (CEST)
The AI Security Report 2026: A Turning Point for Enterprise Defense EMEAThu 30 Jul 2026 @ 10:00 AM (PDT)
AI Security Masters E12: READY OR NOT: Securing the AI Enterprise 4/5 - AI GatewayThu 20 Aug 2026 @ 08:30 AM (COT)
Medellin: Workspace Evolution: Hybrid Mesh Management - Visibilidad, Automatización e IAThu 20 Aug 2026 @ 06:00 PM (COT)
Medellin: Workspace Intelligence: IA Generativa en Acción para Equipos de SeguridadAbout CheckMates
Learn Check Point
Advanced Learning
YOU DESERVE THE BEST SECURITY

©1994-2026 Check Point Software Technologies Ltd. All rights reserved.
Copyright
Privacy Policy
About Us
UserCenter