- Products
- Learn
- Local User Groups
- Partners
- More

This website uses Cookies. Click Accept to agree to our website's cookie use as described in our Privacy Policy. Click Preferences to customize your cookie settings.
- Products
- Learn
- Local User Groups
- Upcoming Events
- Americas
- EMEA
- Czech Republic and Slovakia
- Denmark
- Netherlands
- Germany
- Sweden
- United Kingdom and Ireland
- France
- Spain
- Norway
- Ukraine
- Baltics and Finland
- Greece
- Portugal
- Austria
- Kazakhstan and CIS
- Switzerland
- Romania
- Turkey
- Belarus
- Belgium & Luxembourg
- Russia
- Poland
- Georgia
- DACH - Germany, Austria and Switzerland
- Iberia
- Africa
- Adriatics Region
- Eastern Africa
- Israel
- Nordics
- Middle East and Africa
- Balkans
- Italy
- Bulgaria
- Cyprus
- APAC
- Partners
- More
- ABOUT CHECKMATES & FAQ
- Sign In
- Leaderboard
- Events
The State of Ransomware Q1 2026
Key Trends and Their Impact
Good, Better, Best:
Prioritizing Defenses Against Credential Abuse
AI Security Masters E7:
How CPR Broke ChatGPT's Isolation and What It Means for You
Blueprint Architecture for Securing
The AI Factory & AI Data Center
Call For Papers
Your Expertise. Our Stage
CheckMates Go:
CheckMates Fest
Turn on suggestions
Auto-suggest helps you quickly narrow down your search results by suggesting possible matches as you type.
Showing results for
- CheckMates
- :
- Products
- :
- Hybrid Mesh
- :
- Firewall and Security Management
- :
- Re: IPS Analyzer Tool - are you running it?
Options
- Subscribe to RSS Feed
- Mark Topic as New
- Mark Topic as Read
- Float this Topic for Current User
- Bookmark
- Subscribe
- Mute
- Printer Friendly Page
Turn on suggestions
Auto-suggest helps you quickly narrow down your search results by suggesting possible matches as you type.
Showing results for
Are you a member of CheckMates?
×
Sign in with your Check Point UserCenter/PartnerMap account to access more great content and get a chance to win some Apple AirPods! If you don't have an account, create one now for free!
- Mark as New
- Bookmark
- Subscribe
- Mute
- Subscribe to RSS Feed
- Permalink
- Report Inappropriate Content
Jump to solution
IPS Analyzer Tool - are you running it?
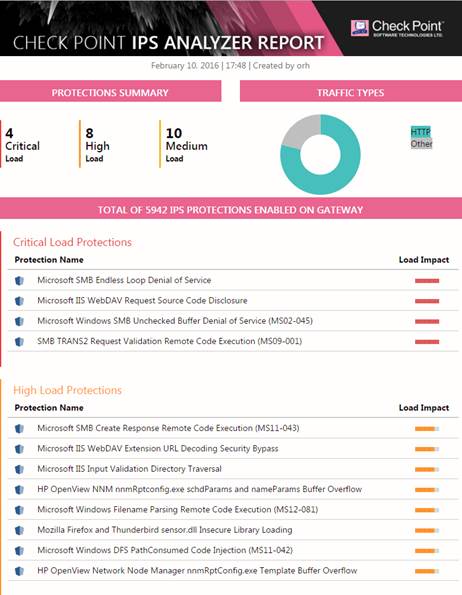
The IPS Analyzer Tool runs on your gateway for a short amount of time, and issues an HTML report of which individual IPS protections took the most CPU and RAM on the gateway during the runtime of the tool.
Supported Gateways are R77 and above.
For more information go to IPS Analyzer Tool - How to analyze IPS performance efficiently
I wanted to use this thread to ask who is running it and what are your thoughts of it.
Q: Why can't I run it from SmartConsole by default?
A: We plan to add that in one of our next releases.
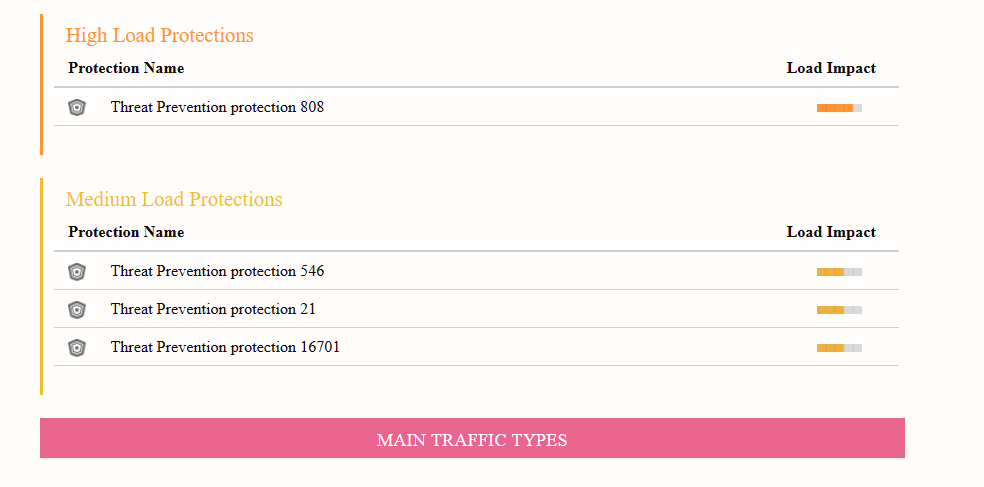
(Don't mind the actual names of the protections in this screenshot, this image is not a result of a run on an actual gateway, it is a random generation of existing protection names, just to showcase the report's look and feel):
2 Solutions
Accepted Solutions
- Mark as New
- Bookmark
- Subscribe
- Mute
- Subscribe to RSS Feed
- Permalink
- Report Inappropriate Content
See above, the tool is discontinued.
- Mark as New
- Bookmark
- Subscribe
- Mute
- Subscribe to RSS Feed
- Permalink
- Report Inappropriate Content
Hey Tomer & All
I will like to share with you the following 2 SK that you can use in case you want to do Performance investigation & Protection Impact understanding .
Solution 1:
From version 81.10 , we have a better tool than the Analyzer, the tool was migrated on top of the HCP tool ( See SK171436 - HeathCheck Point HCP ) , once you install the HCP it will be possible to see the protections impact on the system in the final report under the Threat Prevention section.
In order to see the Threat Prevention in the HCP report do the following :
- hcp --enable-product "Threat Prevention"
- hcp -r all
it is possible to open the hcp report from inside the smart console using the HCP extension add-on , see "SmartConsole Extension Installation" section from the HCP SK. if you don't want to use the extension in the smart console , please copy and paste the report from the gateway to your windows environment explore it .


Solution 2:
See sk167553 - "Performance Investigation Procedure - How To"
The Threat Prevention team created this SK in order to support customers for most common performance investigations , it has almost everything the Threat Prevention team do while investigating system under load .
Hope this answer give you answers for all your questions .
24 Replies
- Mark as New
- Bookmark
- Subscribe
- Mute
- Subscribe to RSS Feed
- Permalink
- Report Inappropriate Content
- Mark as New
- Bookmark
- Subscribe
- Mute
- Subscribe to RSS Feed
- Permalink
- Report Inappropriate Content
Thank you,
It is a little bit complicated to get by an e-mail.
==============================================
For getting the latest version of Analyzer tool please contact:
IPS_Analyzer_Tool@checkpoint.com
==============================================
- Mark as New
- Bookmark
- Subscribe
- Mute
- Subscribe to RSS Feed
- Permalink
- Report Inappropriate Content
I tried to use it, but never got useful output.
First, I did not enjoy using it because with MDS and VSX, there are many steps to perform manually to get visible output.
And second, most of the time my IPS Analyzer output was empty. I am not sure if this was due to "IPS Bypass under load" or simply no relevant connections during my run.
So, third, I was missing a concise instruction like how long to run the capture to get useful output, wether it captures only new connections during the run or also existing connections.
- Mark as New
- Bookmark
- Subscribe
- Mute
- Subscribe to RSS Feed
- Permalink
- Report Inappropriate Content
Hey!
I tried to use it today for a customer and received twice some confusing, incomplete results...there were no protection names. Any idea?
Thx,
Mircea
- Mark as New
- Bookmark
- Subscribe
- Mute
- Subscribe to RSS Feed
- Permalink
- Report Inappropriate Content
Same here.
Any hints to resolve are appreciated.
- Mark as New
- Bookmark
- Subscribe
- Mute
- Subscribe to RSS Feed
- Permalink
- Report Inappropriate Content
The tool can now be downloaded from here:
- Mark as New
- Bookmark
- Subscribe
- Mute
- Subscribe to RSS Feed
- Permalink
- Report Inappropriate Content
Hello, is this tool available for R80.40 or is there something better? I tried to access the link but get an "Access Denied", even when logged in.
You do not have sufficient privileges for this resource or its parent to perform this action.
- Mark as New
- Bookmark
- Subscribe
- Mute
- Subscribe to RSS Feed
- Permalink
- Report Inappropriate Content
Hello,
I, also, wanted to use the IPS Analyzer to verify something in the lab. The SK shows "Access Denied" even tough I can find it an it is listed as "Access Level: Basic".
As @Tomer_Sole seems to be inactive, maybe @Omer_Shliva can give us an explanation?
Kind regards, Arne
- Mark as New
- Bookmark
- Subscribe
- Mute
- Subscribe to RSS Feed
- Permalink
- Report Inappropriate Content
Hi Arne, the tool is retired, and SK is not longer available. Mind, this post is 4 years old.
- Mark as New
- Bookmark
- Subscribe
- Mute
- Subscribe to RSS Feed
- Permalink
- Report Inappropriate Content
I found this tool quite helpful. Is there any new tool for analyzing performance of IPS and maybe even other Blades? Would be really cool to see something like FW is only taking 20% CPU Usage, but IPS adds another 10% and AV/AB 20% etc..
- Mark as New
- Bookmark
- Subscribe
- Mute
- Subscribe to RSS Feed
- Permalink
- Report Inappropriate Content
Hi Val,
thank you for the quick response. I found it implemented as "ips stats" and "ips pmstats" and will give it a try with R81.10.
Nonetheless it would be helpful to place this information in an SK article, because a search for "IPS Analyzer" lists sk110737, the popup help lists R81.10 as relevant, but the SK does not load with an error message.
Kind regards, Arne
- Mark as New
- Bookmark
- Subscribe
- Mute
- Subscribe to RSS Feed
- Permalink
- Report Inappropriate Content
What kind of search are you referring to, Google?
- Mark as New
- Bookmark
- Subscribe
- Mute
- Subscribe to RSS Feed
- Permalink
- Report Inappropriate Content
Support Page actually displays this:

- Mark as New
- Bookmark
- Subscribe
- Mute
- Subscribe to RSS Feed
- Permalink
- Report Inappropriate Content
Hmmm, might be a caching issue, thanks for reporting. I will pass it on to the Support Center ppl
- Mark as New
- Bookmark
- Subscribe
- Mute
- Subscribe to RSS Feed
- Permalink
- Report Inappropriate Content
Hi Val,
I'm just curious if this tool shows the percentage of CPU utilization for each protection name in the report as well.
I've never used this tool before and would like to know how much CPU each IPS protection consumes.
Regards,
Sarm
- Mark as New
- Bookmark
- Subscribe
- Mute
- Subscribe to RSS Feed
- Permalink
- Report Inappropriate Content
See above, the tool is discontinued.
- Mark as New
- Bookmark
- Subscribe
- Mute
- Subscribe to RSS Feed
- Permalink
- Report Inappropriate Content
Hi Val,
I saw your comment about the tool being discontinued, and I am just wondering if the IPS analyzer tool provides information like the percentage of CPU used for each protection. I'm looking for a way to track how much CPU utilization each IPS protection consumes.
I'd really appreciate it if you could answer here.
Regards,
Sarm
- Mark as New
- Bookmark
- Subscribe
- Mute
- Subscribe to RSS Feed
- Permalink
- Report Inappropriate Content
You may want to give the newer IPS Collector a try, but it is not clear whether it is supported beyond R81.10:
sk128432: IPS Collector: On demand troubleshooting tool for customers
New Book: "Max Power 2026" Coming Soon
Check Point Firewall Performance Optimization
Check Point Firewall Performance Optimization
- Mark as New
- Bookmark
- Subscribe
- Mute
- Subscribe to RSS Feed
- Permalink
- Report Inappropriate Content
Asking about obsolete tool capabilities is rather pointless, don't you think?
Performance impact is showing for each protection as Low/Moderate/High, but converting it to a precise percentage is tricky because it all depends on the traffic.
What are you trying to achieve, exactly?
- Mark as New
- Bookmark
- Subscribe
- Mute
- Subscribe to RSS Feed
- Permalink
- Report Inappropriate Content
Hey Tomer & All
I will like to share with you the following 2 SK that you can use in case you want to do Performance investigation & Protection Impact understanding .
Solution 1:
From version 81.10 , we have a better tool than the Analyzer, the tool was migrated on top of the HCP tool ( See SK171436 - HeathCheck Point HCP ) , once you install the HCP it will be possible to see the protections impact on the system in the final report under the Threat Prevention section.
In order to see the Threat Prevention in the HCP report do the following :
- hcp --enable-product "Threat Prevention"
- hcp -r all
it is possible to open the hcp report from inside the smart console using the HCP extension add-on , see "SmartConsole Extension Installation" section from the HCP SK. if you don't want to use the extension in the smart console , please copy and paste the report from the gateway to your windows environment explore it .
Solution 2:
See sk167553 - "Performance Investigation Procedure - How To"
The Threat Prevention team created this SK in order to support customers for most common performance investigations , it has almost everything the Threat Prevention team do while investigating system under load .
Hope this answer give you answers for all your questions .
- Mark as New
- Bookmark
- Subscribe
- Mute
- Subscribe to RSS Feed
- Permalink
- Report Inappropriate Content
Thanks so much, this will be very helpful for a new offering I am currently working on.
New Book: "Max Power 2026" Coming Soon
Check Point Firewall Performance Optimization
Check Point Firewall Performance Optimization
- Mark as New
- Bookmark
- Subscribe
- Mute
- Subscribe to RSS Feed
- Permalink
- Report Inappropriate Content
Hi L_Daniel
Thank you so much for sharing this, I will give it a try.
Regards,
Sarm
- Mark as New
- Bookmark
- Subscribe
- Mute
- Subscribe to RSS Feed
- Permalink
- Report Inappropriate Content
Hi,
Is it safe to run hcp along with TP enabled in production.
Will it have any impact on gateway operation ?
Thanks
- Mark as New
- Bookmark
- Subscribe
- Mute
- Subscribe to RSS Feed
- Permalink
- Report Inappropriate Content
Hello
In general it is another process that will run few tests and close itself, during the runtime it might take few system resources as any other task you run on the system.
You can either run the hcp as following:
1) execute all HCP tests and get a full report : hcp -r all ( this command will take more system resources )
2) execute only Threat Prevention tests and get TP report : hcp -r "Threat Prevention" (this command will take less resources that the previous one )
Hope i succeeded to help 🙂 .
Leaderboard
Epsum factorial non deposit quid pro quo hic escorol.
| User | Count |
|---|---|
| 33 | |
| 10 | |
| 10 | |
| 9 | |
| 9 | |
| 7 | |
| 7 | |
| 6 | |
| 6 | |
| 6 |
Upcoming Events
Tue 12 May 2026 @ 10:00 AM (CEST)
The Cloud Architects Series: Check Point Cloud Firewall delivered as a serviceWed 13 May 2026 @ 11:00 AM (EDT)
TechTalk: The State of Ransomware Q1 2026: Key Trends and Their ImpactThu 14 May 2026 @ 07:00 PM (EEST)
Under the Hood: Presentando Check Point Cloud Firewall como ServicioTue 12 May 2026 @ 10:00 AM (CEST)
The Cloud Architects Series: Check Point Cloud Firewall delivered as a serviceAbout CheckMates
Learn Check Point
Advanced Learning
YOU DESERVE THE BEST SECURITY

©1994-2026 Check Point Software Technologies Ltd. All rights reserved.
Copyright
Privacy Policy
About Us
UserCenter