


- Products
- Learn
- Local User Groups
- Partners
- More

Scaling Check Point Automation with Arodonata
7 October @ 5pm CET / 11am EDT
AI Security Masters
LGTM: Bypassing an LLM Build Gate
When Prompt Injection Fails
What's New in Check Point SASE
The State of Ransomware Q2 2026:
This Quarter's Trends, and Their Impact on Your Defenses
CheckMates Go:
Half is Not Enough

 Kaspars_Zibarts

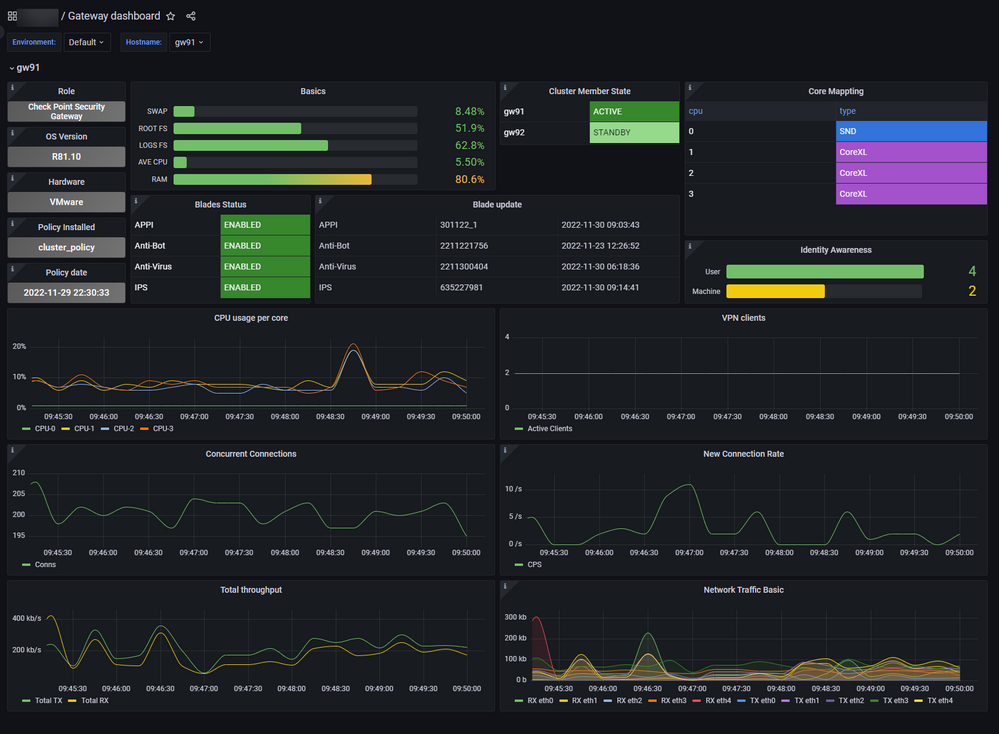
Here's another alternative for Skyline cluster dashboard that has:
Here's another alternative for Skyline cluster dashboard that has:


Thank you very much.
Like the Dashboard. Shows relevant information like concurrent conns, connection rate, VPN Users and single CPU performance graph. Let's you identify if some CPUs have 100% or not.
Missing the "Packets per second" graph. Need to check if I can add this on my own because I am not so familar with Grafana.
So I appreciate this provided dashboard!
Thank you very much.
Like the Dashboard. Shows relevant information like concurrent conns, connection rate, VPN Users and single CPU performance graph. Let's you identify if some CPUs have 100% or not.
Missing the "Packets per second" graph. Need to check if I can add this on my own because I am not so familar with Grafana.
So I appreciate this provided dashboard!

Thanks for the Dashboard.
There is a bug in "Blades Status". Your host_name is hardcoded
$ jq '.["panels"][7]["targets"][0]["expr"]' <Gateway-dashboard-KZ.json
"blades_update_state{host_name=~\"gw91\", environment=~\"Default\"}"
Tomas_Ruzicka

 PhoneBoy
Unfortunately, due to some CSS "design choices," the attachment for this comment is not showing.
Send it to me internally, I'll update the root post.


Just Check this
Just Check this
;
If I am not wrong completely this is grafana and the Extension is the one from Danny

About CheckMates
Learn Check Point
Advanced Learning

YOU DESERVE THE BEST SECURITY
