- Products
Network & SASE IoT Protect Maestro Management OpenTelemetry/Skyline Remote Access VPN SASE SD-WAN Security Gateways SmartMove Smart-1 Cloud SMB Gateways (Spark) Threat PreventionCloud Cloud Network Security CloudMates General CloudGuard - WAF Talking Cloud Podcast Weekly ReportsSecurity Operations Events External Risk Management Incident Response Infinity AI Infinity Portal NDR Playblocks SOC XDR/XPR Threat Exposure Management
- Learn
- Local User Groups
- Partners
- More
This website uses Cookies. Click Accept to agree to our website's cookie use as described in our Privacy Policy. Click Preferences to customize your cookie settings.
- Products
- AI Security
- Developers & More
- Check Point Trivia
- CheckMates Toolbox
- General Topics
- Products Announcements
- Threat Prevention Blog
- Upcoming Events
- Americas
- EMEA
- Czech Republic and Slovakia
- Denmark
- Netherlands
- Germany
- Sweden
- United Kingdom and Ireland
- France
- Spain
- Norway
- Ukraine
- Baltics and Finland
- Greece
- Portugal
- Austria
- Kazakhstan and CIS
- Switzerland
- Romania
- Turkey
- Belarus
- Belgium & Luxembourg
- Russia
- Poland
- Georgia
- DACH - Germany, Austria and Switzerland
- Iberia
- Africa
- Adriatics Region
- Eastern Africa
- Israel
- Nordics
- Middle East and Africa
- Balkans
- Italy
- Bulgaria
- Cyprus
- APAC
CheckMates Fest 2026
Join the Celebration!
AI Security Masters
E1: How AI is Reshaping Our World
MVP 2026: Submissions
Are Now Open!
What's New in R82.10?
Watch NowOverlap in Security Validation
Help us to understand your needs better
CheckMates Go:
R82.10 and Rationalizing Multi Vendor Security Policies
Turn on suggestions
Auto-suggest helps you quickly narrow down your search results by suggesting possible matches as you type.
Showing results for
- CheckMates
- :
- Products
- :
- Network & SASE
- :
- Security Gateways
- :
- Re: millions of dropped packets
Options
- Subscribe to RSS Feed
- Mark Topic as New
- Mark Topic as Read
- Float this Topic for Current User
- Bookmark
- Subscribe
- Mute
- Printer Friendly Page
Turn on suggestions
Auto-suggest helps you quickly narrow down your search results by suggesting possible matches as you type.
Showing results for
Are you a member of CheckMates?
×
Sign in with your Check Point UserCenter/PartnerMap account to access more great content and get a chance to win some Apple AirPods! If you don't have an account, create one now for free!
- Mark as New
- Bookmark
- Subscribe
- Mute
- Subscribe to RSS Feed
- Permalink
- Report Inappropriate Content
Jump to solution
millions of dropped packets
Hello All,
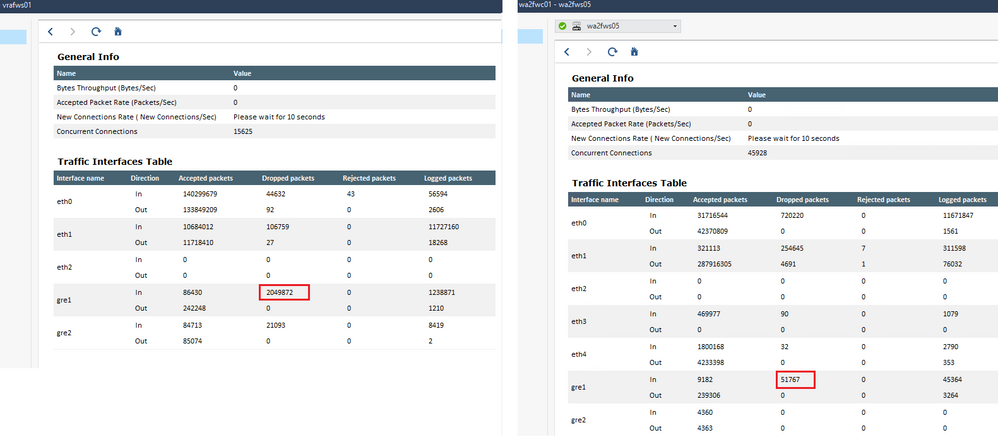
we have several GW R81.10 with a GRE interface configured. The GRE together with Policy Based Routing is used for Zscaler. On one Firewall at the headquarters we see only 50k dropped packets, but on another branch, we see over 2M dropped packets. How can I find out, what is dropped?
Thank you!
1 Solution
Accepted Solutions
- Mark as New
- Bookmark
- Subscribe
- Mute
- Subscribe to RSS Feed
- Permalink
- Report Inappropriate Content
12 Replies
- Mark as New
- Bookmark
- Subscribe
- Mute
- Subscribe to RSS Feed
- Permalink
- Report Inappropriate Content
It is not clear if the drops being reported there are policy drops, or interface buffering drops (RX-DRP). Please post the output of:
netstat -ni
ifconfig gre1
ethtool -S gre1 (this may not work)
Gaia 4.18 (R82) Immersion Tips, Tricks, & Best Practices Video Course
Now Available at https://shadowpeak.com/gaia4-18-immersion-course
Now Available at https://shadowpeak.com/gaia4-18-immersion-course
- Mark as New
- Bookmark
- Subscribe
- Mute
- Subscribe to RSS Feed
- Permalink
- Report Inappropriate Content
[Expert@vrafws01:0]# netstat -ni
Kernel Interface table
Iface MTU Met RX-OK RX-ERR RX-DRP RX-OVR TX-OK TX-ERR TX-DRP TX-OVR Flg
eth0 1500 0 1737832834 0 0 0 1600292921 0 0 0 BMRU
eth1 1500 0 1758186694 0 0 0 1695221461 0 0 0 BMRU
eth2 1500 0 520731 0 0 0 81 0 0 0 BMRU
eth2.716 1500 0 520729 0 0 0 81 0 0 0 BMRU
eth2.802 1500 0 0 0 0 0 0 0 0 0 BMRU
eth2.816 1500 0 0 0 0 0 0 0 0 0 BMRU
eth2.817 1500 0 0 0 0 0 0 0 0 0 BMRU
eth2.819 1500 0 0 0 0 0 0 0 0 0 BMRU
gre1 1476 0 576331143 0 0 0 673523116 0 0 0 MOPRU
gre2 1476 0 420183 0 0 0 500820 0 0 0 MOPRU
lo 65536 0 4625268 0 0 0 4625268 0 0 0 LMPRU
[Expert@vrafws01:0]# ifconfig gre1
gre1 Link encap:UNSPEC HWaddr DF-1F-02-F2-16-09-AC-8B-00-00-00-00-00-00-00-00
inet addr:172.21.241.129 P-t-P:172.21.241.130 Mask:255.255.255.252
UP POINTOPOINT RUNNING NOARP MULTICAST MTU:1476 Metric:1
RX packets:576348007 errors:0 dropped:0 overruns:0 frame:0
TX packets:673539505 errors:0 dropped:0 overruns:0 carrier:0
collisions:0 txqueuelen:1000
RX bytes:351032158812 (326.9 GiB) TX bytes:622558876610 (579.8 GiB)
[Expert@vrafws01:0]# ethtool -S gre1
no stats available
- Mark as New
- Bookmark
- Subscribe
- Mute
- Subscribe to RSS Feed
- Permalink
- Report Inappropriate Content
Must be policy drops then, try applying this filter to the traffic logs in the SmartConsole:
interface:gre1 and not action:accept
Otherwise you'll need to run fw ctl zdebug + drop | grep gre1 and wait for some traffic to get dropped to see the reason.
Gaia 4.18 (R82) Immersion Tips, Tricks, & Best Practices Video Course
Now Available at https://shadowpeak.com/gaia4-18-immersion-course
Now Available at https://shadowpeak.com/gaia4-18-immersion-course
- Mark as New
- Bookmark
- Subscribe
- Mute
- Subscribe to RSS Feed
- Permalink
- Report Inappropriate Content
@Exonix use the filter mentioned by @Timothy_Hall in the log view of SmartConsole. On the right you can open and see a statistics tab with details to top source, destination, service etc. With this information you get more details for the dropped traffic.
- Mark as New
- Bookmark
- Subscribe
- Mute
- Subscribe to RSS Feed
- Permalink
- Report Inappropriate Content
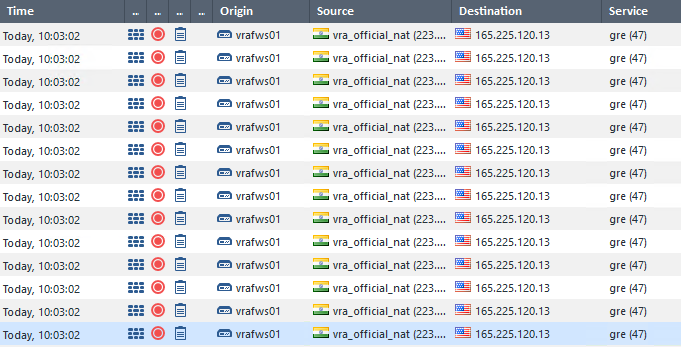
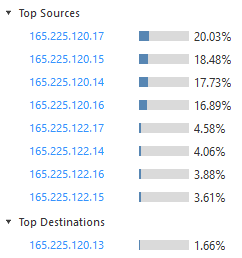
I found a lot of dropped traffic from and to Zscaler Servers. fw ctl zdebug didn't schow anyting.
The top-sources are Zscaler Servers:
- Mark as New
- Bookmark
- Subscribe
- Mute
- Subscribe to RSS Feed
- Permalink
- Report Inappropriate Content
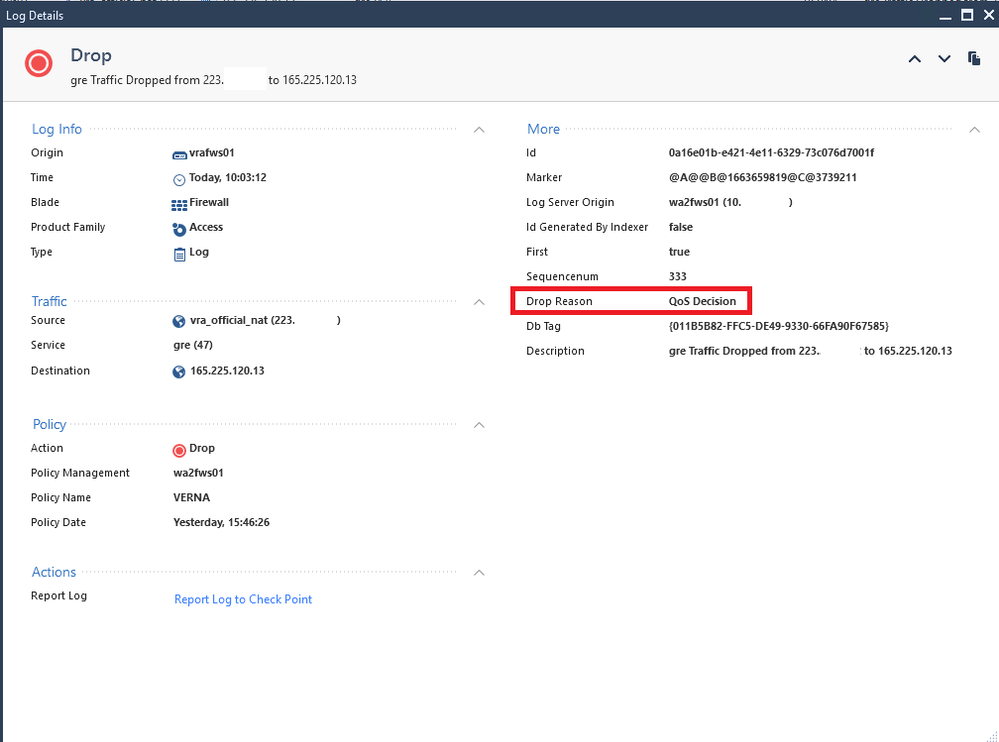
Click on one of the logs, what does it say?
- Mark as New
- Bookmark
- Subscribe
- Mute
- Subscribe to RSS Feed
- Permalink
- Report Inappropriate Content
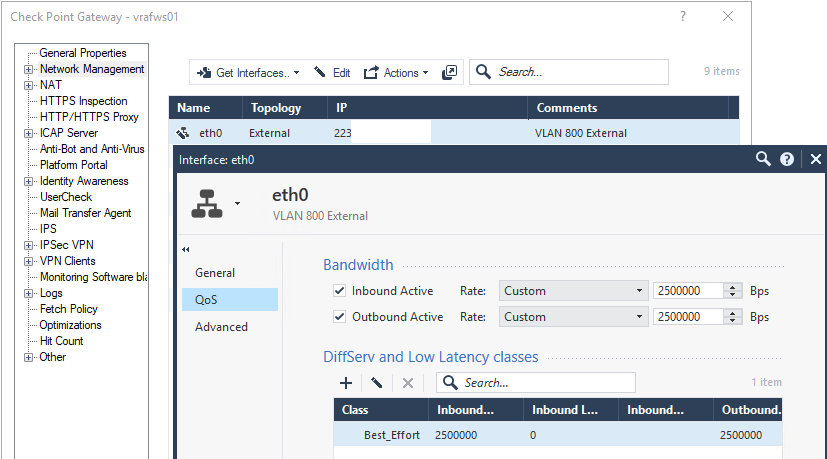
can this setting be a reson for the drop?
- Mark as New
- Bookmark
- Subscribe
- Mute
- Subscribe to RSS Feed
- Permalink
- Report Inappropriate Content
Yes, it could be it. Why did you set this in the first place?
- Mark as New
- Bookmark
- Subscribe
- Mute
- Subscribe to RSS Feed
- Permalink
- Report Inappropriate Content
I didn't set it, it was configured long time ago, before I joined the company.
As soon as we removed this restriction, the number of dropped packets decreased three times. I was told the customer has upgraded its Internet connection to 50 Mbit and the restriction is no longer necessary. I keep watching.
- Mark as New
- Bookmark
- Subscribe
- Mute
- Subscribe to RSS Feed
- Permalink
- Report Inappropriate Content
Good we figured this out
- Mark as New
- Bookmark
- Subscribe
- Mute
- Subscribe to RSS Feed
- Permalink
- Report Inappropriate Content
thank you!
- Mark as New
- Bookmark
- Subscribe
- Mute
- Subscribe to RSS Feed
- Permalink
- Report Inappropriate Content
Drop ratio is four times higher.
CCSP - CCSE / CCTE / CTPS / CCME / CCSM Elite / SMB Specialist
Leaderboard
Epsum factorial non deposit quid pro quo hic escorol.
| User | Count |
|---|---|
| 11 | |
| 8 | |
| 7 | |
| 6 | |
| 5 | |
| 5 | |
| 4 | |
| 4 | |
| 3 | |
| 3 |
Upcoming Events
Thu 08 Jan 2026 @ 05:00 PM (CET)
AI Security Masters Session 1: How AI is Reshaping Our WorldFri 09 Jan 2026 @ 10:00 AM (CET)
CheckMates Live Netherlands - Sessie 42: Looking back & forwardThu 22 Jan 2026 @ 05:00 PM (CET)
AI Security Masters Session 2: Hacking with AI: The Dark Side of InnovationThu 12 Feb 2026 @ 05:00 PM (CET)
AI Security Masters Session 3: Exposing AI Vulnerabilities: CP<R> Latest Security FindingsThu 08 Jan 2026 @ 05:00 PM (CET)
AI Security Masters Session 1: How AI is Reshaping Our WorldFri 09 Jan 2026 @ 10:00 AM (CET)
CheckMates Live Netherlands - Sessie 42: Looking back & forwardThu 22 Jan 2026 @ 05:00 PM (CET)
AI Security Masters Session 2: Hacking with AI: The Dark Side of InnovationThu 26 Feb 2026 @ 05:00 PM (CET)
AI Security Masters Session 4: Powering Prevention: The AI Driving Check Point’s ThreatCloudAbout CheckMates
Learn Check Point
Advanced Learning
YOU DESERVE THE BEST SECURITY
©1994-2026 Check Point Software Technologies Ltd. All rights reserved.
Copyright
Privacy Policy
About Us
UserCenter


