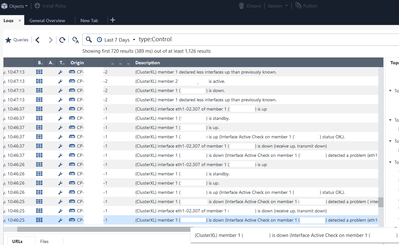
We have two 5800 gateways (naming them CP1 and CP2) in a High Availability cluster. Current version is R80.20. At November 11 at 10:46:25 we experienced an unexpected failover from master CP1 to stand-by cluster member CP2. According to the cluster log the failover reason is cluster interface eth1-02.307 CCP down at 10:46:25 so our CP1 cluster status went DOWN. One second later our cluster interface eth1-02.307 has recovered so CP1 cluster status went from DOWN - - > STANDBY.
This cluster interface flapping on a CP1 gateway occurred several times during the day, but because CP2 was now the master, we have not experienced cluster failovers any more.
CP1 and CP2 are interconnected over two Cisco 5600 Nexus switches (and also for the Sync there is a direct bonded connection between two cluster members). At the first hand, we suspected that something is wrong with our Nexus switches, we have checked everything in regard to switch physical interface status, spanning tree events on our 307 VLAN, but we have not found anything related to the cluster failover. The Nexus switches seem to be OK, nothing has happen in our switching network.
Here is the output from our SmartConsole log section where we filtered type:Control, so you can see cluster failover log:

We also have noticed a lot of uc_log_suppression_set_entry logs in CP1 /var/log/messages at the time of failover, also later during the day:
Nov 11 10:46:25 2020 CP1 kernel: [fw4_2];[10.10.57.80:61085 -> x.x.x.x:443] [ERROR]: uc_log_suppression_set_entry: Failed storing log data in log suppression table!
Nov 11 10:46:25 2020 CP1 kernel: [fw4_4];[10.10.0.254:57642 -> x.x.x.x:443] [ERROR]: uc_log_suppression_set_entry: Failed storing log data in log suppression table!
Nov 11 10:46:25 2020 CP1 kernel: [fw4_1];[10.10.57.80:61087 -> x.x.x.x:443] [ERROR]: uc_log_suppression_set_entry: Failed storing log data in log suppression table!
Nov 11 10:46:25 2020 CP1 kernel: [fw4_1];[10.10.57.80:61086 -> x.x.x.x:443] [ERROR]: uc_log_suppression_set_entry: Failed storing log data in log suppression table!
Nov 11 10:46:25 2020 CP1 kernel: [fw4_2];[10.10.57.80:61088 -> x.x.x.x:443] [ERROR]: uc_log_suppression_set_entry: Failed storing log data in log suppression table!
Nov 11 10:46:25 2020 CP1 kernel: [fw4_1];CLUS-110305-1: State change: ACTIVE -> ACTIVE(!) | Reason: Interface eth1-02.307 is down (Cluster Control Protocol packets are not received)
Nov 11 10:46:25 2020 CP1 kernel: [fw4_1];CLUS-110305-1: State change: ACTIVE! -> DOWN | Reason: Interface eth1-02.307 is down (Cluster Control Protocol packets are not received)
Nov 11 10:46:25 2020 CP1 kernel: [fw4_1];CLUS-214704-1: Remote member 2 (state STANDBY -> ACTIVE) | Reason: No other ACTIVE members have been found in the cluster
Nov 11 10:46:26 2020 CP1 kernel: [fw4_1];CLUS-114802-1: State change: DOWN -> STANDBY | Reason: There is already an ACTIVE member in the cluster (member 2)
Nov 11 10:46:27 2020 CP1 kernel: [fw4_1];CLUS-100102-1: Failover member 1 -> member 2 | Reason: Interface eth1-02.307 is down (Cluster Control Protocol packets are not received)
Nov 11 10:46:27 2020 CP1 monitord[12740]: Time shift detected !!!
Nov 11 10:46:36 2020 CP1 last message repeated 3 times
Nov 11 10:46:37 2020 CP1 kernel: [fw4_1];CLUS-110300-1: State change: STANDBY -> DOWN | Reason: Interface eth1-02.307 is down (Cluster Control Protocol packets are not received)
Nov 11 10:46:37 2020 CP1 kernel: [fw4_1];CLUS-114802-1: State change: DOWN -> STANDBY | Reason: There is already an ACTIVE member in the cluster (member 2)
Later, when CP2 become a master, we have seen similar messages at CP2, also we noticed by checking from cpview history that our CPU has been at significantly higer usage than regular.
Our R80.20 cluster is using unicast CCP messages as you can see here:
[Expert@CP1:0]# cphaprob -a if
CCP mode: Automatic
Required interfaces: 5
Required secured interfaces: 1
eth1-01 UP non sync(non secured), unicast
eth1 UP non sync(non secured), unicast
eth4 Non-Monitored non sync(non secured)
Mgmt Non-Monitored non sync(non secured)
bond1 UP sync(secured), unicast, bond Load Sharing
eth1-02 UP non sync(non secured), unicast (eth1-02.7)
eth1-02 UP non sync(non secured), unicast (eth1-02.307)
What could be a reason for this unexpected failover, seems that our network is fine and we suspect that route cause for this failover is somewhere on our gateways. Maybe one important fact, we also had a policy install at the same time cluster failover has happened.


