I'm having issues with a 4200 appliance and it's performance. While these issues have been going for a while, they are becoming quite disruptive lately.
The setup is a 4200 appliance running R80.10 (but also R77.30 had these issues), with only the Firewall, VPN, Identity Awareness, Application & URL filtering blades enabled. The problem is, I have no clue as to what's causing this and my troubleshooting skills are not up to par. I hope you can give me a clue.
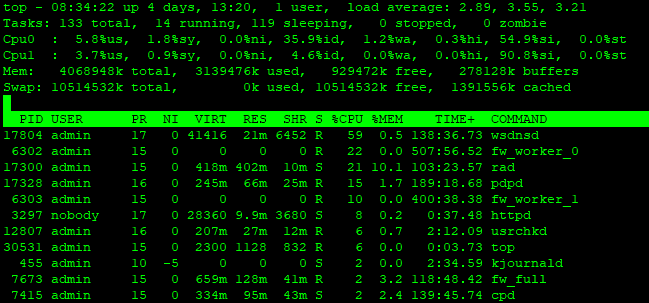
More often than not, I see the gateway's CPU peak to 99%. Sometimes, when I check the top connections with cpview, I see a client downloading a file over https (inspection not enabled) with 60Mbit/s over our WAN connection. While this, in my opinion, shouldn't cause a gateway to max out, I can understand. But other times, I see no visible clue as to why this is. I will hardly see any traffic in cpview, but 'top' gives me an output like the one below.
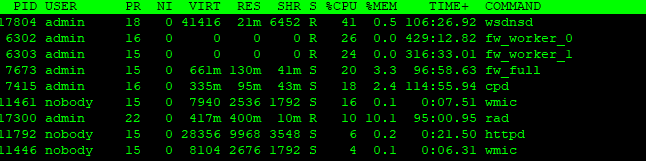
This is not always the same. Sometimes you see a fw_worker, cpd or pdpd as the #1 CPU user.
fwaccel stat
Accelerator Status : on
Accept Templates : disabled by Firewall
Layer Network disables template offloads from rule #174
Throughput acceleration still enabled.
Drop Templates : enabled
NAT Templates : disabled by Firewall
Layer Network disables template offloads from rule #174
Throughput acceleration still enabled.
NMR Templates : enabled
NMT Templates : enabled
Accelerator Features : Accounting, NAT, Cryptography, Routing,
HasClock, Templates, Synchronous, IdleDetection,
Sequencing, TcpStateDetect, AutoExpire,
DelayedNotif, TcpStateDetectV2, CPLS, McastRouting,
WireMode, DropTemplates, NatTemplates,
Streaming, MultiFW, AntiSpoofing, Nac,
ViolationStats, AsychronicNotif, ERDOS,
McastRoutingV2, NMR, NMT, NAT64, GTPAcceleration,
SCTPAcceleration
Cryptography Features : Tunnel, UDPEncapsulation, MD5, SHA1, NULL,
3DES, DES, CAST, CAST-40, AES-128, AES-256,
ESP, LinkSelection, DynamicVPN, NatTraversal,
EncRouting, AES-XCBC, SHA256
fwaccel stats -s
Accelerated conns/Total conns : 243/2697 (9%)
Delayed conns/(Accelerated conns + PXL conns) : 70/1516 (4%)
Accelerated pkts/Total pkts : 170686/2775658 (6%)
F2Fed pkts/Total pkts : 196461/2775658 (7%)
PXL pkts/Total pkts : 2408511/2775658 (86%)
QXL pkts/Total pkts : 0/2775658 (0%)
fwaccel stats -p
F2F packets:
--------------
Violation Packets Violation Packets
-------------------- --------------- -------------------- ---------------
pkt is a fragment 470 pkt has IP options 0
ICMP miss conn 1292 TCP-SYN miss conn 20969
TCP-other miss conn 3018 UDP miss conn 19495
other miss conn 0 VPN returned F2F 0
ICMP conn is F2Fed 9904 TCP conn is F2Fed 121746
UDP conn is F2Fed 18277 other conn is F2Fed 0
uni-directional viol 0 possible spoof viol 0
TCP state viol 2785 out if not def/accl 882
bridge, src=dst 0 routing decision err 1550
sanity checks failed 0 temp conn expired 0
fwd to non-pivot 0 broadcast/multicast 0
cluster message 0 partial conn 1576
PXL returned F2F 11879 cluster forward 0
chain forwarding 0 Tmpl no-match range 5
Tmpl no-match time 0 general reason 6
route change 0 inbound zone change 0
outbound zone change 0
I have cleaned up my rulebase as much as I possibly can right now. Because of the recent upgrade from R77.30 to R80.10 I haven't been able to convert my rulebase to a layered one yet.
How can I find out what's causing these issues?


 You also mentioned that you might be running R80.10 on those. I know 4000 series are supported, but bear in mind that R80.10 is much more CPU and memory hungry compare to R77.30.
 The monitoring hardly ever picked up on these spikes. I'll look into the OID's