Create a Post
cancel
Showing results for 
Search instead for 
Did you mean: 
Martin_Oles
Contributor
Jump to solution

Traffic does not go through - how to catch culprit?

HI,

I just run out of options and even opened support case, but so far no luck. To make story short, a customer started to complain, that every Sunday and Monday around 0:10AM is observing on monitoring traffic drop. Initially hard to believe for weekend we have switched off fwaccel and setup tcpdump on internal and external interfaces on one of virtual system. And really, we are able to identify, that on outside interface in given time we are observing packets, which are not visible on internal. We are observing clearly retransmissions, so packet arrives to external, but it is not forwarded. Such behavior is for 10 or even 30 seconds, many timed during two hours time window. Then everything works as designed. This is randomly visible in dumps many times from midnight to 2AM and then ... everything works. During that time, no backup is running, no policy update, routing is static and rather simple (default + directly connected), no drops in traffic logs, CPU 15% max. Traffic is permitted in rulebase, other time it works flawlessly .My best guess is, that even Check point support is puzzled by this, I have spoken with them, provided dumps and maybe all available logs.

So, as weekend is approaching ... any tips what I might setup to see reason for such really strange behavior? Anything, which I can setup and analyze after?

Thank you for your opinions.


0 Kudos
1 Solution

Accepted Solutions
Martin_Oles
Contributor

Root cause has been found.

Maybe in the future somebody would encounter similar problem, so I will try to make the story longer.

Customer was complaining, that sometimes only during weekends is loosing connections towards servers. We are still running VSX R77.30 with latest hotfix, no IPS blade running. Later on customer provided times, when connection has been lost (exact date omitted):

Monday 00:07 - 01:42
Sunday 00:16 - 00:25
Monday 00:05 - 01:33
Saturday 15:25 - 15:56
Sunday 00:20 - 01:33
Monday 00:10 - 01:48
Sunday 00:19 - 00:31
Monday 00:05 - 02:11

having such info with staggering recurrence , we did check first traffic logs. They appeared "business as usual", no unexpected drops, nothing else suspicious. Due to amount of affected servers, we picked up combination source and destination, and for few weekends we setup tcpdumps:

vsenv 10
fwaccel off
nohup tcpdump -s 96 -w /var/log/TCPDUMPoutside -C 200 -W 100 -Z root -i bond0.123 host 20.30.40.50 and host 10.20.30.40 
nohup tcpdump -s 96 -w /var/log/TCPDUMPinside -C 200 -W 100 -Z root -i bond1.456 host host 20.30.40.50 and host 10.20.30.40 
nohup tcpdump -s 96 -w /var/log/TCPDUMParp -C 200 -W 100 -Z root -i bond1.456 arp

So, from weekends we did have dumps. There was clearly visible, some connections were not able get through, re-transmissions, pings with missing reply and so on. Surprisingly it took many seconds, 30 or more. Then for minute was traffic visible, again drops, again visible.

We reviewed traffic logs, nothing. We did try to review cpview history. As it is VSX, history is available for main gateway, not for particular virtual system (or I am wrong?), the only suspicious was sudden increase of interrupts, those were evenly distributed among all cores, so we assumed that no elephant session occurred. CPU history did show also minor increase, but in nothing to worry about. Even support case has been opened, believed, that we missed something. Sure, we missed!

We run on that weekend also: "nohup fw ctl zdebug -vs 10 drop | grep --line-buffered '20.30.40.50|10.20.30.40' | tee /var/log/fw_ctl_zdebug_drop_LOG.txt" which came empty. So far I had no time to review why, also we did not clearly figure out, why debug was switch itself off after few hours of running, even if there was no rulebase update, no IPS update and so on.

So I took strong coffee around midnight and run manually "fw ctl zdebug -vs 10 drop", just only watching, how text goes. It is an internal firewall, occasionally rulebase drop, otherwise very quiet. Then around time reported a real havoc started, stream of:

;[vs_10];[tid_0];[fw4_0];fw_log_drop_ex: Packet proto=6 10.1.2.3:37995 -> 10.20.30.50:1720 dropped by fwconn_memory_check Reason: full connections table;

So, customer was right, we were dropping traffic without any log.

From output was found, that source server is a testing server with product called Nessus, scanning every single tcp/udp port on every server behind that firewall. Further more, customer specifically demanded (like a year ago) to have opening "src server, any, any", therefore all traffic from that server was permitted in rulebase and written to connection table. It have opened 3000 new connections per second, exhausting connection table in less a minute. Some already established connections survived it, many newly created connections were dropped, neither permission no drop in traffic logs.

What we missed in this case is one important hint (using cpview where such is not visible):

[Expert@FW:10]# fw tab -t connections -s
HOST NAME ID              #VALS #PEAK #SLINKS
localhost connections 8158 5130 24901 15333

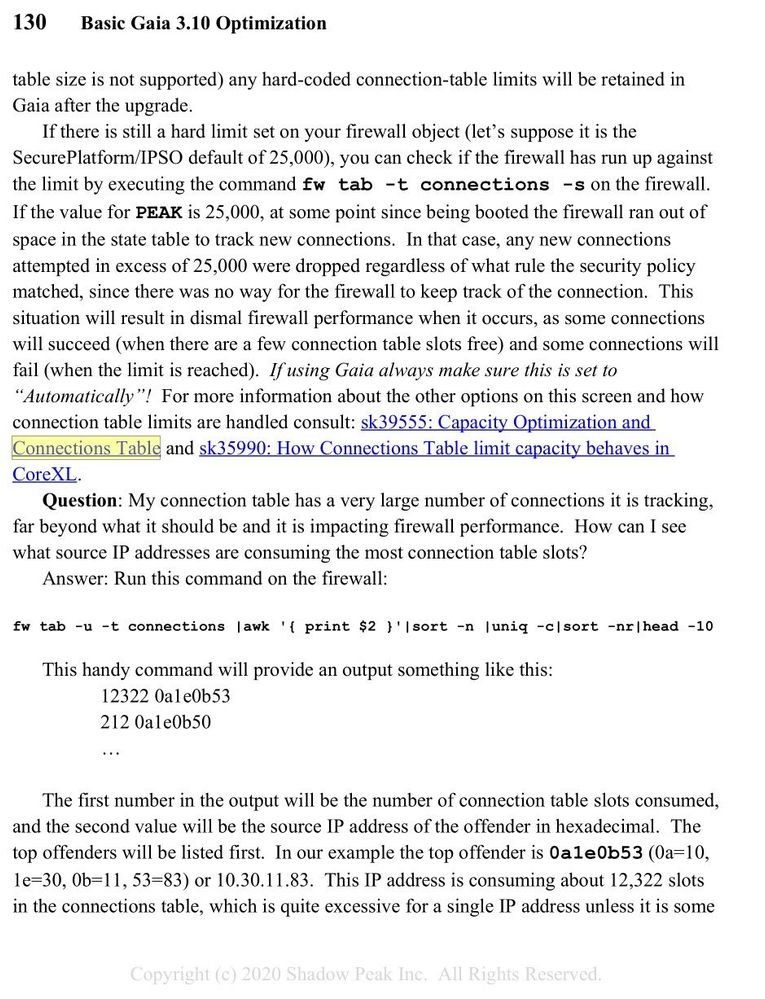
We know, that customer has virtual system with maximum of 25 000 connections, such hint should not be missed. Also from past experience I had "knowledge", that full connection table is visible in traffic logs, but in that past case it was IPS blade complaining about connection table capacity, this customer has no IPS blade activated.

Case is solved, root cause has been found. I hope, that it might help somebody else in the future.

View solution in original post

6 Replies
David_C1
Advisor

You can try fw monitor, or running debugs looking for drops. I don't have exact commands at my fingertips, but those two options should show you more information than tcpdump.


Dave

0 Kudos
Maarten_Sjouw
Champion
Champion
Look at the update time for IPS (gateway) and Application control and see if they run at the same time, we had a problem with this a couple of years back. Both updates were running at the same time, start time was equal.
Regards, Maarten
0 Kudos
Timothy_Hall
Champion
Champion

Please see the "roach motel" troubleshooting steps in my 2018 CPX presentation here:

https://community.checkpoint.com/fyrhh23835/attachments/fyrhh23835/member-exclusives/123/1/CheckMate...

Just because traffic shows up in tcpdump doesn't mean it necessarily reaches the entrance to the INSPECT driver at point i.  You need to verify that with fw monitor.  Then fw ctl zdebug drop of course to see any drops by the Check Point code for any reason.  Bottom line is you need to figure out where the packets are getting "eaten"; could be Gaia, could be some kind of ARP problem. 

Also the historical mode of cpview accessible with -t during the problematic period may help you identify any excessive activity or resource shortages on the gateway.

Gateway Performance Optimization R81.20 Course
now available at maxpowerfirewalls.com
0 Kudos
Martin_Oles
Contributor

Root cause has been found.

Maybe in the future somebody would encounter similar problem, so I will try to make the story longer.

Customer was complaining, that sometimes only during weekends is loosing connections towards servers. We are still running VSX R77.30 with latest hotfix, no IPS blade running. Later on customer provided times, when connection has been lost (exact date omitted):

Monday 00:07 - 01:42
Sunday 00:16 - 00:25
Monday 00:05 - 01:33
Saturday 15:25 - 15:56
Sunday 00:20 - 01:33
Monday 00:10 - 01:48
Sunday 00:19 - 00:31
Monday 00:05 - 02:11

having such info with staggering recurrence , we did check first traffic logs. They appeared "business as usual", no unexpected drops, nothing else suspicious. Due to amount of affected servers, we picked up combination source and destination, and for few weekends we setup tcpdumps:

vsenv 10
fwaccel off
nohup tcpdump -s 96 -w /var/log/TCPDUMPoutside -C 200 -W 100 -Z root -i bond0.123 host 20.30.40.50 and host 10.20.30.40 
nohup tcpdump -s 96 -w /var/log/TCPDUMPinside -C 200 -W 100 -Z root -i bond1.456 host host 20.30.40.50 and host 10.20.30.40 
nohup tcpdump -s 96 -w /var/log/TCPDUMParp -C 200 -W 100 -Z root -i bond1.456 arp

So, from weekends we did have dumps. There was clearly visible, some connections were not able get through, re-transmissions, pings with missing reply and so on. Surprisingly it took many seconds, 30 or more. Then for minute was traffic visible, again drops, again visible.

We reviewed traffic logs, nothing. We did try to review cpview history. As it is VSX, history is available for main gateway, not for particular virtual system (or I am wrong?), the only suspicious was sudden increase of interrupts, those were evenly distributed among all cores, so we assumed that no elephant session occurred. CPU history did show also minor increase, but in nothing to worry about. Even support case has been opened, believed, that we missed something. Sure, we missed!

We run on that weekend also: "nohup fw ctl zdebug -vs 10 drop | grep --line-buffered '20.30.40.50|10.20.30.40' | tee /var/log/fw_ctl_zdebug_drop_LOG.txt" which came empty. So far I had no time to review why, also we did not clearly figure out, why debug was switch itself off after few hours of running, even if there was no rulebase update, no IPS update and so on.

So I took strong coffee around midnight and run manually "fw ctl zdebug -vs 10 drop", just only watching, how text goes. It is an internal firewall, occasionally rulebase drop, otherwise very quiet. Then around time reported a real havoc started, stream of:

;[vs_10];[tid_0];[fw4_0];fw_log_drop_ex: Packet proto=6 10.1.2.3:37995 -> 10.20.30.50:1720 dropped by fwconn_memory_check Reason: full connections table;

So, customer was right, we were dropping traffic without any log.

From output was found, that source server is a testing server with product called Nessus, scanning every single tcp/udp port on every server behind that firewall. Further more, customer specifically demanded (like a year ago) to have opening "src server, any, any", therefore all traffic from that server was permitted in rulebase and written to connection table. It have opened 3000 new connections per second, exhausting connection table in less a minute. Some already established connections survived it, many newly created connections were dropped, neither permission no drop in traffic logs.

What we missed in this case is one important hint (using cpview where such is not visible):

[Expert@FW:10]# fw tab -t connections -s
HOST NAME ID              #VALS #PEAK #SLINKS
localhost connections 8158 5130 24901 15333

We know, that customer has virtual system with maximum of 25 000 connections, such hint should not be missed. Also from past experience I had "knowledge", that full connection table is visible in traffic logs, but in that past case it was IPS blade complaining about connection table capacity, this customer has no IPS blade activated.

Case is solved, root cause has been found. I hope, that it might help somebody else in the future.
Timothy_Hall
Champion
Champion

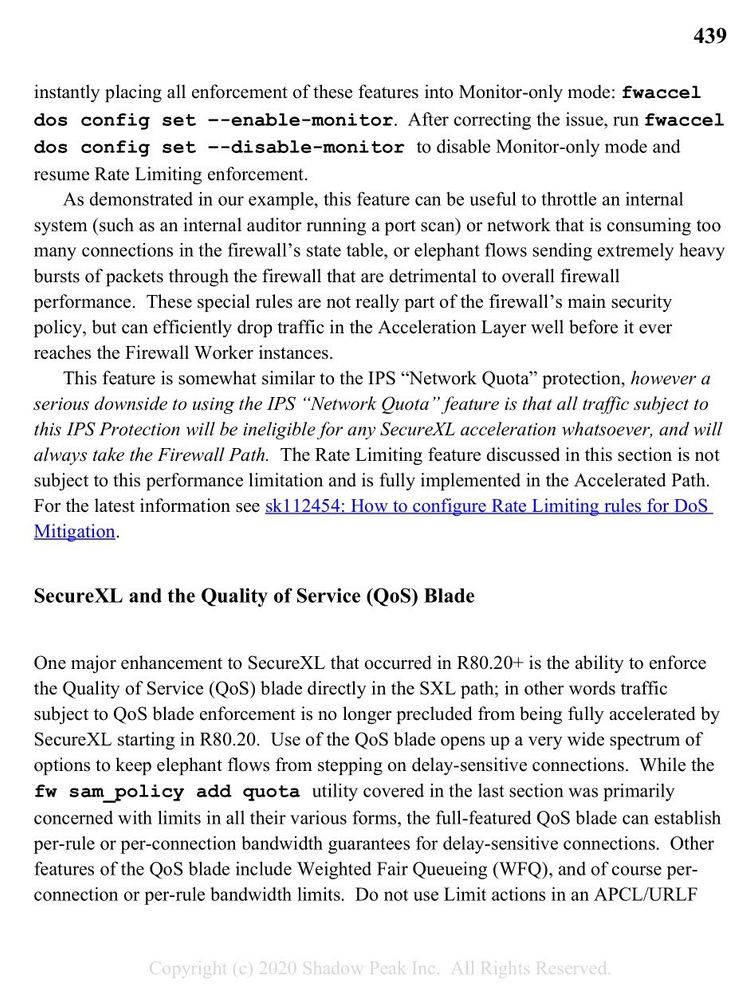
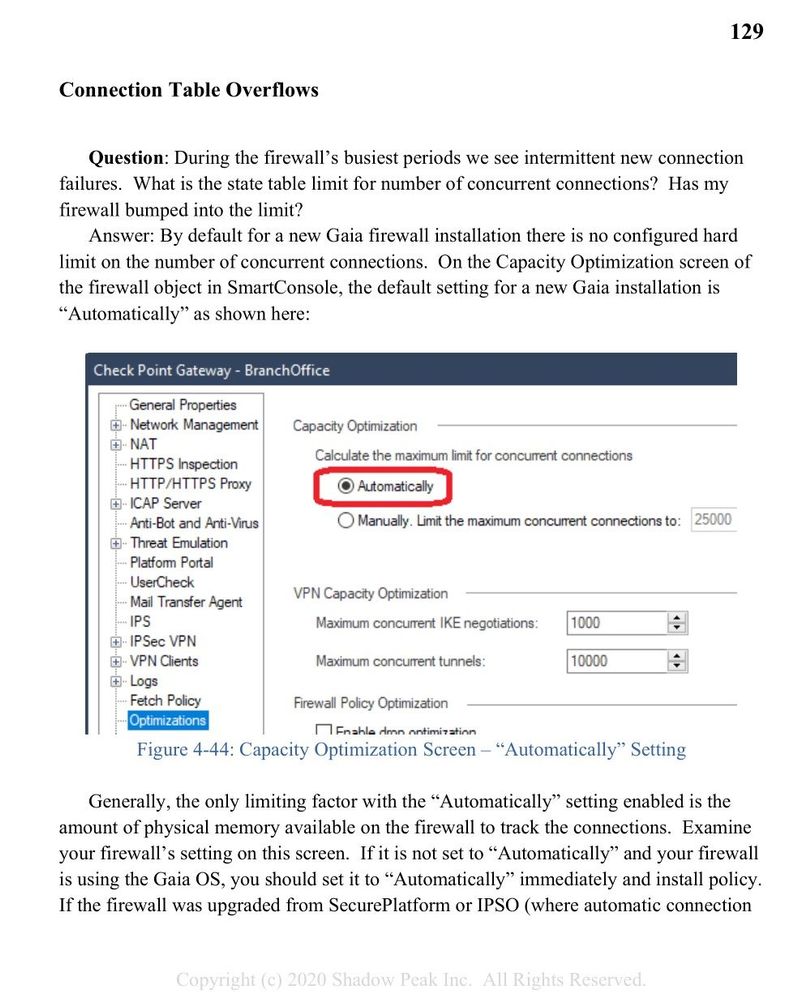
Thanks for the followup, the scenario of an auditor/scanner opening an excessive number of connections was covered in all editions of my book as it is a classic problem, that has mostly gone away due to the default "Automatically" dynamic allocation setting for connection table size.  Unfortunately VSX does not support this setting and can still bump against the static limit.

Gateway Performance Optimization R81.20 Course
now available at maxpowerfirewalls.com
0 Kudos
Timothy_Hall
Champion
Champion

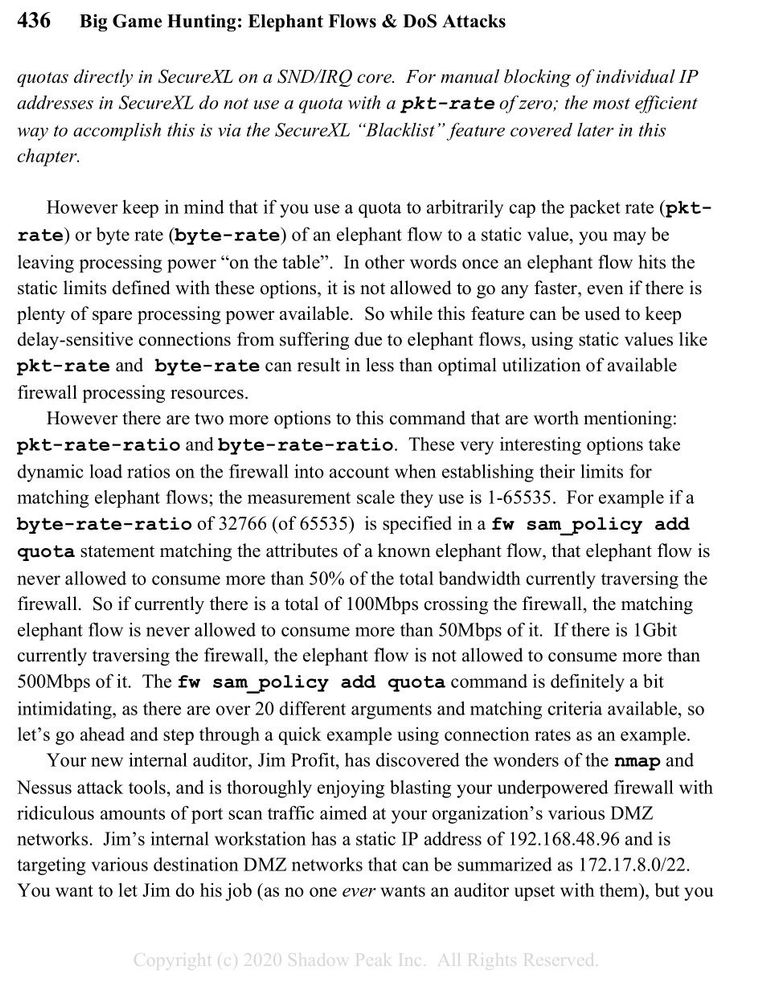
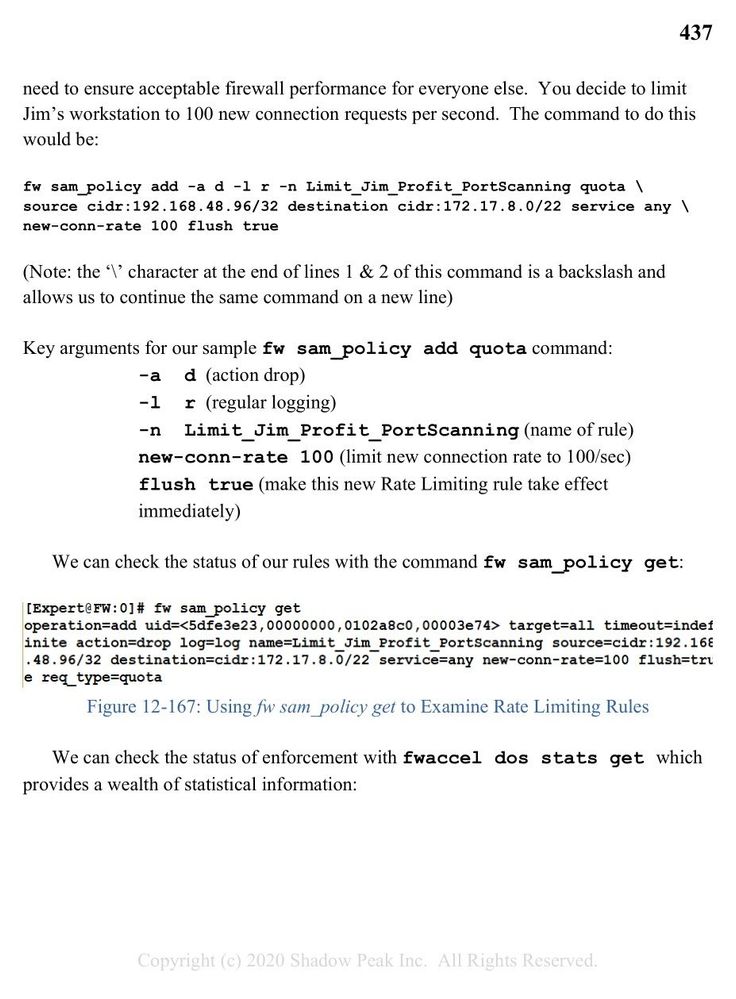
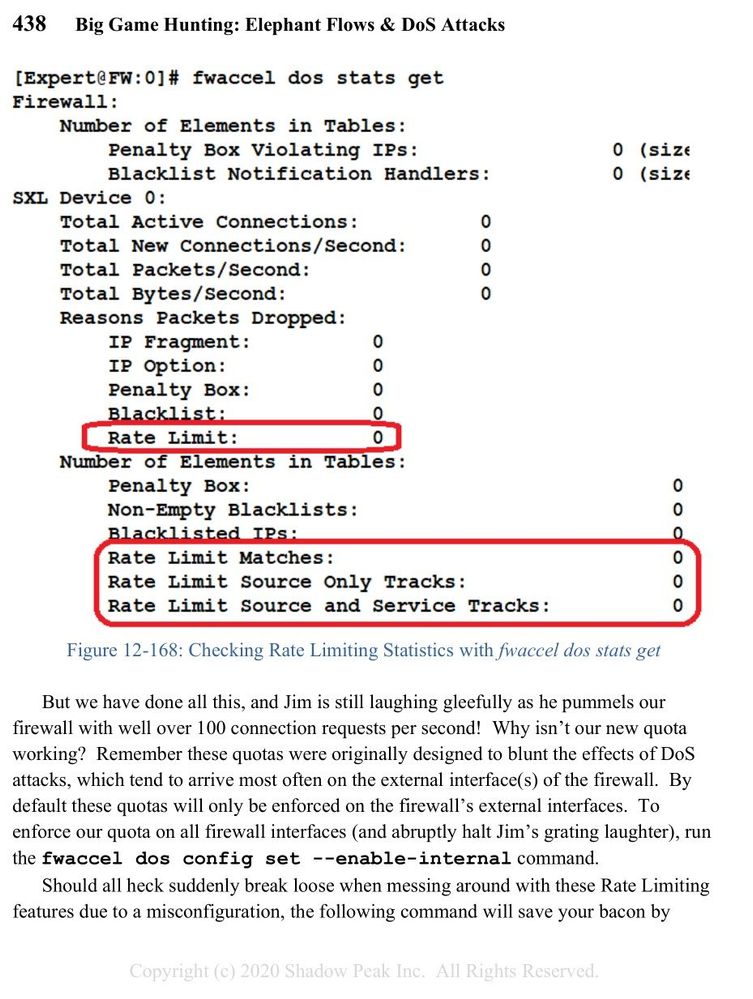
Thanks for the followup.  While it didn't explicitly mention that VS's cannot be set to size the connections table automatically, this topic was mentioned in my book.  Best way to throttle/limit auditor traffic is via the new fwaccel dos rate command (formerly fw sam_policy/fw samp) to keep it from running the firewall out of connection table slots.  DO NOT use the IPS protection Network Quota:

conns1.jpgconns2.jpgconns3.jpgconns4.jpgconns5.jpgconns6.jpg


Gateway Performance Optimization R81.20 Course
now available at maxpowerfirewalls.com
0 Kudos

Leaderboard

Epsum factorial non deposit quid pro quo hic escorol.

Upcoming Events

    CheckMates Events