- Products
- Learn
- Local User Groups
- Partners
- More

This website uses Cookies. Click Accept to agree to our website's cookie use as described in our Privacy Policy. Click Preferences to customize your cookie settings.
- Products
- Learn
- Local User Groups
- Upcoming Events
- Americas
- EMEA
- Czech Republic and Slovakia
- Denmark
- Netherlands
- Germany
- Sweden
- United Kingdom and Ireland
- France
- Spain
- Norway
- Ukraine
- Baltics and Finland
- Greece
- Portugal
- Austria
- Kazakhstan and CIS
- Switzerland
- Romania
- Turkey
- Belarus
- Belgium & Luxembourg
- Russia
- Poland
- Georgia
- DACH - Germany, Austria and Switzerland
- Iberia
- Africa
- Adriatics Region
- Eastern Africa
- Israel
- Nordics
- Middle East and Africa
- Balkans
- Italy
- Bulgaria
- Cyprus
- APAC
- Partners
- More
- ABOUT CHECKMATES & FAQ
- Sign In
- Leaderboard
- Events
AI Security Masters E7:
How CPR Broke ChatGPT's Isolation and What It Means for You
Blueprint Architecture for Securing
The AI Factory & AI Data Center
Call For Papers
Your Expertise. Our Stage
Good, Better, Best:
Prioritizing Defenses Against Credential Abuse
Ink Dragon: A Major Nation-State Campaign
Watch HereCheckMates Go:
CheckMates Fest
Turn on suggestions
Auto-suggest helps you quickly narrow down your search results by suggesting possible matches as you type.
Showing results for
- CheckMates
- :
- Products
- :
- Hybrid Mesh
- :
- Firewall and Security Management
- :
- Re: Terrible performance IPHTTPS - Checkpoint SG 1...
Options
- Subscribe to RSS Feed
- Mark Topic as New
- Mark Topic as Read
- Float this Topic for Current User
- Bookmark
- Subscribe
- Mute
- Printer Friendly Page
Turn on suggestions
Auto-suggest helps you quickly narrow down your search results by suggesting possible matches as you type.
Showing results for
Are you a member of CheckMates?
×
Sign in with your Check Point UserCenter/PartnerMap account to access more great content and get a chance to win some Apple AirPods! If you don't have an account, create one now for free!
- Mark as New
- Bookmark
- Subscribe
- Mute
- Subscribe to RSS Feed
- Permalink
- Report Inappropriate Content
Terrible performance IPHTTPS - Checkpoint SG 15600
Long time lurker, first time poster.
I work at an organization which have deployed DirectAccess as it's remote access solution time and time again we've had people complain about the terrible performance. I'm head of our our digital infrastructure unit.
I get that some performance impact is expected when deploying other vendors VPN solutions is expected, but as it stands now we're looking to replace our 15600 clusters with off-the-rack consumer products.
Our ISP delivers dual 10Gbit connections to our 10Gbit firewalls, the deployment is the same in our two datacenters.
The 4 DirectAccess servers with 10Gbit interfaces going through this solution have reported an aggregated peak throughput since the start of the pandemic at 461 Mbit with 1300 users connected.
On average we're seeing somewhere around 400Mbit aggregated throughput for about 1200 users.
After a year of troubleshooting we finally decided to completely remove the 15600 and see if the DirectAccess(IPSec tunnels) was the root cause, but immidiately bottlenecked the 10Gbit interface on the servers with users getting up to 890Mbit throughput.
During normal operations a single user can sometime peak it's connection through our 15600 at 40-60 Mbit, but on average looks at about 0,3-0,5Mbit throughput.
Is this expected behavior from this Security Appliance? Using the 15600 we're getting a 99.97-99.98% performance drop in our network. I say to my network team that this can't be working as expected, but they claim both our support organization and CheckPoint TAC says there is nothing wrong with our setup. I haven't personally spoken to a CheckPoint rep since our support agreement only gives me access to the "experts" at our support organization.
If this really is how terrible the performance is in this regard I honestly can't understand why anyone would consider using CheckPoint as a vendor getting 3 cents on the dollar in a best case scenario.
Do I just turn the page and go with another vendor for our next investment or is there an actual motivation to why our setup is struggling this bad?
49 Replies
- Mark as New
- Bookmark
- Subscribe
- Mute
- Subscribe to RSS Feed
- Permalink
- Report Inappropriate Content
Whether this is expected behavior or not entirely depends on a lot of things you haven’t told us yet.
We should start with version/JHF level of the gateways and management.
A simplified network diagram would be useful.
Output of the Super Seven commands probably wouldn’t hurt either: https://community.checkpoint.com/t5/Scripts/S7PAC-Super-Seven-Performance-Assessment-Commands/td-p/4...
If you’ve taken any precise steps to optimize the security gateway performance, that’d be helpful as well.
Also, is the VPN in question IPSec, HTTPS, or something else?
And if HTTPS, is HTTPS Inspection enabled?
- Mark as New
- Bookmark
- Subscribe
- Mute
- Subscribe to RSS Feed
- Permalink
- Report Inappropriate Content
Thank you for your reply!
We have a DirectAccess solution which uses HTTPS and tunnels IPSec over that connection. From what I gather we have HTTPS inspection off as we have no definied certificates that neither our client nor our servers trusts. Is there a way to validate that it's completely off? (I'm sorry if it's a novice question, but even when we seem to disable blades they still act on traffic in our deployment. We currently have only Firewall checked in the blade portion in SmartConsole.
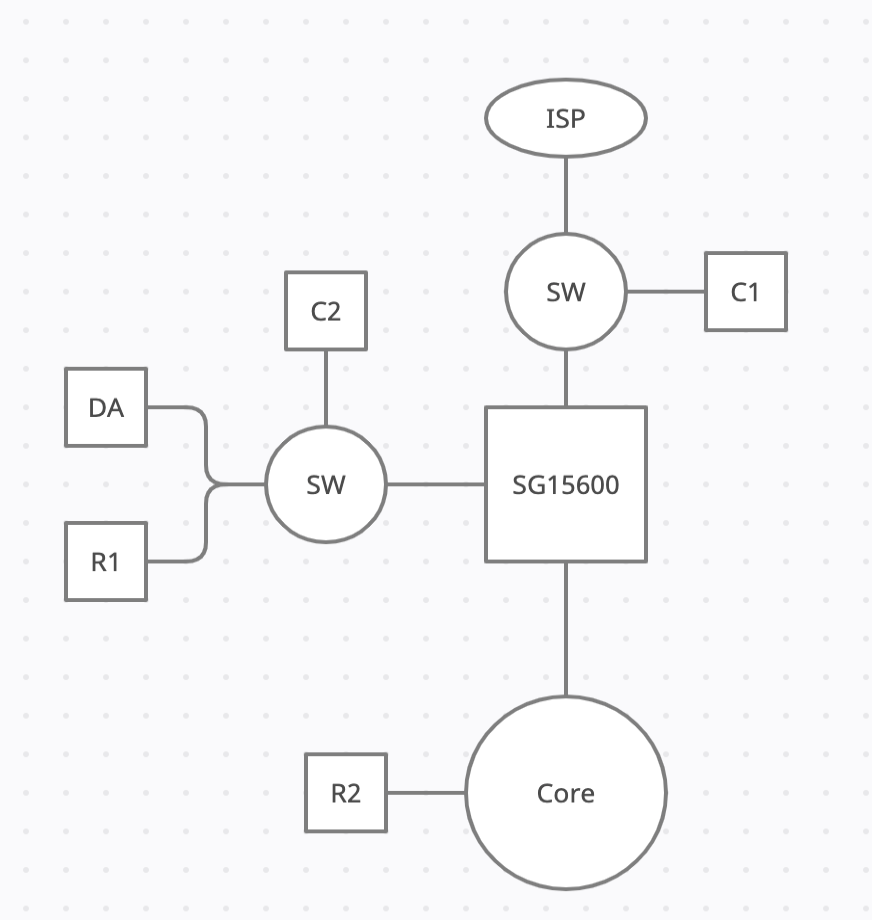
As for the simplified diagram, we do have a more advanced deployment than described, but the performance impact is just going through the 15600 at all. Connecting to the switch behind the firewall and getting another resource through the IPSec tunnel on the DMZ throttles the connection at the clients capacity, but just adding the firewall layer eats more than 95% of the bandwidth.
Using a laptop with 1Gbit interface to connect to the different switches and running getting a file from a resource on the DMZ through the tunnel
Test1:1Gbit-Client -> SW1-> FW -> SW2 -> DA-Server -> Resource: 40-60Mbit
Test2: 1Gbit-Client -> SW2 -> DA-Server -> Resource: 870-950Mbit
- Mark as New
- Bookmark
- Subscribe
- Mute
- Subscribe to RSS Feed
- Permalink
- Report Inappropriate Content
Watched the session with Tim Hall and ran all commands. Very low load at the moment in our entire enviroment, still getting about 50Mbit from home using 1Gbit LAN connection.
The stats looks fine based on his session, the rules that applies on these connections are 121-129 in our policy. The most loaded CPU "peaks" at 2% during the entire time my file transfer is working.
My guess is that we have some kind of QoS or another setting somewhere which throttles the connections, because the firewall doesn't seem to be loaded at all and we still get next to no performance on these connections.
> fwaccel stat
+-----------------------------------------------------------------------------+
|Id|Name |Status |Interfaces |Features |
+-----------------------------------------------------------------------------+
|0 |SND |enabled |Sync,eth3-01,eth3-02, |
| | | |eth1-01,eth1-02,eth1-03, |
| | | |eth1-04 |Acceleration,Cryptography |
| | | | |Crypto: Tunnel,UDPEncap,MD5, |
| | | | |SHA1,NULL,3DES,DES,CAST, |
| | | | |CAST-40,AES-128,AES-256,ESP, |
| | | | |LinkSelection,DynamicVPN, |
| | | | |NatTraversal,AES-XCBC,SHA256 |
+-----------------------------------------------------------------------------+
Accept Templates : disabled by Firewall
Layer EDGE-SEC-POLICY Security disables template offloads from rule #152
Throughput acceleration still enabled.
Drop Templates : disabled
NAT Templates : disabled by Firewall
Layer EDGE-SEC-POLICY Security disables template offloads from rule #152
Throughput acceleration still enabled.
> fwaccel stats -s
Accelerated conns/Total conns : 1850/1886 (98%)
Accelerated pkts/Total pkts : 44743829967/89128322066 (50%)
F2Fed pkts/Total pkts : 5073999609/89128322066 (5%)
F2V pkts/Total pkts : 108335194/89128322066 (0%)
CPASXL pkts/Total pkts : 0/89128322066 (0%)
PSLXL pkts/Total pkts : 39310492490/89128322066 (44%)
QOS inbound pkts/Total pkts : 0/89128322066 (0%)
QOS outbound pkts/Total pkts : 0/89128322066 (0%)
Corrected pkts/Total pkts : 0/89128322066 (0%)
- Mark as New
- Bookmark
- Subscribe
- Mute
- Subscribe to RSS Feed
- Permalink
- Report Inappropriate Content
Interestingly, most of your connections are accelerated but only half the packets are.
And you have stuff hitting PXL, which I wouldn’t expect for a gateway with firewall only enabled.
What does enabled_blades on the gateway say?
- Mark as New
- Bookmark
- Subscribe
- Mute
- Subscribe to RSS Feed
- Permalink
- Report Inappropriate Content
Also there are several other commands in the Super Seven, it would be useful to see all those as well just to make sure we’re not missing something obvious.
- Mark as New
- Bookmark
- Subscribe
- Mute
- Subscribe to RSS Feed
- Permalink
- Report Inappropriate Content
- Mark as New
- Bookmark
- Subscribe
- Mute
- Subscribe to RSS Feed
- Permalink
- Report Inappropriate Content
If only the firewall blade is active, it’s curious that a bunch of traffic is hitting PXL.
We’d have to see the rulebase to understand what’s actually causing that.
Has to be some service like NFS, DCE-RPC, CIFS, or similar in use in the rules up and including to the one that allows the traffic in question.
That might explain the evidence of an elephant flow hitting core 3 (which is being used for a PXL task).
- Mark as New
- Bookmark
- Subscribe
- Mute
- Subscribe to RSS Feed
- Permalink
- Report Inappropriate Content
Thank you very much for all your help!
How do you mean service in use? You mean like the order of the rules and this comes late enough to be affected by rules above it? The network team in our organization claims it has little to no impact in which order rules are processed.
I highly doubt their assessment of the issue as the CPU usage 1/32 cores full throttle and rest idle corresponds too well with the performance we're getting from our ISP (300Mbit/10Gbit) in each datacenter. I'm not a network engineer at my core, but worked my way through enough troubleshooting not to react to correlations like that.
- Mark as New
- Bookmark
- Subscribe
- Mute
- Subscribe to RSS Feed
- Permalink
- Report Inappropriate Content
You are correct rulebase order matters much less in R8x versions than it did previously, but it still matters in a handful of cases, such as when particular services are used.
Also, Tim's comment about what the actual traffic is can make a huge difference in how its processed as well (whether it's actually a TCP connection or IPSec).
Just to provide some context, our datasheet for the 15600 shows firewall performance at 40+ GB.
However, that's under ideal conditions (multiple 1500 byte UDP flows involving different sources and destinations).
A single flow will get nowhere near that because, for a given flow, not every processor core can be used to process that traffic.
If all the traffic is hitting a particularly busy core, it's going to seem...slow.
Even if the rest of the platform seems otherwise unused.
One of the reasons we added Dynamic Balancing and improved multiqueue was to improve the "out of the box" experience in terms of performance.
You can tune things to an extent in earlier releases, but you're probably just better off upgrading to R81 (IMO) where this stuff is enabled by default.
I can't say it will completely solve your problems, but from what you've shown so far, it definitely won't hurt.
- Mark as New
- Bookmark
- Subscribe
- Mute
- Subscribe to RSS Feed
- Permalink
- Report Inappropriate Content
@stefan_am did you mean Microsoft Direct Access ( now Always On VPN ) ?
Maybe after connect of the remote clients to your direct access servers ( are they located in a DMZ?), the unencrypted connections are going through the same 15600 appliance? Do you see any high CPU usage if direct access clients are connected?
As @PhoneBoy wrote some more informations like a network diagram would be helpful.
Wolfgang
- Mark as New
- Bookmark
- Subscribe
- Mute
- Subscribe to RSS Feed
- Permalink
- Report Inappropriate Content
Thank you for your reply!
Yes DirectAccess, but no AO-VPN (They're similar in context but in practice AO-VPN requires user interaction in a way we don't want). We're using SG 15600 with R80.30, still looking into JHF to get the exact version.
We do go back through the firewall with our unnecrypted connections and we do see a performance impact similar to the one mention above if we are trying to reach resources on the inside when connected like our second test case. My approach to the problem right now is having our team solve each step in turn since we're isolated the problem as I mention above.
Looking at the super seven video as I type this, will get back on that also.
In the diagram I've put C1 and C2 as our different connection points for our test client which is hard wired into switches in our datacenter. I've also put R1 and R2 as resources we use for our benchmarks (File transfers). The daily activity for our users is more similar to C1->R2 as we put up R1 just for this troubleshooting and don't normally place internal resources on our edge network.
Except for our clients all interfaces are dual 10Gbit interfaces.
C1 -> R1: 40-60Mbit
C1 -> R2: 20-40Mbit
C2 -> R1: 870-950Mbit
C2 -> R2: 80-120Mbit
R1 -> R2: 3-3,5Gbit
I've told my current team to ignore the R2-flows until the first are solved and mainly use them as indicators that there is "something" wrong. We get a huge performance impact as soon as our client traffic passes through the SG regardless of origin(encrypted or unencrypted) but we get quite decent throughput just transfering files between the servers.
The firewalls have no indicators that they are heavily loaded in any way(CPU, network etc).
One idea I had this morning is that we use the builtin https object in SmartConsole and thought there might be some hidden intelligence in that object and we might be getting better performance using a custom TCP443 object for the same flow.
Another thing I noticed is that all of our rules in our security policy use "Log" as the track action and figured. that might give us additional overhead.
- Mark as New
- Bookmark
- Subscribe
- Mute
- Subscribe to RSS Feed
- Permalink
- Report Inappropriate Content
Thanks for your detailed description. I don‘t know if you have the same problem like us, but I‘ll try to explain.
One of our customer is using Always On VPN for about 200 users, the Internet Connection has 2Gb/s. The gateways are 5600 appliances with a similar setup like yours. Https encrypted connections from the clients to AO-VPN servers and from AO-VPN unencrypted to the fileservers in the datacenter. These unencrypted traffic will be the problem. Most of the users are using an application with very high intensity of fileaccess to Microsoft cifs-share (tcp/445). As the nature of this protocol it‘s hard to analyze and the traffic does not go through SecureXL path. It‘s always f2f.
Creating an exception for tcp/445 in the ThreatPrevention does not help. Only sending them direct via fast_accel rules to the fastest path solved the performance problem. See sk15667.
4 clients accessing the corporate network via AO-VPN and 400Mbit/s throughput results in 90%CPU on the 5600 appliances and a massive performance degrading for all other. I don‘t know if this will be your problem but you should had a look at the SMB-traffic to your fileservers. Our solution was to exclude the tcp/445-traffic between AO-VPN clients and the fileservers from deeper inspection via fast_accel rule.
- Mark as New
- Bookmark
- Subscribe
- Mute
- Subscribe to RSS Feed
- Permalink
- Report Inappropriate Content
Sounds like elephant flow issue. We did the same and added entries in to fast path.
We have 15600's and no https inspection on, pretty convinced the CPU utilisation would hit the roof if we enabled it.
I personally think Checkpoint should be considering dedicate acceleration cards or chips from all medium and high range appliances.
- Mark as New
- Bookmark
- Subscribe
- Mute
- Subscribe to RSS Feed
- Permalink
- Report Inappropriate Content
Thanks for your reply! We will be looking into that.
- Mark as New
- Bookmark
- Subscribe
- Mute
- Subscribe to RSS Feed
- Permalink
- Report Inappropriate Content
@Wolfgang has done a great job of assessing your situation. After looking at all your outputs there are a couple of different things slowing you down:
1) You said that the Direct Access traffic is IPSec tunneled in HTTPS, but I strongly suspect it is the other way around where HTTPS is tunneled in IPSec. Only TCP and UDP traffic can be throughput accelerated (or templated) by SecureXL. So that IPSec traffic that is traversing the firewall is one cause of the high PXL even though only "fw" is enabled; PXL must be handled on a firewall worker/instance.
2) As Wolfgang said if you have non-tunneled CIFS traffic traversing the firewall, CIFS is its own protocol that can't be accelerated by SecureXL and will account for even more PXL traffic.
3) The IPSec traffic in PXL appears to be getting handled on the unfortunate fw worker instance #27 which is either CPU #2 or #3 depending on which command you are running. I suspect that instance is being saturated because all the IPSec traffic is from one IP address to another single address and essentially is a single elephant flow as Wolfgang mentioned. The single firewall instance hitting 100% is causing your bottleneck; the rest of the firewall is very idle as you noted.
4) In your R80.30 release the PXL packets of a single connection can only be handled on one firewall worker at a time, and load cannot be shared or shed from the saturated instance. All the Dynamic Dispatcher can do is cause new connections to stay clear of the saturated instance, but the connections/flows on that saturated instance are stuck there. You can use the fw ctl multik gconn command to see which connections are assigned to the saturated instance (number 27 in your scenario), and I can pretty much guarantee you will see the IPSec "connection" elephant flow there. The fw ctl multik print_heavy_conn command will show you all current connections that the firewall has classified as heavy (elephant flow) as well as those detected for the last 24 hours.
So that brings us to what you can do about it now with your current code level.
1) As Wolfgang mentioned you will want to identify the attributes of the elephant flow and use the fast_accel feature to fastpath it through SecureXL on a SND/IRQ instance. Because the IPSec traffic is not going F2F this should work. Your performance will definitely increase, but you may then saturate the single SND/IRQ instance which can cause some other nasty effects such as packet loss due to RX-DRP.
2) So I'd recommend enabling Multi-Queue on all interfaces handling this IPSec elephant flow to avoid RX-DRP. To some degree Multi-Queue should be able to spread the load out a bit among the SND/IRQ cores.
3) As a result of doing this, hopefully almost all traffic through the firewall will be fully accelerated and handled by the 4 SND/IRQ cores with the 28 instances sitting idle since there is now little PXL and F2F traffic. You will probably want to change your 4/28 CoreXL split to 8/24 but this may not be necessary if you don't see any SND/IRQ cores getting saturated after the change.
Next let's discuss how this situation is handled in future releases such as R80.40+.
1) R80.40 introduced the concept of Dynamic Split but it is disabled by default; it is enabled by default in R81 and later. This will auto-adjust your core split on the fly if all SND/IRQ cores or all Firewall Workers start getting saturated. This wouldn't really help your current scenario.
2) What would help is that R80.40 introduced a set of new paths tagged with the "pipeline" moniker (visible with fwaccel stats -s) that I believe are still disabled by default in the latest R80.40 Jumbo HFAs. However I think these new pipeline paths will be enabled by default in R81.10 (they may be in R81 GA as well, not sure). The pipeline paths allow limited "spreading" of elephant flow load across multiple worker cores to avoid a single worker getting saturated with all the connections trapped on it.
3) In R80.40 and later Multi-Queue is enabled on all interfaces by default (except the management interface in R80.40 GA and the early Jumbo HFAs).
Whew that got a lot longer than I intended, let me know if you have any questions.
New Book: "Max Power 2026" Coming Soon
Check Point Firewall Performance Optimization
Check Point Firewall Performance Optimization
- Mark as New
- Bookmark
- Subscribe
- Mute
- Subscribe to RSS Feed
- Permalink
- Report Inappropriate Content
Thank you very much for your extensive reply. Almost a bit star struck getting this reply when going through your session on the super seven.
I will put my network team onto this as soon as I can, but sadly we still are very far apart in even accepting that we do have a problem in our firewall only getting 0,03% of our 10Gbit throughput.
I looked at the commands you posted now and we have no output at all running fw ctl multik print_heavy_conn but running fw ctl multik gconn I get that we have loads of lines and I can't really make any sense of, is there a way to group it by instance or something to make sense of it? I do see alot of 27s, but I can't really relate anything to the real world from the output.
As for IPSec tunneling HTTPS or the other way around, I suspect you are correct.
Thanks again for your reply!
- Mark as New
- Bookmark
- Subscribe
- Mute
- Subscribe to RSS Feed
- Permalink
- Report Inappropriate Content
Well I'd say it is definitely a problem when 1 of 32 cores is running at 100% (with all other cores relatively idle) and causing a serious bottleneck. You are essentially getting 1/32 of the speed you could be.
To diagnose the CPU that is running at 100% you need to ensure you are looking at the right one, so you need to map that CPU number to an instance number which is a bit confusing. So in your cpstat output (which annoyingly numbers the CPUs 1-32) suppose that CPU 3 is at 100%. Run fw ctl affinity -l -r (which CORRECTLY numbers the CPUs 0-31) and CPU 2 is the one we want to look at. Firewall Instance 27 (fw_27) is assigned to CPU 2 so the instance number is 27. Now run this command:
fw ctl multik gconn | awk -F '|' '$10 == 27'
This will display all connections mapped to overloaded instance 27. Make a note of them. Then during a downtime window kill or otherwise reset the Direct Access connection. When it starts back up load it up with traffic and now a different firewall instance should be overloaded. Track it down and list the connections on the overloaded instance. See any commonalities?
Otherwise when the core is overloaded you could just run cpview and look at the CPU...Top Connections and Network...Top Connections screens, but these screens will be empty unless you have at least Jumbo HFA Take 221 on your R80.30 box. See sk167903: CPview Top Connections and Protocols tabs show no data
You may not see any identified heavy connections with fw ctl multik print_heavy_conn because Priority Queueing (which is what measures and identifies the heavy connections) is disabled by default in R80.30, what does the output of fw ctl multik prioq show? sk105762: Firewall Priority Queues in R77.30 / R80.x
This can be really annoying to hear so I'll only mention it once, but most of the performance issues involving elephant flows and unbalanced CPU utilization have been solved in the later releases past R80.30. When I gave my CPX speech in early 2020 about elephant flows I pointed out a number of glaring performance limitations, and hinted at some great new features to address the issue that I couldn't discuss at the time. This area is a very high priority for Check Point R&D and they have made a truly mind-boggling amount of progress in this area since my speech, and there are even more amazing improvements on the horizon.
New Book: "Max Power 2026" Coming Soon
Check Point Firewall Performance Optimization
Check Point Firewall Performance Optimization
- Mark as New
- Bookmark
- Subscribe
- Mute
- Subscribe to RSS Feed
- Permalink
- Report Inappropriate Content
Reading your post reminded me of a TCP window auto scaling issue encountered some years ago.
https://directaccess.richardhicks.com/2018/02/19/directaccess-ip-https-performance-issues/
seems to confirm my suspicion.
From the post on that link, and for those following this thread:
"DirectAccess uses a complex and heavy communication channel, with multiple layers of encapsulation, encryption, and translation. Fundamentally it is IPsec encrypted IPv6 traffic, encapsulated in HTTP, and then encrypted with Transport Layer Security (TLS) and routed over IPv4. It is then decrypted, decapsulated, decrypted again, then converted back to IPv4. The high protocol overhead incurred with multiple layers of encapsulation, encryption, and translation result in increased packet fragmentation, which further reduces performance."
And Microsoft's suggestion to those affected is "upgrade to Always On VPN."
There are few more comments I'd like to make:
1. What purpose does piping the inbound traffic to Direct Access through Check Point serves?
Since your users are authenticating and are establishing encrypted communication with DirectAccess, it seems leaving its external interface exposed to the Internet is not a terrible idea (short of Geo protection and time-based rules).
2. The elephant flow theory can explain a single core chocked by a single or a few flows. I would imagine that with 1300 clients connecting, you would see multiple cores being saturated.
3. If at some point in the past DirectAccess through Check Point did work better, it is possible that it was using Teredo tunneling that was disabled by Microsoft in Windows 10 versions 1809 and later and it had to be manually re-enabled.
- Mark as New
- Bookmark
- Subscribe
- Mute
- Subscribe to RSS Feed
- Permalink
- Report Inappropriate Content
Thanks.
I’m sorry if I’m coming off ungrateful, but this is the typical response we get from a lot of people who just want to get rid of the problem without finding the root cause of an issue.
My conclusions is this. Using a consumer product with a single core setup just doing NAT on this traffic we get about 90% throughout(still a lot of overhead as you mentioned) with the same DirectAccess. Running our more than 1000 times more expensive 15600 clusters we get 0,03% throughout.
The DirectAccess servers have only one NIC so needs something to run NAT in front of it.
AlwaysOnVPN doesn’t provide us with the same User experience and it isn’t an option to move from having a native 2FA SSO solution to a less secure solution which require more user interaction. Our users log on to their computers and the USER is connected to our LAN in their context. We’ve had this discussion with Microsoft who still very much supports DA and they concede the point that they don’t offer the same service with AO-VPN.
We probably always have had this issue, but it wasn’t until the pandemic when people started working from home that we actually noticed anything wrong and that our firewalls seems unable to handle the traffic.
We setup our infrastructure to suit our needs and requirements, not the other way around. If a component(15600 in this case) can’t deliver the service and performance we need we will replace that component and as it stands right now any 1Gbit consumer router delivers better performance for our organisation.
- Mark as New
- Bookmark
- Subscribe
- Mute
- Subscribe to RSS Feed
- Permalink
- Report Inappropriate Content
If you opened a ticket on this, can you send me the relevant SR in a PM?
- Mark as New
- Bookmark
- Subscribe
- Mute
- Subscribe to RSS Feed
- Permalink
- Report Inappropriate Content
I will as soon as I get the SR number.
- Mark as New
- Bookmark
- Subscribe
- Mute
- Subscribe to RSS Feed
- Permalink
- Report Inappropriate Content
Great, hopefully this thread will guide your TAC case and help get you a speedy diagnosis and resolution. Please report back the results to this thread so others can benefit from the findings. Thanks!
New Book: "Max Power 2026" Coming Soon
Check Point Firewall Performance Optimization
Check Point Firewall Performance Optimization
- Mark as New
- Bookmark
- Subscribe
- Mute
- Subscribe to RSS Feed
- Permalink
- Report Inappropriate Content
Yes ofcourse!
Just a quick question using fw ctl fast_accel show_table has some entries. If we have this feature enable, do these rules bypass the security policy on the box they're installed on? Do we need to set them on each box in the cluster och can they be installed on the cluster entity itself?
- Mark as New
- Bookmark
- Subscribe
- Mute
- Subscribe to RSS Feed
- Permalink
- Report Inappropriate Content
As I just posted in another thread, fast_accel rules are not a full bypass. The connection must be accepted by the Firewall/Network layer first based on IP addresses and ports. Once that accept happens, the Firewall Worker decides what depth of inspection will be required and therefore which path the connection can be handled in; for some limited situations the traffic will be offloaded to SecureXL for full acceleration anyway with the need for a fast_accel rule.
The fast_accel rule just signals to the Worker that this connection should be offloaded to SecureXL if at all possible, even at the expense of some deeper inspection. As such you really should not fast_accel traffic to and from untrusted systems, as the full inspection being called for by your security policy is not taking place. But SecureXL will still perform all the inspection it is capable of, and still drop offending traffic as needed.
The fast_accel feature is not sync'ed between cluster members and must be configured on both members independently. If the fast_accel rules are not identical on all members, it may cause issues with connection handling upon failover but I'm not 100% sure about that. Best to make sure they are identical on all members.
New Book: "Max Power 2026" Coming Soon
Check Point Firewall Performance Optimization
Check Point Firewall Performance Optimization
- Mark as New
- Bookmark
- Subscribe
- Mute
- Subscribe to RSS Feed
- Permalink
- Report Inappropriate Content
In other words, we should have a single rule in the firewall policy that contains only destination IP(s) and ports with "accept", "log" and nothing else before fast_accel rules are added on each cluster member. There are some caveats and limitations to this feature mentioned in sk156672 (for specific JHFAs), that should probably be looked into.
@Timothy_Hall , in this particular case though, since the legitimate payload of the IP-HTTPS is an IPv6 tunneled traffic destined for the DirectAccess we can't really differentiate it from any other HTTPS traffic, so either all of it could be permitted with bypass, or non at all.
Security in this case could be handled by implementing the client certificate authentication requirement on DirectAccess clients.
- Mark as New
- Bookmark
- Subscribe
- Mute
- Subscribe to RSS Feed
- Permalink
- Report Inappropriate Content
@stefan_am , my reply was not intended as a brush-off, just an attempt to describe the problem from different perspective and to shed a light on the way Microsoft has designed the communication channels for the product that is a part of the issue.
As a more constructive suggestion, I would suggest trying fw ctl fast_accel on IP-HTTPS traffic to your DirectAccess servers. Since it is indeed an IPSec connection tunneled in the HTTPS tunnel, it should still work.
- Mark as New
- Bookmark
- Subscribe
- Mute
- Subscribe to RSS Feed
- Permalink
- Report Inappropriate Content
*** Update two weeks into the troubleshooting.
No TAC yet but recruited a new consultant who have started by performing tests in our network.
Found out we get line speed performance connecting through our VPN from the internal interfaces to EDGE and back in again, which suggest the performance loss is located in the Internet -> EDGE-FW -> DMZ flow.
The only difference I can find between CORE -> EDGE-FW -> DMZ and the above flow is that traffic from the internet is affected by NAT rules. (From <NOT INTERNAL OR DMZ> to 10.10.20.110(DA-server) NAT 123.10.20.110(DA-server external address) in this case. I can't find the 123.10.20.0-addresses anywhere but in the NAT rules, nothing on any bond and no record in the routing table, but unsure if that is actually affecting anything.
We also noticed we do get about 3 times the performance uploading from a remote client than the same remote client get downloading.
To summarize we're still troubleshooting and the load on the firewall cores are spread alot more evenly between the cores but we still get exactly the same performance. Could it be explained with a configuration issue, like routing or rule evaluation?
- Mark as New
- Bookmark
- Subscribe
- Mute
- Subscribe to RSS Feed
- Permalink
- Report Inappropriate Content
Not sure I understand where the address 20.10.20.0 is situated after reading your post. Perhaps one of us is missing something.
If you are looking for the IP mentioned in NAT but otherwise absent, check the Gaia "Network Management/ARP/Proxy ARP" to see if it is used there on both cluster members.
- Mark as New
- Bookmark
- Subscribe
- Mute
- Subscribe to RSS Feed
- Permalink
- Report Inappropriate Content
I'm sorry, I was going to write 123.10.20.0 in that line aswell.
Network Management/ARP/Proxy ARP contains nothing, am I looking at the wrong place? The network isn't defined anywhere from what I can see.
Leaderboard
Epsum factorial non deposit quid pro quo hic escorol.
| User | Count |
|---|---|
| 64 | |
| 19 | |
| 13 | |
| 12 | |
| 11 | |
| 9 | |
| 8 | |
| 7 | |
| 7 | |
| 7 |
Upcoming Events
Tue 28 Apr 2026 @ 06:00 PM (IDT)
Under the Hood: Securing your GenAI-enabled Web Applications with Check Point WAFTue 28 Apr 2026 @ 06:00 PM (IDT)
Under the Hood: Securing your GenAI-enabled Web Applications with Check Point WAFTue 12 May 2026 @ 10:00 AM (CEST)
The Cloud Architects Series: Check Point Cloud Firewall delivered as a serviceThu 30 Apr 2026 @ 03:00 PM (PDT)
Hillsboro, OR: Securing The AI Transformation and Exposure ManagementAbout CheckMates
Learn Check Point
Advanced Learning
YOU DESERVE THE BEST SECURITY
©1994-2026 Check Point Software Technologies Ltd. All rights reserved.
Copyright
Privacy Policy
About Us
UserCenter