- Products
- Learn
- Local User Groups
- Partners
- More
This website uses Cookies. Click Accept to agree to our website's cookie use as described in our Privacy Policy. Click Preferences to customize your cookie settings.
- Products
- AI Security
- Developers & More
- Check Point Trivia
- CheckMates Toolbox
- General Topics
- Products Announcements
- Threat Prevention Blog
- Upcoming Events
- Americas
- EMEA
- Czech Republic and Slovakia
- Denmark
- Netherlands
- Germany
- Sweden
- United Kingdom and Ireland
- France
- Spain
- Norway
- Ukraine
- Baltics and Finland
- Greece
- Portugal
- Austria
- Kazakhstan and CIS
- Switzerland
- Romania
- Turkey
- Belarus
- Belgium & Luxembourg
- Russia
- Poland
- Georgia
- DACH - Germany, Austria and Switzerland
- Iberia
- Africa
- Adriatics Region
- Eastern Africa
- Israel
- Nordics
- Middle East and Africa
- Balkans
- Italy
- Bulgaria
- Cyprus
- APAC
MVP 2026: Submissions
Are Now Open!
What's New in R82.10?
10 December @ 5pm CET / 11am ET
Announcing Quantum R82.10!
Learn MoreOverlap in Security Validation
Help us to understand your needs better
CheckMates Go:
Maestro Madness
Turn on suggestions
Auto-suggest helps you quickly narrow down your search results by suggesting possible matches as you type.
Showing results for
- CheckMates
- :
- Products
- :
- Network & SASE
- :
- Security Gateways
- :
- Re: SNMP CPU load on VSX
Options
- Subscribe to RSS Feed
- Mark Topic as New
- Mark Topic as Read
- Float this Topic for Current User
- Bookmark
- Subscribe
- Mute
- Printer Friendly Page
Turn on suggestions
Auto-suggest helps you quickly narrow down your search results by suggesting possible matches as you type.
Showing results for
Are you a member of CheckMates?
×
Sign in with your Check Point UserCenter/PartnerMap account to access more great content and get a chance to win some Apple AirPods! If you don't have an account, create one now for free!
- Mark as New
- Bookmark
- Subscribe
- Mute
- Subscribe to RSS Feed
- Permalink
- Report Inappropriate Content
SNMP CPU load on VSX
Hi All,
We have a customer with VSX which is using SNMP to monitor the load on virtual systems.
He configured CPU per vs and below is a graph of the CPU load on a virtual system with only one firewall instance.
All virtual system can use all the CPU's on the appliance (except the SND CPU's).
Customer has the feeling the CPU load is never above 15%. Even if the firewall is under load during a nightly backup job going through this gateway.
Is 15% within SNMP a 100% load on the gateway? How is this calculated? The virtual system does not have a real CPU, but just a firewall instance attached. Is the percentage in SNMP the real load on a CPU?
And what about virtual system with multi firewall instances. Is the load in SNMP the average of the load on all CPU's for that virtual system?
Regards,
Martijn.

9 Replies
- Mark as New
- Bookmark
- Subscribe
- Mute
- Subscribe to RSS Feed
- Permalink
- Report Inappropriate Content
Hi Martijn,
While I don't have the complete answer here is some food for thought: "What SNMP interpretation tool are you using"?
Not all tools can handle the information provided over SNMPv3 well.
My records show this (may have improved, this is end of July):
CA eHealth has no snmp V3 support
PRTG: cannot handle tables. Not good for visualizing the asg tables (when using Scalable Platforms)
Zabbix: - has SNMP v3 support
- context aware for vsx
- Can handle tables
Icinga/Nagios: can do everything and is free, you need someone who's able to handle it
Manage Engine: can handle everything, privacy not ok
Solar winds and HP: can handle everything. can even cook coffee, make Pizza etc 🙂
In general load is shown as a function towards the whole system, this may differ depending on the OID queried. Each VS process can address a core, when running a single instance that means only one core at a time though the scheduler may decide to jump to another core if that is less loaded. Core assignment is a real-time process in the Linux kernel
BR
Peter !!
- Mark as New
- Bookmark
- Subscribe
- Mute
- Subscribe to RSS Feed
- Permalink
- Report Inappropriate Content
Guys,
Need some clarification on what OIDs represent CPU utilisation at a virtual system or virtual switch level.
Based some feedback in the forum and what I researched it looks like the only OID I require is "fw instancescpu/fw instances cpu total"
In PRTG I have added this per virtual system and then created a graph which combines all these in to one view, only other thing I need to work on is adding total CPUs so there is a max value.
The idea will be to have an upper limit value which will be the total amount of worker cores available, against what is being used.
I've had a look but I can't find a OID that represents total worker cores count.

- Mark as New
- Bookmark
- Subscribe
- Mute
- Subscribe to RSS Feed
- Permalink
- Report Inappropriate Content
Hey,
I think I answered this in another of your replies? You should use CHECKPOINT-MIB::fwInstancesCPUTable
This gives you cpu load per fwk thread. This also helps with the max value, that will always be 100%
With the approach you show above, you will be hard pressed to show it intuatively with VSs that have different #corexl instances
/Henrik
- Mark as New
- Bookmark
- Subscribe
- Mute
- Subscribe to RSS Feed
- Permalink
- Report Inappropriate Content
I found SK170756 yesterday "How to monitor CPU usage per VS via SNMP in Gaia Kernel 3.10" which indicates to use 'fwInstancesCPU', which is basically what I'm using. In prtg its not a separate value 'fw instancescpu/fw instances cpu total', so not quite sure how I get the maximum worker cores value.
I only see this value in the R81 MIB file 'Checkpoint-R81-MIB' and not the 'Checkpoint-MIB' file which is strange.
- Mark as New
- Bookmark
- Subscribe
- Mute
- Subscribe to RSS Feed
- Permalink
- Report Inappropriate Content
have you tested that this actually works? because before the OID did not consider how many VS instanses was allocated to a VS, but it took a AVG of all the cpu cores on the box for some calculation.
https://www.youtube.com/c/MagnusHolmberg-NetSec
- Mark as New
- Bookmark
- Subscribe
- Mute
- Subscribe to RSS Feed
- Permalink
- Report Inappropriate Content
It seems to be working.
I added the OID per VS and then created a chart which links them all in one graph. I also looked at the top output and seems about right.
All I'm missing now is a OID to get the total number of worker cores so I can add this into the graph as an upper limit value.
- Mark as New
- Bookmark
- Subscribe
- Mute
- Subscribe to RSS Feed
- Permalink
- Report Inappropriate Content
There is no such OID. But fwInstancesCPU gives you the number.
When polling fwInstancesCPUTable you get the following, showing vdName, threads (look for fwkx_x giving you the number of corexl) and cpu load for these threads.
See data below from my own environment. Showing vs 4 having 6 cores
> fwInstancesCPUTable,agent_host=10.200.11.4,fwInstancesCPUInstanceName=fwk4_0,host=<pollerhost>,hostname=<secret firewall>,vdName=<secret vs> fwInstancesCPUUsage=6i 1625604524000000000
> fwInstancesCPUTable,agent_host=10.200.11.4,fwInstancesCPUInstanceName=fwk4_5,host=<pollerhost>,hostname=<secret firewall>,vdName=<secret vs> fwInstancesCPUUsage=14i 1625604524000000000
> fwInstancesCPUTable,agent_host=10.200.11.4,fwInstancesCPUInstanceName=fwk4_3,host=<pollerhost>,hostname=<secret firewall>,vdName=<secret vs> fwInstancesCPUUsage=5i 1625604524000000000
> fwInstancesCPUTable,agent_host=10.200.11.4,fwInstancesCPUInstanceName=fwk4_dev_1,host=<pollerhost>,hostname=<secret firewall>,vdName=<secret vs> fwInstancesCPUUsage=0i 1625604524000000000
> fwInstancesCPUTable,agent_host=10.200.11.4,fwInstancesCPUInstanceName=fwk4_kissd,host=<pollerhost>,hostname=<secret firewall>,vdName=<secret vs> fwInstancesCPUUsage=0i 1625604524000000000
> fwInstancesCPUTable,agent_host=10.200.11.4,fwInstancesCPUInstanceName=fwk4_1,host=<pollerhost>,hostname=<secret firewall>,vdName=<secret vs> fwInstancesCPUUsage=7i 1625604524000000000
> fwInstancesCPUTable,agent_host=10.200.11.4,fwInstancesCPUInstanceName=fwk4_2,host=<pollerhost>,hostname=<secret firewall>,vdName=<secret vs> fwInstancesCPUUsage=3i 1625604524000000000
> fwInstancesCPUTable,agent_host=10.200.11.4,fwInstancesCPUInstanceName=fwk4_hp,host=<pollerhost>,hostname=<secret firewall>,vdName=<secret vs> fwInstancesCPUUsage=0i 1625604524000000000
> fwInstancesCPUTable,agent_host=10.200.11.4,fwInstancesCPUInstanceName=fwk4_4,host=<pollerhost>,hostname=<secret firewall>,vdName=<secret vs> fwInstancesCPUUsage=38i 1625604524000000000
> fwInstancesCPUTable,agent_host=10.200.11.4,fwInstancesCPUInstanceName=fwk4_dev_5,host=<pollerhost>,hostname=<secret firewall>,vdName=<secret vs> fwInstancesCPUUsage=0i 1625604524000000000
> fwInstancesCPUTable,agent_host=10.200.11.4,fwInstancesCPUInstanceName=fwk4_dev_4,host=<pollerhost>,hostname=<secret firewall>,vdName=<secret vs> fwInstancesCPUUsage=0i 1625604524000000000
> fwInstancesCPUTable,agent_host=10.200.11.4,fwInstancesCPUInstanceName=fwk4_dev_3,host=<pollerhost>,hostname=<secret firewall>,vdName=<secret vs> fwInstancesCPUUsage=0i 1625604524000000000
> fwInstancesCPUTable,agent_host=10.200.11.4,fwInstancesCPUInstanceName=fwk4_dev_0,host=<pollerhost>,hostname=<secret firewall>,vdName=<secret vs> fwInstancesCPUUsage=0i 1625604524000000000
> fwInstancesCPUTable,agent_host=10.200.11.4,fwInstancesCPUInstanceName=fwk4_service,host=<pollerhost>,hostname=<secret firewall>,vdName=<secret vs> fwInstancesCPUUsage=0i 1625604524000000000
> fwInstancesCPUTable,agent_host=10.200.11.4,fwInstancesCPUInstanceName=fwk4_dev_2,host=<pollerhost>,hostname=<secret firewall>,vdName=<secret vs> fwInstancesCPUUsage=0i 1625604524000000000
The above translates to this graph, with no need to know corexl assigned, even giving the benefit of seeing individual threads spiking.
- Mark as New
- Bookmark
- Subscribe
- Mute
- Subscribe to RSS Feed
- Permalink
- Report Inappropriate Content
Great!
It could be how prtg reads the information, equally though I would like a simple total value of worker cores. The above is great to break it down at a VS level (and that is something I would like to do as well), but I also want it at the appliance level ie. if cpview I can see how may worker cores and SND cores are allocated as an example.
- Mark as New
- Bookmark
- Subscribe
- Mute
- Subscribe to RSS Feed
- Permalink
- Report Inappropriate Content
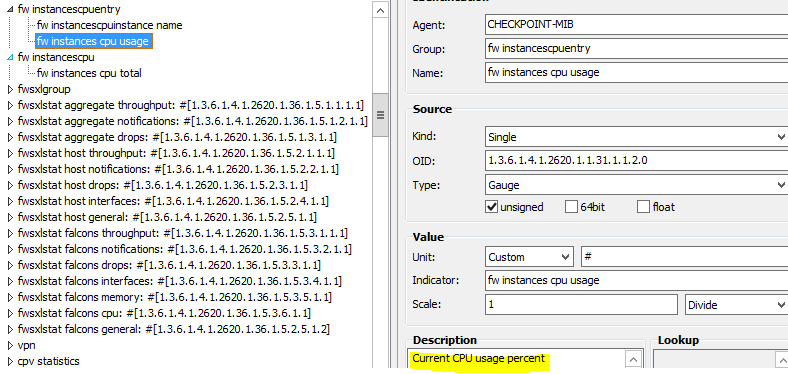
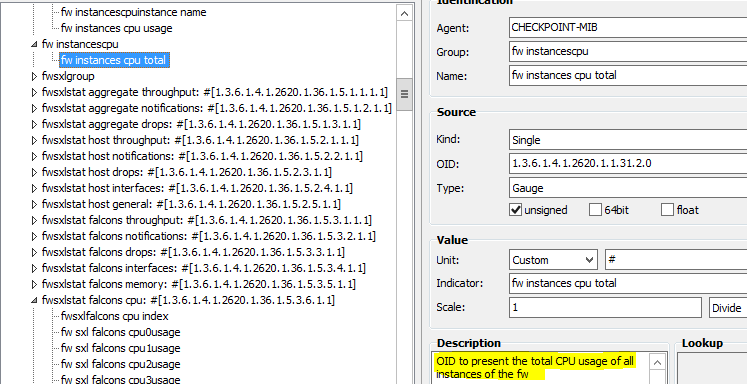
Had a look but still not seeing this value:
We can see from the descriptions they don't really pick up the amount of cores allocated as a single value.
Leaderboard
Epsum factorial non deposit quid pro quo hic escorol.
| User | Count |
|---|---|
| 26 | |
| 20 | |
| 16 | |
| 5 | |
| 4 | |
| 4 | |
| 4 | |
| 3 | |
| 3 | |
| 3 |
Upcoming Events
Fri 12 Dec 2025 @ 10:00 AM (CET)
Check Mates Live Netherlands: #41 AI & Multi Context ProtocolTue 16 Dec 2025 @ 05:00 PM (CET)
Under the Hood: CloudGuard Network Security for Oracle Cloud - Config and Autoscaling!Fri 12 Dec 2025 @ 10:00 AM (CET)
Check Mates Live Netherlands: #41 AI & Multi Context ProtocolTue 16 Dec 2025 @ 05:00 PM (CET)
Under the Hood: CloudGuard Network Security for Oracle Cloud - Config and Autoscaling!Thu 18 Dec 2025 @ 10:00 AM (CET)
Cloud Architect Series - Building a Hybrid Mesh Security Strategy across cloudsAbout CheckMates
Learn Check Point
Advanced Learning
YOU DESERVE THE BEST SECURITY
©1994-2025 Check Point Software Technologies Ltd. All rights reserved.
Copyright
Privacy Policy
About Us
UserCenter


