- Products
- Learn
- Local User Groups
- Partners
- More
This website uses Cookies. Click Accept to agree to our website's cookie use as described in our Privacy Policy. Click Preferences to customize your cookie settings.
- Products
- Learn
- Local User Groups
- Upcoming Events
- Americas
- EMEA
- Czech Republic and Slovakia
- Denmark
- Netherlands
- Germany
- Sweden
- United Kingdom and Ireland
- France
- Spain
- Norway
- Ukraine
- Baltics and Finland
- Greece
- Portugal
- Austria
- Kazakhstan and CIS
- Switzerland
- Romania
- Turkey
- Belarus
- Belgium & Luxembourg
- Russia
- Poland
- Georgia
- DACH - Germany, Austria and Switzerland
- Iberia
- Africa
- Adriatics Region
- Eastern Africa
- Israel
- Nordics
- Middle East and Africa
- Balkans
- Italy
- Bulgaria
- Cyprus
- APAC
- Partners
- More
- ABOUT CHECKMATES & FAQ
- Sign In
- Leaderboard
- Events
Ink Dragon: A Major Nation-State Campaign
Watch HereAI Security Masters E5:
Powering Prevention: The AI Driving Check Point’s ThreatCloud
The Great Exposure Reset
AI Security Masters E4:
Introducing Cyata, Securing the Agentic AI Era
CheckMates Go:
CheckMates Fest
Turn on suggestions
Auto-suggest helps you quickly narrow down your search results by suggesting possible matches as you type.
Showing results for
- CheckMates
- :
- Products
- :
- Hybrid Mesh
- :
- Firewall and Security Management
- :
- Re: High memory usage
Options
- Subscribe to RSS Feed
- Mark Topic as New
- Mark Topic as Read
- Float this Topic for Current User
- Bookmark
- Subscribe
- Mute
- Printer Friendly Page
Turn on suggestions
Auto-suggest helps you quickly narrow down your search results by suggesting possible matches as you type.
Showing results for
Are you a member of CheckMates?
×
Sign in with your Check Point UserCenter/PartnerMap account to access more great content and get a chance to win some Apple AirPods! If you don't have an account, create one now for free!
- Mark as New
- Bookmark
- Subscribe
- Mute
- Subscribe to RSS Feed
- Permalink
- Report Inappropriate Content
Jump to solution
High memory usage
Hello,
Wanted to share the issue we have with our gateway. We have following blades enabled:
fw urlf appi identityServer SSL_INSPECT content_awareness mon
Appliance is with 16gb, running latest R80.30.
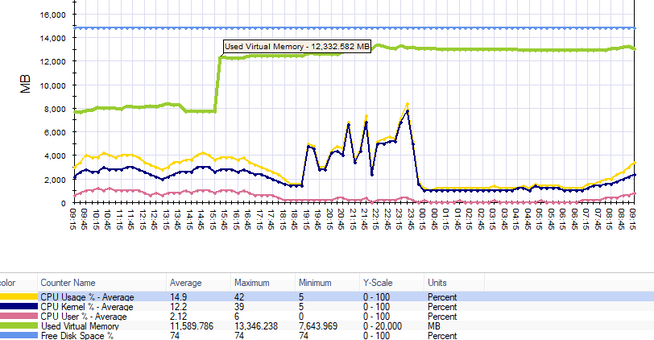
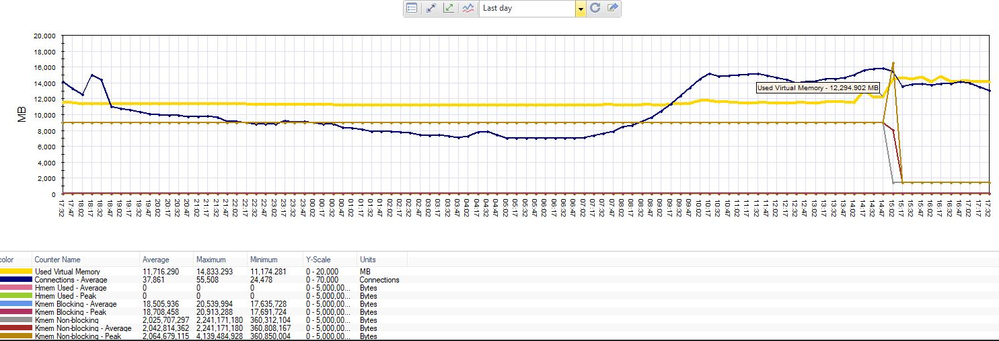
The problem we are having is that at some point memory usage increases sharply and it never comes down, unless we reboot appliance. This is causing issues to the traffic because some connections are getting disconnected during occurrence. I can't find in top (shift+m) any process which would contribute to this behaviour.
I hope I am not alone with this issue, so please give a shout if you have something similar. Some of the occurrences from the past to show what happens:
53 Replies
- Mark as New
- Bookmark
- Subscribe
- Mute
- Subscribe to RSS Feed
- Permalink
- Report Inappropriate Content
Sorry but there is no such command neither in bin/bash nor in /etc/cli.sh 🙂
- Mark as New
- Bookmark
- Subscribe
- Mute
- Subscribe to RSS Feed
- Permalink
- Report Inappropriate Content
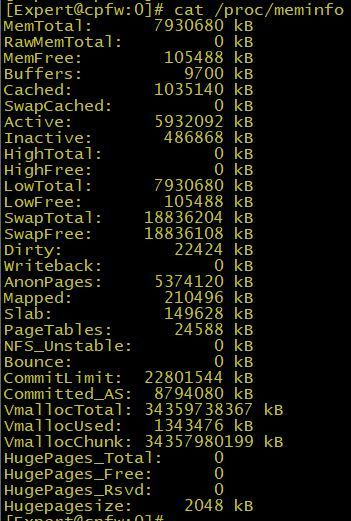
What about 'cat /proc/meminfo' ?
- Mark as New
- Bookmark
- Subscribe
- Mute
- Subscribe to RSS Feed
- Permalink
- Report Inappropriate Content
Here it is? Any ideas?
- Mark as New
- Bookmark
- Subscribe
- Mute
- Subscribe to RSS Feed
- Permalink
- Report Inappropriate Content
Hmm, i believed all R80.40 would use the Dynamic Clish(sk144112) already, my mistake.
In this case the command is "fw ctl pstat".
- Mark as New
- Bookmark
- Subscribe
- Mute
- Subscribe to RSS Feed
- Permalink
- Report Inappropriate Content
Notice that almost all available memory is in Active state which means it is constantly being pulled in for use as cache or buffers. It can and it will be used by the kernel if it runs short on process memory but only if very necessary.
How is the system performance otherwise? What 'top | head -n 10' shows ?
- Mark as New
- Bookmark
- Subscribe
- Mute
- Subscribe to RSS Feed
- Permalink
- Report Inappropriate Content
As I mentioned, this java keep using memory.
- Mark as New
- Bookmark
- Subscribe
- Mute
- Subscribe to RSS Feed
- Permalink
- Report Inappropriate Content
Hi,
We have a similar issue but not sure if others have the same outputs.
Running R80.30 Take 155.
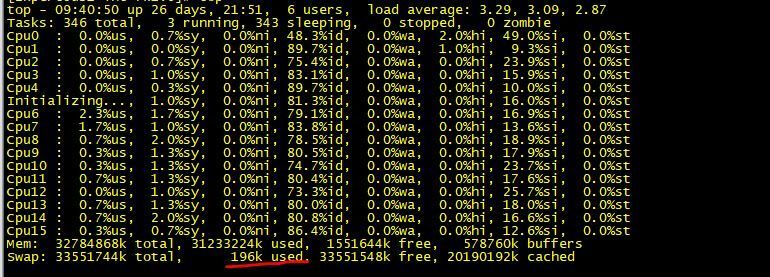
On top command I see high usage of memory as well as 'free -m' output;
top - 08:52:30 up 26 days, 21:03, 5 users, load average: 1.79, 2.20, 2.19
Tasks: 342 total, 3 running, 339 sleeping, 0 stopped, 0 zombie
Cpu(s): 0.6%us, 0.6%sy, 0.3%ni, 91.1%id, 0.0%wa, 0.1%hi, 7.3%si, 0.0%st
Mem: 32784868k total, 31227084k used, 1557784k free, 578016k buffers
Swap: 33551744k total, 196k used, 33551548k free, 20191296k cached
# free -m
total used free shared buffers cached
Mem: 32016 30494 1521 0 564 19718
-/+ buffers/cache: 10212 21804
Swap: 32765 0 32765
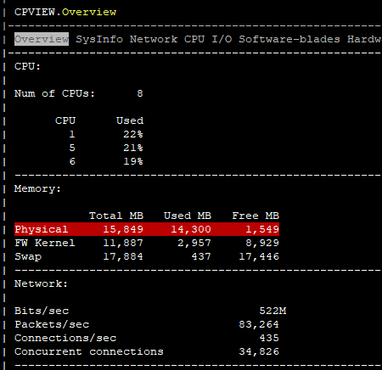
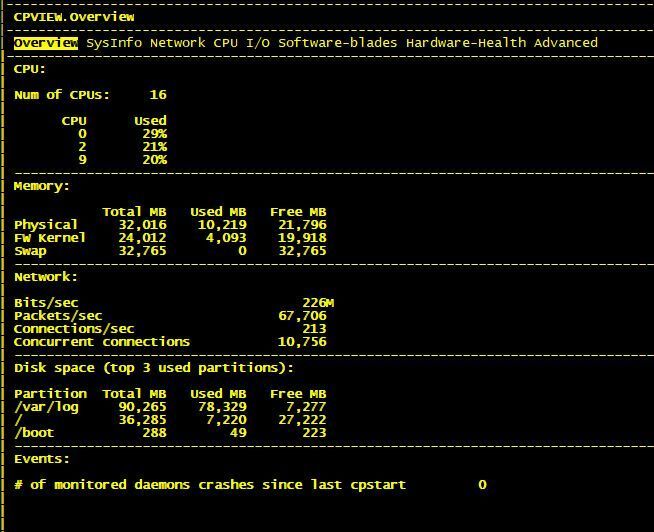
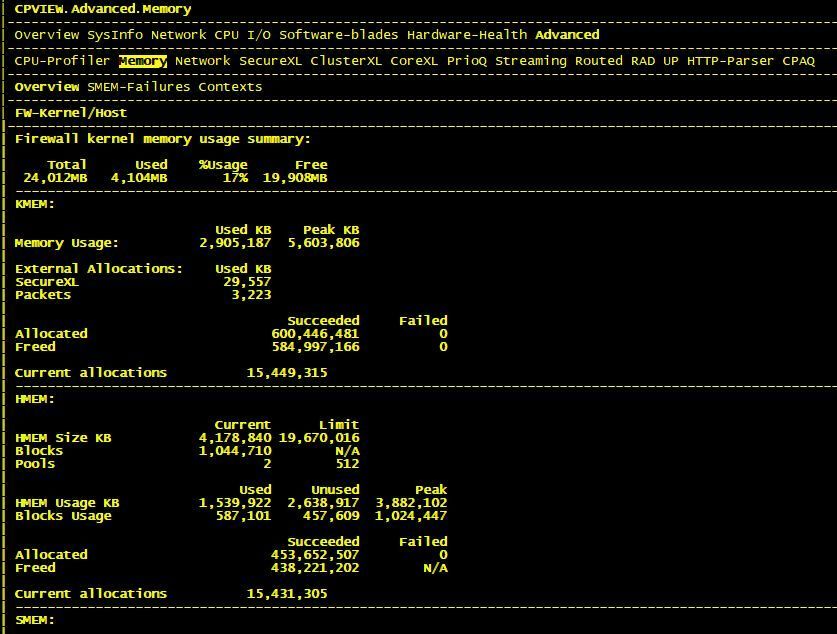
On the other hand when I check from the cpview I see only %17 of usage , also Smart Console shows low memory usage.
# fw ctl pstat
System Capacity Summary:
Memory used: 17% (4098 MB out of 24012 MB) - below watermark
Concurrent Connections: 11179 (Unlimited)
Aggressive Aging is enabled, not active
Hash kernel memory (hmem) statistics:
Total memory allocated: 4279132160 bytes in 1044710 (4096 bytes) blocks using 2 pools
Initial memory allocated: 2516582400 bytes (Hash memory extended by 1762549760 bytes)
Memory allocation limit: 20142096384 bytes using 512 pools
Total memory bytes used: 0 unused: 4279132160 (100.00%) peak: 3975273208
Total memory blocks used: 0 unused: 1044710 (100%) peak: 1024447
Allocations: 405809094 alloc, 0 failed alloc, 390362140 free
System kernel memory (smem) statistics:
Total memory bytes used: 5775472876 peak: 6295815528
Total memory bytes wasted: 44266902
Blocking memory bytes used: 34193880 peak: 39109936
Non-Blocking memory bytes used: 5741278996 peak: 6256705592
Allocations: 146815898 alloc, 0 failed alloc, 146791213 free, 0 failed free
vmalloc bytes used: 5706239208 expensive: no
Kernel memory (kmem) statistics:
Total memory bytes used: 2973191124 peak: 5738297476
Allocations: 552592884 alloc, 0 failed alloc
537127921 free, 0 failed free
External Allocations: 1991784 for packets, 30309726 for SXL
- Mark as New
- Bookmark
- Subscribe
- Mute
- Subscribe to RSS Feed
- Permalink
- Report Inappropriate Content
Hi,
its fine, don't worry. Most of your memory is cached and is ready to be used if needed. If you really have memory issues you should see high peak values in Advanced->memory->overview. Also when memory is fully consumed you should start getting failure to allocate messages in advanced->memory->smem-failures.
Check my screenshots in previous posts.
By the way, I heard that checkpoint has fixed some bad memory leaks in R80.30 JHF16x. We are running JHF155 and looking forward to JHF191, so hopefully we won't have those nasty issues anymore...
- Mark as New
- Bookmark
- Subscribe
- Mute
- Subscribe to RSS Feed
- Permalink
- Report Inappropriate Content
Thanks for the Reply,
I did check advanced->memory->smem-failures. but didn't see anything while there were complaints yesterday.Still don't see anything on that screen.
We have 2 clusters running r80.30 T155 and both are the same and was planning to do a new upgrade but bit curious to do it after this even though it may look normal.
Why is the cpview different , does cpview exclude the cashed memory as also snmp outputs on our monitoring tool is getting the data from the cpview as it doesn't alert us.
- Mark as New
- Bookmark
- Subscribe
- Mute
- Subscribe to RSS Feed
- Permalink
- Report Inappropriate Content
If there were complains, why would you think it was memory related?
You are running 32GB system and kmem peak was ~5GB. You had plenty of memory.
Memory is a complex thing having many parameters. You should compare apples to apples, so double-check what you were monitoring in your tool.
You are running 32GB system and kmem peak was ~5GB. You had plenty of memory.
Memory is a complex thing having many parameters. You should compare apples to apples, so double-check what you were monitoring in your tool.
- Mark as New
- Bookmark
- Subscribe
- Mute
- Subscribe to RSS Feed
- Permalink
- Report Inappropriate Content
People were complaining of connection issues which I believe it will be user connection problem but was curious when digging in.
One last thing, on the top command there is a swap output which looks it is being used different than the 'free -m' output. Is this normal?because I don't see this usage on the firewalls running R80.10.
- Mark as New
- Bookmark
- Subscribe
- Mute
- Subscribe to RSS Feed
- Permalink
- Report Inappropriate Content
Yes, I have it too on some gateways. Difference comes from here.
# cat /proc/meminfo |grep -i swap
SwapCached: 0 kB
SwapTotal: 18836204 kB
SwapFree: 18836072 kB
Mem: 16230576k total, 14246328k used, 1984248k free, 333276k buffers
Swap: 18836204k total, 132k used, 18836072k free, 5901604k cached
Maybe there is a way to find out which process allocated that swap space, but really you shouldn't worry about 200Kb.
- Mark as New
- Bookmark
- Subscribe
- Mute
- Subscribe to RSS Feed
- Permalink
- Report Inappropriate Content
You're correct , thanks for the replies.
I prefer checking the memory usage from the cpview values as our monitoring and also the Smart console dashboard is also showing these values.
I prefer checking the memory usage from the cpview values as our monitoring and also the Smart console dashboard is also showing these values.
- Mark as New
- Bookmark
- Subscribe
- Mute
- Subscribe to RSS Feed
- Permalink
- Report Inappropriate Content
Do you still have the problem ?
- Mark as New
- Bookmark
- Subscribe
- Mute
- Subscribe to RSS Feed
- Permalink
- Report Inappropriate Content
This was long time ago and don't have it anymore as we've moved on to newer versions.
- Mark as New
- Bookmark
- Subscribe
- Mute
- Subscribe to RSS Feed
- Permalink
- Report Inappropriate Content
memory problems are timeless and versionless 🙂
anyway this topic is one of the most easy to reach when you googling about memory on check point, so it could easy picks up a lot of information for a lot of people who needs help
- Mark as New
- Bookmark
- Subscribe
- Mute
- Subscribe to RSS Feed
- Permalink
- Report Inappropriate Content
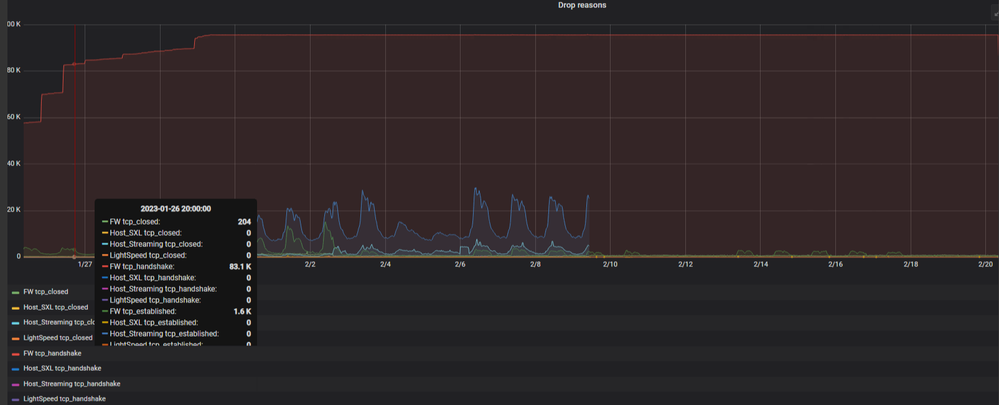
Hi all, anyone can help me to correctly verify if this behavoir is normal?
81.10 with JHF66, but same behavoir in other customer with most updated JHF
- Mark as New
- Bookmark
- Subscribe
- Mute
- Subscribe to RSS Feed
- Permalink
- Report Inappropriate Content
Provide output of free -m please.
New Book: "Max Power 2026" Coming Soon
Check Point Firewall Performance Optimization
Check Point Firewall Performance Optimization
- Mark as New
- Bookmark
- Subscribe
- Mute
- Subscribe to RSS Feed
- Permalink
- Report Inappropriate Content
free -mh
total used free shared buff/cache available
Mem: 30G 22G 580M 49M 7.8G 4.5G
Swap: 31G 1.2G 29G
free -mh from 2-3days ago, just few hours ago cutsomer moved VS to other member, sorry
- Mark as New
- Bookmark
- Subscribe
- Mute
- Subscribe to RSS Feed
- Permalink
- Report Inappropriate Content
I'd say it is normal if you have a large and busy firewall, yes. You have 4.5GB of RAM (available) that could be freed at a moment's notice out of your 32GB for code execution. You have dipped into swap space (1.2G) a bit probably during a policy installation, but when considered against 32GB of RAM it is not too bad. Might be interesting to run top and hit M to see what processes are using the most memory. If available memory (not free memory) is constantly dropping over time with no major changes that could indicate a memory leak.
New Book: "Max Power 2026" Coming Soon
Check Point Firewall Performance Optimization
Check Point Firewall Performance Optimization
- Mark as New
- Bookmark
- Subscribe
- Mute
- Subscribe to RSS Feed
- Permalink
- Report Inappropriate Content
Hello,
It is normal to see this result in the command "free -m".
I am referring to the value that appears in the "buff/cache" column.
Is there a way to free that value from that column?
I want to make sure, that I don't have problems with the memory of my GW.
Cheers.
- Mark as New
- Bookmark
- Subscribe
- Mute
- Subscribe to RSS Feed
- Permalink
- Report Inappropriate Content
buff/cache will be freed and reallocated at a moments notice to be "used" by the system if the "free" value drops too low. There is no way to clear buff/cache other than rebooting, but why would you want to? Memory that is otherwise sitting around doing absolutely nothing (free) is being temporarily used to cache operations to and from the hard drive (buff/cache), which is several orders of magnitude slower than cached access from RAM.
New Book: "Max Power 2026" Coming Soon
Check Point Firewall Performance Optimization
Check Point Firewall Performance Optimization
- Mark as New
- Bookmark
- Subscribe
- Mute
- Subscribe to RSS Feed
- Permalink
- Report Inappropriate Content
Hello,
The "Buff/cache" value, should not cause a "visual alert" of "high memory consumption" in the SmartConsole, right?
This value, that you just explained, is mostly a "reserve" of memory?
Cheers. 🙂
- Mark as New
- Bookmark
- Subscribe
- Mute
- Subscribe to RSS Feed
- Permalink
- Report Inappropriate Content
Correct, it is just memory being used to improve system performance. Some memory reporting/tools commands report the "free" amount as the total available (which is wrong) instead of "available" which is free + buff/cache and much more accurately reflects how much memory is available for the system.
New Book: "Max Power 2026" Coming Soon
Check Point Firewall Performance Optimization
Check Point Firewall Performance Optimization
- « Previous
-
- 1
- 2
- Next »
Leaderboard
Epsum factorial non deposit quid pro quo hic escorol.
| User | Count |
|---|---|
| 33 | |
| 20 | |
| 18 | |
| 12 | |
| 9 | |
| 9 | |
| 9 | |
| 7 | |
| 7 | |
| 6 |
Upcoming Events
Tue 17 Mar 2026 @ 03:00 PM (CET)
From SASE to Hybrid Mesh: Securing Enterprise AI at Scale - EMEATue 17 Mar 2026 @ 02:00 PM (EDT)
From SASE to Hybrid Mesh: Securing Enterprise AI at Scale - AMERWed 18 Mar 2026 @ 10:00 AM (CET)
The Cloud Architects Series: An introduction to Check Point Hybrid Mesh in 2026 - In Seven LanguagesThu 19 Mar 2026 @ 11:00 AM (EDT)
Tips and Tricks 2026 #2: AI Security Challenges and SolutionsTue 17 Mar 2026 @ 03:00 PM (CET)
From SASE to Hybrid Mesh: Securing Enterprise AI at Scale - EMEATue 17 Mar 2026 @ 02:00 PM (EDT)
From SASE to Hybrid Mesh: Securing Enterprise AI at Scale - AMERWed 18 Mar 2026 @ 10:00 AM (CET)
The Cloud Architects Series: An introduction to Check Point Hybrid Mesh in 2026 - In Seven LanguagesThu 19 Mar 2026 @ 11:00 AM (EDT)
Tips and Tricks 2026 #2: AI Security Challenges and SolutionsTue 24 Mar 2026 @ 04:00 PM (CET)
Maestro Masters EMEA: Hyperscale Firewall Architectures and OptimizationTue 24 Mar 2026 @ 06:00 PM (COT)
San Pedro Sula: Spark Firewall y AI-Powered Security ManagementThu 26 Mar 2026 @ 06:00 PM (COT)
Tegucigalpa: Spark Firewall y AI-Powered Security ManagementAbout CheckMates
Learn Check Point
Advanced Learning
YOU DESERVE THE BEST SECURITY
©1994-2026 Check Point Software Technologies Ltd. All rights reserved.
Copyright
Privacy Policy
About Us
UserCenter


