- Products
- Learn
- Local User Groups
- Partners
- More
This website uses Cookies. Click Accept to agree to our website's cookie use as described in our Privacy Policy. Click Preferences to customize your cookie settings.
- Products
- Learn
- Local User Groups
- Upcoming Events
- Americas
- EMEA
- Czech Republic and Slovakia
- Denmark
- Netherlands
- Germany
- Sweden
- United Kingdom and Ireland
- France
- Spain
- Norway
- Ukraine
- Baltics and Finland
- Greece
- Portugal
- Austria
- Kazakhstan and CIS
- Switzerland
- Romania
- Turkey
- Belarus
- Belgium & Luxembourg
- Russia
- Poland
- Georgia
- DACH - Germany, Austria and Switzerland
- Iberia
- Africa
- Adriatics Region
- Eastern Africa
- Israel
- Nordics
- Middle East and Africa
- Balkans
- Italy
- Bulgaria
- Cyprus
- APAC
- Partners
- More
- ABOUT CHECKMATES & FAQ
- Sign In
- Leaderboard
- Events
Call For Papers
Your Expertise, Our Stage
Ink Dragon: A Major Nation-State Campaign
Watch HereAI Security Masters E5:
Powering Prevention: The AI Driving Check Point’s ThreatCloud
The Great Exposure Reset
AI Security Masters E4:
Introducing Cyata, Securing the Agentic AI Era
CheckMates Go:
CheckMates Fest
Turn on suggestions
Auto-suggest helps you quickly narrow down your search results by suggesting possible matches as you type.
Showing results for
- CheckMates
- :
- Products
- :
- Hybrid Mesh
- :
- Firewall and Security Management
- :
- Re: High memory usage
Options
- Subscribe to RSS Feed
- Mark Topic as New
- Mark Topic as Read
- Float this Topic for Current User
- Bookmark
- Subscribe
- Mute
- Printer Friendly Page
Turn on suggestions
Auto-suggest helps you quickly narrow down your search results by suggesting possible matches as you type.
Showing results for
Are you a member of CheckMates?
×
Sign in with your Check Point UserCenter/PartnerMap account to access more great content and get a chance to win some Apple AirPods! If you don't have an account, create one now for free!
- Mark as New
- Bookmark
- Subscribe
- Mute
- Subscribe to RSS Feed
- Permalink
- Report Inappropriate Content
Jump to solution
High memory usage
Hello,
Wanted to share the issue we have with our gateway. We have following blades enabled:
fw urlf appi identityServer SSL_INSPECT content_awareness mon
Appliance is with 16gb, running latest R80.30.
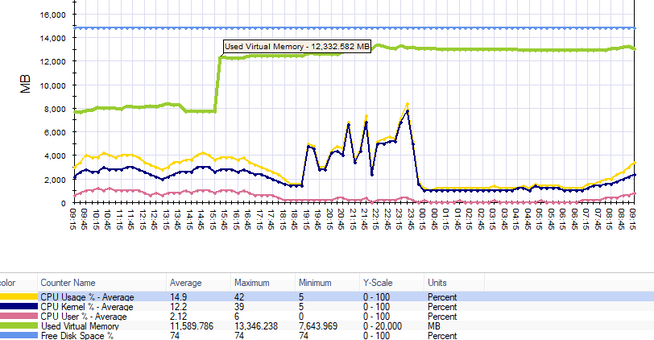
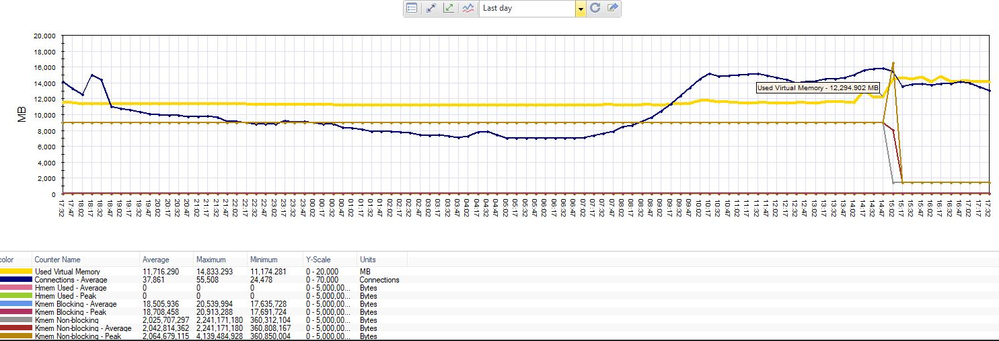
The problem we are having is that at some point memory usage increases sharply and it never comes down, unless we reboot appliance. This is causing issues to the traffic because some connections are getting disconnected during occurrence. I can't find in top (shift+m) any process which would contribute to this behaviour.
I hope I am not alone with this issue, so please give a shout if you have something similar. Some of the occurrences from the past to show what happens:
2 Solutions
Accepted Solutions
- Mark as New
- Bookmark
- Subscribe
- Mute
- Subscribe to RSS Feed
- Permalink
- Report Inappropriate Content
Can you please additionally provide the output of "show security-gateway memory statistics" ?
- Mark as New
- Bookmark
- Subscribe
- Mute
- Subscribe to RSS Feed
- Permalink
- Report Inappropriate Content
Correct, it is just memory being used to improve system performance. Some memory reporting/tools commands report the "free" amount as the total available (which is wrong) instead of "available" which is free + buff/cache and much more accurately reflects how much memory is available for the system.
New Book: "Max Power 2026" Coming Soon
Check Point Firewall Performance Optimization
Check Point Firewall Performance Optimization
53 Replies
- Mark as New
- Bookmark
- Subscribe
- Mute
- Subscribe to RSS Feed
- Permalink
- Report Inappropriate Content
Note that in general, it is not unusual for an appliance to be utilizing most of its physical memory.
You can also see that a lot of the memory used is actually kernel memory, so you won't necessarily see a process associated with it.
Can you describe in more detail about the connections that disconnect?
What kind of connections are they?
What behaviors do you observe?
What debugging have you done regarding these connections?
- Mark as New
- Bookmark
- Subscribe
- Mute
- Subscribe to RSS Feed
- Permalink
- Report Inappropriate Content
Hi,
As I understand disconnected connections are consequence of consumed memory. I couldn't find quickly SK number but it was explaining that GAIA protects itself and cuts some of the connections when such situation arises. Most noticeably some (not all) ssh connections to the servers gets disconnected.
What I observed as well, is when memory hits high consumption, accepted packets and number of connections drops unusually low. This might explain what I found in SK.
So far I did memory leak detection procedure, however this issue occurs once every 2-3 weeks. Memleak procedure says "memory leak plausible", but policy push was done, therefore result might be misleading. TAC wasn't impressed about memleak procedure output as well.
- Mark as New
- Bookmark
- Subscribe
- Mute
- Subscribe to RSS Feed
- Permalink
- Report Inappropriate Content
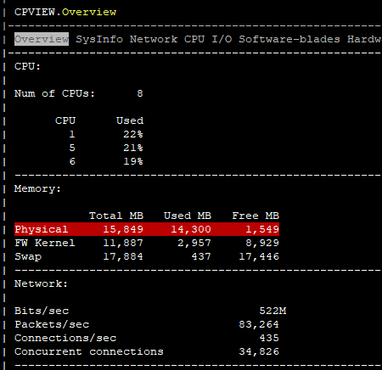
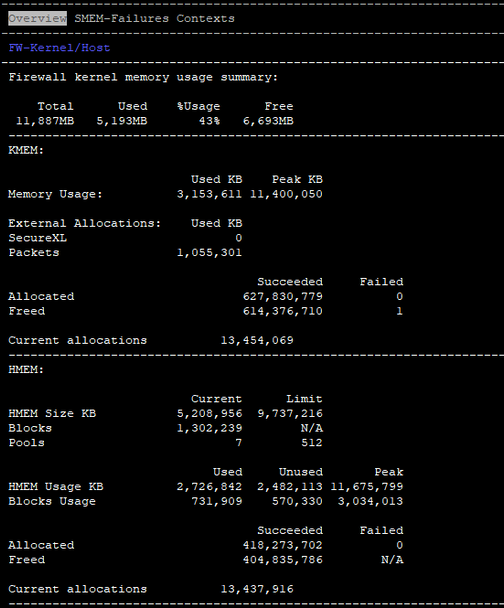
Please provide the output of free -m. As Dameon said it is not unusual for Gaia to allocate free memory for buffering and caching of disk operations on an ongoing basis which accounts for the increasing total utilization. The kernel says it has 8GB free memory in your cpview screenshot...
New Book: "Max Power 2026" Coming Soon
Check Point Firewall Performance Optimization
Check Point Firewall Performance Optimization
- Mark as New
- Bookmark
- Subscribe
- Mute
- Subscribe to RSS Feed
- Permalink
- Report Inappropriate Content
Screenshots I put are not from the very same occurrence. I just wanted to illustrate what is happening. You can see from free -m output that free memory comes to a very little number but cached remains the same.
Mon Sep 9 21:56:31 CEST 2019
total used free shared buffers cached
Mem: 15849 10360 5489 0 190 925
-/+ buffers/cache: 9243 6605
Swap: 17884 6 17878
Mon Sep 9 23:56:45 CEST 2019
total used free shared buffers cached
Mem: 15849 10350 5499 0 203 930
-/+ buffers/cache: 9216 6633
Swap: 17884 6 17878
Tue Sep 10 01:56:59 CEST 2019
total used free shared buffers cached
Mem: 15849 10350 5499 0 215 1017
-/+ buffers/cache: 9116 6733
Swap: 17884 6 17878
Tue Sep 10 03:57:13 CEST 2019
total used free shared buffers cached
Mem: 15849 10291 5557 0 225 1021
-/+ buffers/cache: 9044 6804
Swap: 17884 6 17878
Tue Sep 10 05:57:28 CEST 2019
total used free shared buffers cached
Mem: 15849 10342 5507 0 233 1033
-/+ buffers/cache: 9075 6774
Swap: 17884 6 17878
Tue Sep 10 07:57:42 CEST 2019
total used free shared buffers cached
Mem: 15849 10420 5429 0 240 1080
-/+ buffers/cache: 9098 6751
Swap: 17884 6 17878
Tue Sep 10 09:57:56 CEST 2019
total used free shared buffers cached
Mem: 15849 10663 5186 0 249 1099
-/+ buffers/cache: 9314 6535
Swap: 17884 6 17878
Tue Sep 10 11:58:11 CEST 2019
total used free shared buffers cached
Mem: 15849 15001 847 0 256 1131
-/+ buffers/cache: 13613 2236
Swap: 17884 6 17878
Tue Sep 10 13:58:25 CEST 2019
total used free shared buffers cached
Mem: 15849 15072 776 0 261 1158
-/+ buffers/cache: 13653 2196
Swap: 17884 6 17878
This is current situation on a gateway:
total used free shared buffers cached
Mem: 15849 14111 1738 0 423 3349
-/+ buffers/cache: 10337 5511
Swap: 17884 0 17884
As per my understanding we have 3,3GB cached and 1.7GB free which comes to a 5GB available for operating system.
- Mark as New
- Bookmark
- Subscribe
- Mute
- Subscribe to RSS Feed
- Permalink
- Report Inappropriate Content
Correct, looks like you have plenty of memory available to the OS (~5GB) and swap usage is negligible. When you reboot the buffer/cached values start small and grow as more than more accesses to the disk are performed. They will eventually top out at around 90% total memory used and not go beyond that point.
New Book: "Max Power 2026" Coming Soon
Check Point Firewall Performance Optimization
Check Point Firewall Performance Optimization
- Mark as New
- Bookmark
- Subscribe
- Mute
- Subscribe to RSS Feed
- Permalink
- Report Inappropriate Content
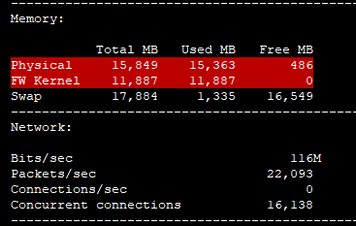
There is something wrong with the gateway and I can't figure out this... We had another occurrence again.
It was working just fine:
until few moments:
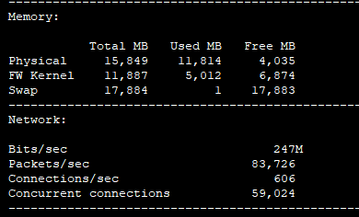
Please note FW kernel memory is fully used, operating system is using swap and connections/sec dropped to 0.
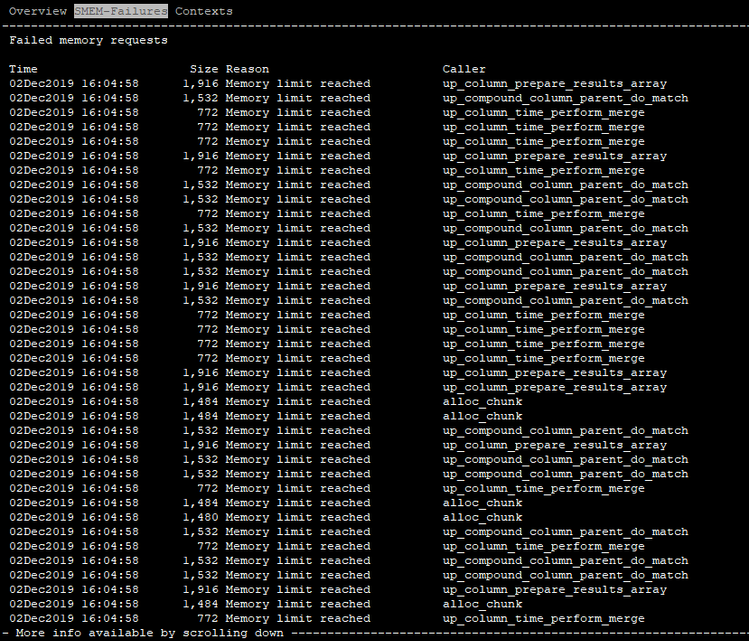
few more screenshots before the incident and after.
Is failed to allocate means it failed because there was no memory available, or it might suggest some hardware problems with memory itself?
Another screenshot might be interesting:
- Mark as New
- Bookmark
- Subscribe
- Mute
- Subscribe to RSS Feed
- Permalink
- Report Inappropriate Content
Hi @abihsot__
Did you involve TAC?
You must register memory leak detection in the fwkern.conf. This can R&D do for you.
Then you need to keep track on how to reproduce the problem.
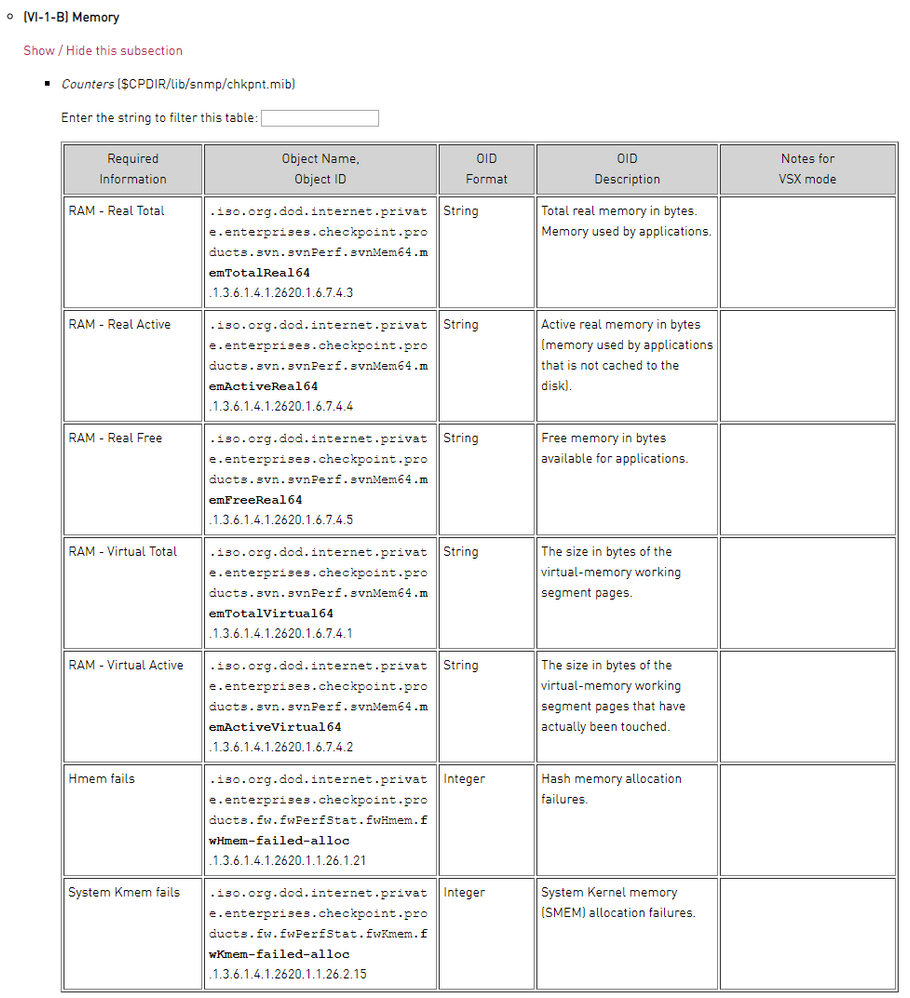
I have been using SNMPto keep track on memory states and CPU states which can be recommended.
You can find which OID SNMP tag information here in the sk90860.
https://supportcenter.checkpoint.com/supportcenter/portal?eventSubmit_doGoviewsolutiondetails=&solut...
I am using CLI command 'fw ctl pstat' to keep an eye of the memory usages in pct. Keep an eye so percentage isn't above 60%. At 80% usage Check Point services and processes being shutdown.
Best Regards
Kim
Kim
- Mark as New
- Bookmark
- Subscribe
- Mute
- Subscribe to RSS Feed
- Permalink
- Report Inappropriate Content
Hi Kim,
Yes, TAC was involved but they were useless. I reopened the ticket recently so hopefully will get better engineer this time.
As I mentioned before I did mem leak procedure (parameters in fwkern.conf you are referring), however output of it did not impressed TAC at all, hence no suggestions from them what could cause it...
The issue is so sudden that it might eat the rest of the memory instantly. Did you have memory issues in the past that you are monitoring it closely?
- Mark as New
- Bookmark
- Subscribe
- Mute
- Subscribe to RSS Feed
- Permalink
- Report Inappropriate Content
I have experienced this issue at some of the EA programs I have been participated in. First let me tell you this have been solved right away and I haven't had any issues afterwards.
We did enabled fwkern parametres for memory leak detection.
This needs to be enabled before you can keep track of which Check Point service or process that is consuming more memory without releasing usage.
I am using these SNMP OID tags to monitor the memory of my gateways.
Challange is that I cannot put it into pct.
Best Regards
Kim
Kim
- Mark as New
- Bookmark
- Subscribe
- Mute
- Subscribe to RSS Feed
- Permalink
- Report Inappropriate Content
Best Regards
Kim
Kim
- Mark as New
- Bookmark
- Subscribe
- Mute
- Subscribe to RSS Feed
- Permalink
- Report Inappropriate Content
Hade same issue on appliance box running VSX and HFA5X on R80.30
was not fixed by TAC so moved the VS to another VSX cluster running R80.10.
https://www.youtube.com/c/MagnusHolmberg-NetSec
- Mark as New
- Bookmark
- Subscribe
- Mute
- Subscribe to RSS Feed
- Permalink
- Report Inappropriate Content
Why does free -m, sort of contradict cpview and top?
- Mark as New
- Bookmark
- Subscribe
- Mute
- Subscribe to RSS Feed
- Permalink
- Report Inappropriate Content
Tools make different assumptions about what constitutes "free" memory in Gaia/Linux. Some of them show memory allocated for buffering/caching as "utilized" (same as usage for actual code execution), even though that memory could be freed at a moment's notice if needed for code execution. Other tools are aware of this fact and lump buffering/caching memory usage in with truly "free" memory that is not used at all.
New Book: "Max Power 2026" Coming Soon
Check Point Firewall Performance Optimization
Check Point Firewall Performance Optimization
- Mark as New
- Bookmark
- Subscribe
- Mute
- Subscribe to RSS Feed
- Permalink
- Report Inappropriate Content
Any luck getting this resolved? We have a similar issue with one of our 5400's and are getting nowhere with support.
- Mark as New
- Bookmark
- Subscribe
- Mute
- Subscribe to RSS Feed
- Permalink
- Report Inappropriate Content
Nop, still there. R80.30 JHF111. Got some more fwkern parameters to put in and waiting for the issue to happen again. TAC however is very itchy to close the case quickly 😞
By the way, I am seeing SMEM failures during out of memory events came from dlpk_cmi_internal_buf_init. What is this caller? We don't have DLP blade enabled...
#enabled_blades
fw urlf appi identityServer SSL_INSPECT content_awareness mon
- Mark as New
- Bookmark
- Subscribe
- Mute
- Subscribe to RSS Feed
- Permalink
- Report Inappropriate Content
So it looks like excessive memory use in kernel space which could be some kind of leak. To help isolate try this:
1) Uncheck the "Monitoring" checkbox on the firewall and reinstall policy. You will lose some of the advanced SmartView monitor reports but the "mon" blade will be disabled and if the problem will not recur that is the cause of the problem. If the problem still happens...
2) Enable Monitoring & disable Content Awareness next.
I'm guessing the memory leak is probably in one of these particular features.
New Book: "Max Power 2026" Coming Soon
Check Point Firewall Performance Optimization
Check Point Firewall Performance Optimization
- Mark as New
- Bookmark
- Subscribe
- Mute
- Subscribe to RSS Feed
- Permalink
- Report Inappropriate Content
Hi,
Mon blade is not a big deal, however I can't disable other blades so easily. It is production gateway after all... I completely agree this is probably caused by appl/urlf, content inspection etc blades, but until you catch it by hand - no proof. We have other gateways (also R80.30) running fw + mon blades only and this issue is not present...
- Mark as New
- Bookmark
- Subscribe
- Mute
- Subscribe to RSS Feed
- Permalink
- Report Inappropriate Content
I don't know the code, so it's just speculation, Depending on implementation dlpk_cmi_internal_buf_init() might be triggered automatically when a packet traverses f2f (with content inspection enabled) or PXL path*.
Could be a race condition that causes the boxes to forget to free() afterwards for certain paket types. (like ciscos UDP destport:0 issue in IOS)
It would be nice if checkpoint would consider to give source access to certain 3rd parties, probably under NDA or some similar Agreement. At least to headers and debug symbols so that we can have a look with tools like valgrind or gdb. Would make many things way easier and allow much more precise problem descriptions. It would also protect TAC from many fuzzy/vague problem tickets which mostly end with first figuring out what the heck the customer really wants.
We faced memory issues with VSX deployments(currently in touch with TAC). These boxes don't run content inspection/ips blade(just fw blade). But the monitoring blade is also enabled, which seems to be a similarity to this problem here, but it could be just a coincidence and the issues are completey independent from each other.
*https://community.checkpoint.com/t5/General-Topics/R80-x-Security-Gateway-Architecture-Logical-Packe...
- Mark as New
- Bookmark
- Subscribe
- Mute
- Subscribe to RSS Feed
- Permalink
- Report Inappropriate Content
Any update on this. We are experiencing something similar. Has been going on since last year.
- Mark as New
- Bookmark
- Subscribe
- Mute
- Subscribe to RSS Feed
- Permalink
- Report Inappropriate Content
So far nothing on my end. Thankfully CP reached out from this forum and they've been working on it, but nothing has resolved or lessened the occurrences. We've tried a few hotfixes and have gotten on a remote session after most of the occurrences but no one has been able to pinpoint the problem. I did also try Tim's suggestion of turning the Monitoring and Content Awareness blades but that did not resolve the issue either.
- Mark as New
- Bookmark
- Subscribe
- Mute
- Subscribe to RSS Feed
- Permalink
- Report Inappropriate Content
Sort of the same situation here with our open server cluster. We have tried several hotfixes but no one has been able to solve the problem and its been going on since we migrated from R77.30 to R80.30 end of last year. I cant imagine having this issue without a cluster.
- Mark as New
- Bookmark
- Subscribe
- Mute
- Subscribe to RSS Feed
- Permalink
- Report Inappropriate Content
As far as I observed, gateway temporary allocates huge amount of RAM and then releases it. I would say it is not usual memory leak where all memory is eaten and keeps being in this state until reboot. So if you have enough RAM buffer to soak those temporary increases I think you are kind of OK for some time even without cluster. In fact seeing how things roll out with TAC we paid the price and ordered additional memory for appliances, although we didn't actually need it. I hope it is not some strange way for boosting ram sales 😄 hehe
- Mark as New
- Bookmark
- Subscribe
- Mute
- Subscribe to RSS Feed
- Permalink
- Report Inappropriate Content
With ours it consumes the RAM until the gateway crashes. TAC has identified a Kernel table that seems to be consuming all of the RAM but they haven't identified why this is happening. Our Sys admin keeps asking us to just purchase an addition 64GB of RAM in the meantime lol. At least we are on open server so we don't have to pay the CP premium on RAM.
- Mark as New
- Bookmark
- Subscribe
- Mute
- Subscribe to RSS Feed
- Permalink
- Report Inappropriate Content
Lowering ws_max_sessions_per_conn to 200 for testing seems to have stopped the fwkernal memory from depleting. We started as 100, then moved to 200. Now we have it set to 400 to see what happens. It seems like this as well as ws_max_timestamped_sessions_per_conn was increased in R80.30+.
The default for these parameters is:
- ws_max_sessions_per_conn: 200 prior to R80.30, 400 in R80.30+
- ws_max_timestamped_sessions_per_conn: 50 prior to R80.30, 100 in R80.30+
- Mark as New
- Bookmark
- Subscribe
- Mute
- Subscribe to RSS Feed
- Permalink
- Report Inappropriate Content
Hello Guys? Any solution to this?
High memory problem seem to be with every device.
A client of ours have 5200 with 8 GB. Almost all time 85%+.
Top says some java using constantly 16,6 but still nothing? Any ideas?
High memory problem seem to be with every device.
A client of ours have 5200 with 8 GB. Almost all time 85%+.
Top says some java using constantly 16,6 but still nothing? Any ideas?
- Mark as New
- Bookmark
- Subscribe
- Mute
- Subscribe to RSS Feed
- Permalink
- Report Inappropriate Content
I am running r80.40 and I havent had any memory leak issues anylonger.
if you can try to upgrade to r80.30 with latest GA take. I believe it is much more stable in regards to memory leak.
r80.30 are also now recommended version.
Best Regards
Kim
Kim
- Mark as New
- Bookmark
- Subscribe
- Mute
- Subscribe to RSS Feed
- Permalink
- Report Inappropriate Content
free -m output please, extra memory is used for buffering/caching that will show as utilized but can be freed for code execution if needed.
New Book: "Max Power 2026" Coming Soon
Check Point Firewall Performance Optimization
Check Point Firewall Performance Optimization
- Mark as New
- Bookmark
- Subscribe
- Mute
- Subscribe to RSS Feed
- Permalink
- Report Inappropriate Content
Take a look. Most of it buffered.
- Mark as New
- Bookmark
- Subscribe
- Mute
- Subscribe to RSS Feed
- Permalink
- Report Inappropriate Content
Can you please additionally provide the output of "show security-gateway memory statistics" ?
Leaderboard
Epsum factorial non deposit quid pro quo hic escorol.
| User | Count |
|---|---|
| 35 | |
| 22 | |
| 17 | |
| 12 | |
| 9 | |
| 9 | |
| 8 | |
| 8 | |
| 8 | |
| 7 |
Upcoming Events
Tue 17 Mar 2026 @ 03:00 PM (CET)
From SASE to Hybrid Mesh: Securing Enterprise AI at Scale - EMEATue 17 Mar 2026 @ 02:00 PM (EDT)
From SASE to Hybrid Mesh: Securing Enterprise AI at Scale - AMERWed 18 Mar 2026 @ 10:00 AM (CET)
The Cloud Architects Series: An introduction to Check Point Hybrid Mesh in 2026 - In Seven LanguagesThu 19 Mar 2026 @ 11:00 AM (EDT)
Tips and Tricks 2026 #2: AI Security Challenges and SolutionsTue 17 Mar 2026 @ 03:00 PM (CET)
From SASE to Hybrid Mesh: Securing Enterprise AI at Scale - EMEATue 17 Mar 2026 @ 02:00 PM (EDT)
From SASE to Hybrid Mesh: Securing Enterprise AI at Scale - AMERWed 18 Mar 2026 @ 10:00 AM (CET)
The Cloud Architects Series: An introduction to Check Point Hybrid Mesh in 2026 - In Seven LanguagesThu 19 Mar 2026 @ 11:00 AM (EDT)
Tips and Tricks 2026 #2: AI Security Challenges and SolutionsTue 24 Mar 2026 @ 04:00 PM (CET)
Maestro Masters EMEA: Hyperscale Firewall Architectures and OptimizationTue 24 Mar 2026 @ 06:00 PM (COT)
San Pedro Sula: Spark Firewall y AI-Powered Security ManagementThu 26 Mar 2026 @ 06:00 PM (COT)
Tegucigalpa: Spark Firewall y AI-Powered Security ManagementAbout CheckMates
Learn Check Point
Advanced Learning
YOU DESERVE THE BEST SECURITY
©1994-2026 Check Point Software Technologies Ltd. All rights reserved.
Copyright
Privacy Policy
About Us
UserCenter


