- Products
Network & SASE IoT Protect Maestro Management OpenTelemetry/Skyline Remote Access VPN SASE SD-WAN Security Gateways SmartMove Smart-1 Cloud SMB Gateways (Spark) Threat PreventionCloud Cloud Network Security CloudMates General CloudGuard - WAF Talking Cloud Podcast Weekly ReportsSecurity Operations Events External Risk Management Incident Response Infinity AI Infinity Portal NDR Playblocks SOC XDR/XPR Threat Exposure Management
- Learn
- Local User Groups
- Partners
- More
This website uses Cookies. Click Accept to agree to our website's cookie use as described in our Privacy Policy. Click Preferences to customize your cookie settings.
- Products
- AI Security
- Developers & More
- Check Point Trivia
- CheckMates Toolbox
- General Topics
- Products Announcements
- Threat Prevention Blog
- Upcoming Events
- Americas
- EMEA
- Czech Republic and Slovakia
- Denmark
- Netherlands
- Germany
- Sweden
- United Kingdom and Ireland
- France
- Spain
- Norway
- Ukraine
- Baltics and Finland
- Greece
- Portugal
- Austria
- Kazakhstan and CIS
- Switzerland
- Romania
- Turkey
- Belarus
- Belgium & Luxembourg
- Russia
- Poland
- Georgia
- DACH - Germany, Austria and Switzerland
- Iberia
- Africa
- Adriatics Region
- Eastern Africa
- Israel
- Nordics
- Middle East and Africa
- Balkans
- Italy
- Bulgaria
- Cyprus
- APAC
CheckMates Fest 2026
Join the Celebration!
AI Security Masters
E1: How AI is Reshaping Our World
MVP 2026: Submissions
Are Now Open!
What's New in R82.10?
Watch NowOverlap in Security Validation
Help us to understand your needs better
CheckMates Go:
R82.10 and Rationalizing Multi Vendor Security Policies
Turn on suggestions
Auto-suggest helps you quickly narrow down your search results by suggesting possible matches as you type.
Showing results for
- CheckMates
- :
- Products
- :
- Network & SASE
- :
- Security Gateways
- :
- Re: Gateway Firewall running above 90% Memory usag...
Options
- Subscribe to RSS Feed
- Mark Topic as New
- Mark Topic as Read
- Float this Topic for Current User
- Bookmark
- Subscribe
- Mute
- Printer Friendly Page
Turn on suggestions
Auto-suggest helps you quickly narrow down your search results by suggesting possible matches as you type.
Showing results for
Are you a member of CheckMates?
×
Sign in with your Check Point UserCenter/PartnerMap account to access more great content and get a chance to win some Apple AirPods! If you don't have an account, create one now for free!
- Mark as New
- Bookmark
- Subscribe
- Mute
- Subscribe to RSS Feed
- Permalink
- Report Inappropriate Content
Jump to solution
Gateway Firewall running above 90% Memory usage
A firewall has report this : InsufficientFreeMemory for MEM-FWNAME/cptReal .CHecking the memory in Smartconsole, its showing at 90%. Appliance has 16GB Physical memory. Is there anything I can check to find what could be causing the high memory or whether there is any underlying issue that may need to be looked at further.
Here are the output of some memory commands.
# free -k -t
total used free shared buffers cached
Mem: 16230208 15603000 627208 0 42508 917476
-/+ buffers/cache: 14643016 1587192
Swap: 18314092 4125700 14188392
Total: 34544300 19728700 14815600
cpstat -f memory os
Total Virtual Memory (Bytes): 35373363200
Active Virtual Memory (Bytes): 19230703616
Total Real Memory (Bytes): 16619732992
Active Real Memory (Bytes): 15005986816
Free Real Memory (Bytes): 1613746176
Memory Swaps/Sec: -
Memory To Disk Transfers/Sec: -
fw ctl pstat -l
System Capacity Summary:
Memory used: 18% (2238 MB out of 11887 MB) - below watermark
Concurrent Connections: 16283 (Unlimited)
Aggressive Aging is enabled, not active
Hash kernel memory (hmem) statistics:
Total memory allocated: 5797662720 bytes in 1415445 (4096 bytes) blocks using 8 pools
Initial memory allocated: 1245708288 bytes (Hash memory extended by 4551954432 bytes)
Memory allocation limit: 9970909184 bytes using 512 pools
Total memory bytes used: 0 unused: 5797662720 (100.00%) peak: 5232509928
Total memory blocks used: 0 unused: 1415445 (100%) peak: 1338812
Allocations: 1301552249 alloc, 0 failed alloc, 1296247624 free
System kernel memory (smem) statistics:
Total memory bytes used: 6851995868 peak: 7154380368
Total memory bytes wasted: 22094971
Blocking memory bytes used: 16710568 peak: 50274096
Non-Blocking memory bytes used: 6835285300 peak: 7104106272
Allocations: 95317492 alloc, 0 failed alloc, 95305611 free, 0 failed free
vmalloc bytes used: 6820386640 expensive: no
Kernel memory (kmem) statistics:
Total memory bytes used: 1568795724 peak: 6159396172
Allocations: 1396849406 alloc, 0 failed alloc
1391535850 free, 0 failed free
External Allocations:
Packets:19424032, SXL:18932066, Reorder:0
Zeco:0, SHMEM:2176, Resctrl:0
ADPDRV:0, PPK_CI:5955472, PPK_CORR:0
Cookies:
1632233595 total, 2118456493 alloc, 2118449113 free,
2750934255 dup, 3117114265 get, 4023527712 put,
2666672837 len, 1726834069 cached len, 0 chain alloc,
0 chain free
Connections:
-1859692772 total, 963434623 TCP, 1374420565 UDP, 96262960 ICMP,
1156376 other, 897846 anticipated, 154012 recovered, 16283 concurrent,
346877 peak concurrent
Fragments:
71549157 fragments, 11557623 packets, 175 expired, 0 short,
0 large, 4 duplicates, 0 failures
NAT:
-241800665/0 forw, -1380647734/0 bckw, -288777302 tcpudp,
365081724 icmp, 232142216-239798763 alloc
Sync: Run "cphaprob syncstat" for cluster sync statistics.
Handles:
table name "kbufs"
235045 handles, 107 pools, 265 maximum pool(s)
1128010098 allocated, 0 failed, 1127775053 freed
345 pool(s) allocated, 0 failed, 238 freed, 128 not preallocated
cat /proc/meminfo
MemTotal: 16230208 kB
RawMemTotal: 0 kB
MemFree: 631336 kB
Buffers: 43224 kB
Cached: 918028 kB
SwapCached: 2354224 kB
Active: 7524952 kB
Inactive: 589652 kB
HighTotal: 0 kB
HighFree: 0 kB
LowTotal: 16230208 kB
LowFree: 631336 kB
SwapTotal: 18314092 kB
SwapFree: 14188392 kB
Dirty: 155920 kB
Writeback: 0 kB
AnonPages: 7150356 kB
Mapped: 138736 kB
Slab: 332180 kB
PageTables: 25704 kB
NFS_Unstable: 0 kB
Bounce: 0 kB
CommitLimit: 26429196 kB
Committed_AS: 11078684 kB
VmallocTotal: 34359738367 kB
VmallocUsed: 7044388 kB
VmallocChunk: 34352245003 kB
HugePages_Total: 0
HugePages_Free: 0
HugePages_Rsvd: 0
Hugepagesize: 2048 kB
1 Solution
Accepted Solutions
- Mark as New
- Bookmark
- Subscribe
- Mute
- Subscribe to RSS Feed
- Permalink
- Report Inappropriate Content
Your issue is https inspection, 100%. wstlsd process is related to it...are you able to turn it off, push policy and test?
Best,
Andy
Andy
19 Replies
- Mark as New
- Bookmark
- Subscribe
- Mute
- Subscribe to RSS Feed
- Permalink
- Report Inappropriate Content
Need some basic information like version/JHF level as well as whether this is a standalone or management is distributed on a different appliance.
In general, high memory utilization is not unusual or a cause for concern unless you are observing other symptoms.
- Mark as New
- Bookmark
- Subscribe
- Mute
- Subscribe to RSS Feed
- Permalink
- Report Inappropriate Content
This is on a gateway cluster setup and showing on the Active gateway. Running R80.30 JHF take 237.
- Mark as New
- Bookmark
- Subscribe
- Mute
- Subscribe to RSS Feed
- Permalink
- Report Inappropriate Content
Which blades are enabled and what hardware/appliance is this?
For the sake of installing additional memory where warranted I'd rather you didn't compromise on security by having to disable blades/controls to save RAM.
CCSM R77/R80/ELITE
- Mark as New
- Bookmark
- Subscribe
- Mute
- Subscribe to RSS Feed
- Permalink
- Report Inappropriate Content
its a 5800 appliance . Firewall / S2S VPN / URL Filtering / Identity Awareness / Monitoring / IPS / Anti-Bot / Anti virus are the active blades
- Mark as New
- Bookmark
- Subscribe
- Mute
- Subscribe to RSS Feed
- Permalink
- Report Inappropriate Content
For awareness these are expandable to 32GB RAM where necessary (and subject to availability) with SKU: CPAC-RAM16GB-5000
CCSM R77/R80/ELITE
- Mark as New
- Bookmark
- Subscribe
- Mute
- Subscribe to RSS Feed
- Permalink
- Report Inappropriate Content
I agree with @Chris_Atkinson 100%. Its not a good idea to compromise security of your network just to have more RAM. Its probably better to open TAC case, work with them to figure out why this process is causing higher amount of memory. If you disable the ssl inspection and issue goes away, then you know for sure thats whats causing it. If its a cluster, try fail over to current standby cluster member and see if problem is still there. If it is, I strongly suggest debugging wstlsd process...thats approach I would personally take.
Best,
Andy
Andy
- Mark as New
- Bookmark
- Subscribe
- Mute
- Subscribe to RSS Feed
- Permalink
- Report Inappropriate Content
Maybe run ps -auxw command and see what process shows consuming high memory. Also, cpview is an excellent tool for issue like this.
Andy
Best,
Andy
Andy
- Mark as New
- Bookmark
- Subscribe
- Mute
- Subscribe to RSS Feed
- Permalink
- Report Inappropriate Content
ran ps -aux v and here are the ones with recorded percentages
PID TTY STAT TIME MAJFL TRS DRS RSS %MEM COMMAND
6814 ? SNl 0:06 3 15693 587646 17236 0.1 /opt/AutoUpdater/latest/bin/AutoUpdater
15202 ? Ss 48:08 179 432 44699 18764 0.1 /bin/confd
15207 ? Ss 390:57 4 39 256040 252128 1.5 /bin/monitord
15415 ? Ssl 189:21 81 23 267296 53120 0.3 /usr/sbin/snmpd -f -c /etc/snmp/userDefinedSettings.conf
15832 ? Ssl 689:53 1791 28 383499 93936 0.5 cpd
16020 ? Ssl 6495:08 2285 122 1264017 669816 4.1 fwd
21404 ? SL 76:15 90980 146 2426633 1875540 11.5 wstlsd 0 0
21406 ? SL 76:01 73685 146 2429285 1886168 11.6 wstlsd 0 2
21408 ? SL 76:19 87558 146 2430921 1878888 11.5 wstlsd 0 4
21424 ? Ss 754:32 141 59 91432 68420 0.4 wsdnsd
- Mark as New
- Bookmark
- Subscribe
- Mute
- Subscribe to RSS Feed
- Permalink
- Report Inappropriate Content
Your issue is https inspection, 100%. wstlsd process is related to it...are you able to turn it off, push policy and test?
Best,
Andy
Andy
- Mark as New
- Bookmark
- Subscribe
- Mute
- Subscribe to RSS Feed
- Permalink
- Report Inappropriate Content
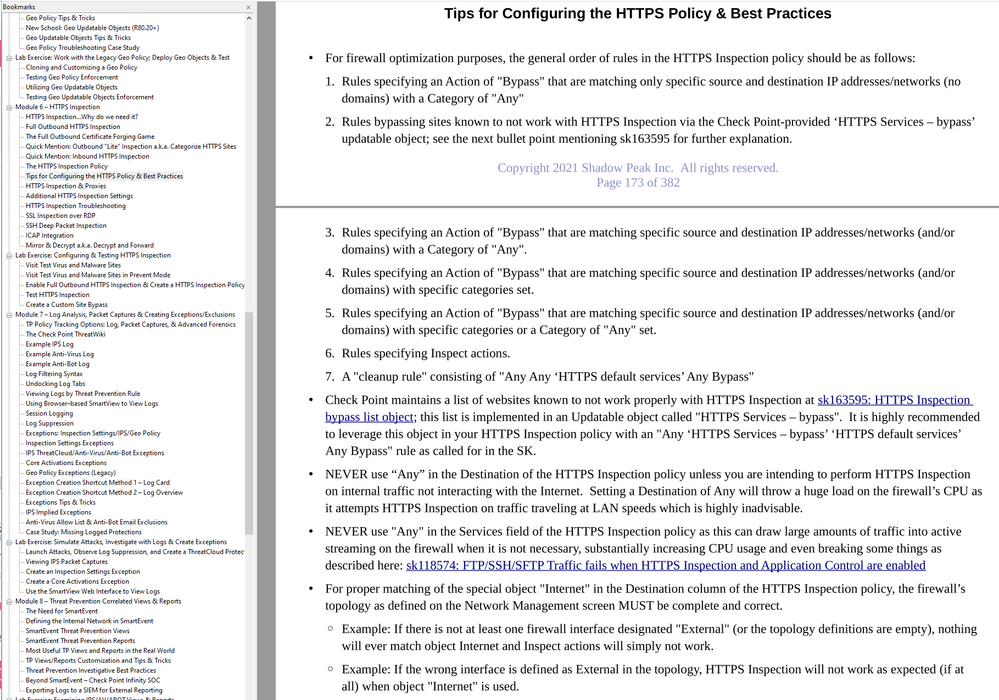
Good catch. A couple of tuning HTTPS inspection tuning tips (especially relevant if you also filter east-west traffic):
- Don't use "Any" in the destination of your inspection policy
- Don't use "Any" in the services field of your inspection policy
- Make sure you have a bypass "cleanup" rule
- Mark as New
- Bookmark
- Subscribe
- Mute
- Subscribe to RSS Feed
- Permalink
- Report Inappropriate Content
@Ruan_Kotze ...just my personal opinion, but it is based on many hours of troubleshooting https inspection with TAC on the phone (multiple T3 and escalation engineers). I never found the order of those inspection rules to make any difference and support agreed as well. We played around with it, moved the order of the rules multiple times, changed src/dst, and never noticed any difference at all. Again, just my own observation, cant speak for anyone else.
Best,
Andy
Andy
- Mark as New
- Bookmark
- Subscribe
- Mute
- Subscribe to RSS Feed
- Permalink
- Report Inappropriate Content
No doubt your mileage may vary, seems HTTPS inspection is a bit of a dark art, my notes have been gathered across a couple of TAC cases.
One thing, for example, that has made a measurable and reproducible difference in resource utilization for me on gateways (especially when you do east-west traffic at LAN speed as opposed to slower internet) is using the "any" field for your services - I'm guessing traffic unnecessarily gets pulled into active streaming.
- Mark as New
- Bookmark
- Subscribe
- Mute
- Subscribe to RSS Feed
- Permalink
- Report Inappropriate Content
I agree. I remember specifically talking to esc. guy in DTAC last year about this and he told me that he never seen the fact that bypass rule is at the bottom make any difference and we even tested it with a customer and result was exactly the same. When we discussed below link, there appeared to be lots of grey area...I wish it would specifically indicate what recommendation is, but sadly, it does not.
Best,
Andy
Andy
- Mark as New
- Bookmark
- Subscribe
- Mute
- Subscribe to RSS Feed
- Permalink
- Report Inappropriate Content
What kind of firewall hardware are you using, does it only have 4 cores? Looks like you might have a 1/3 split.
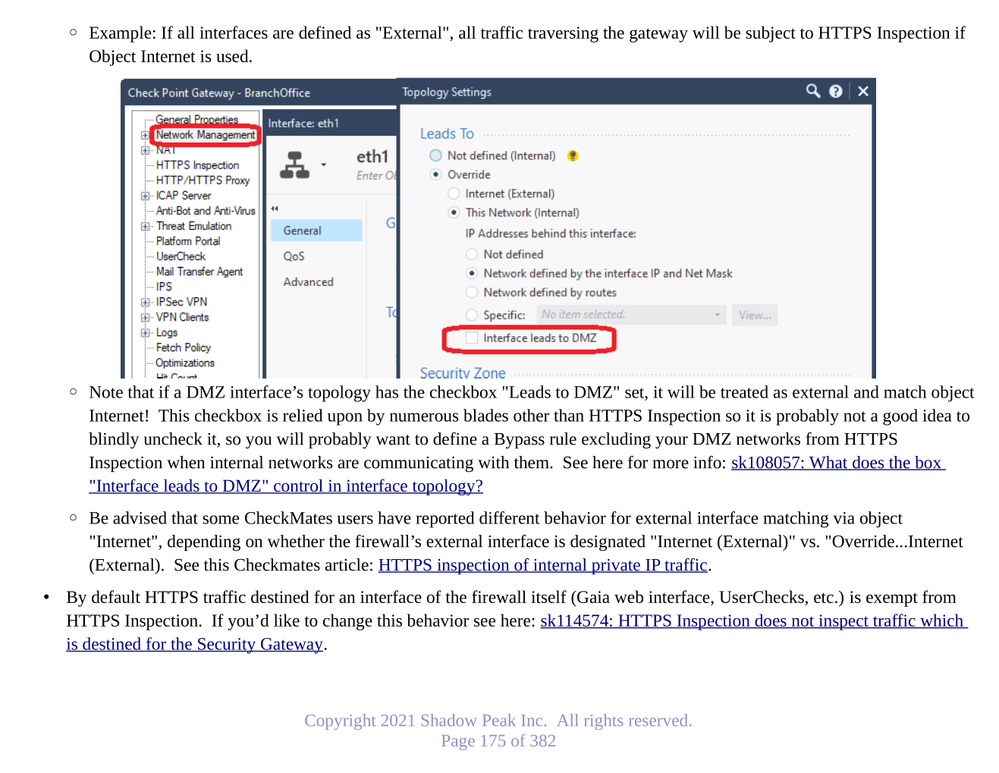
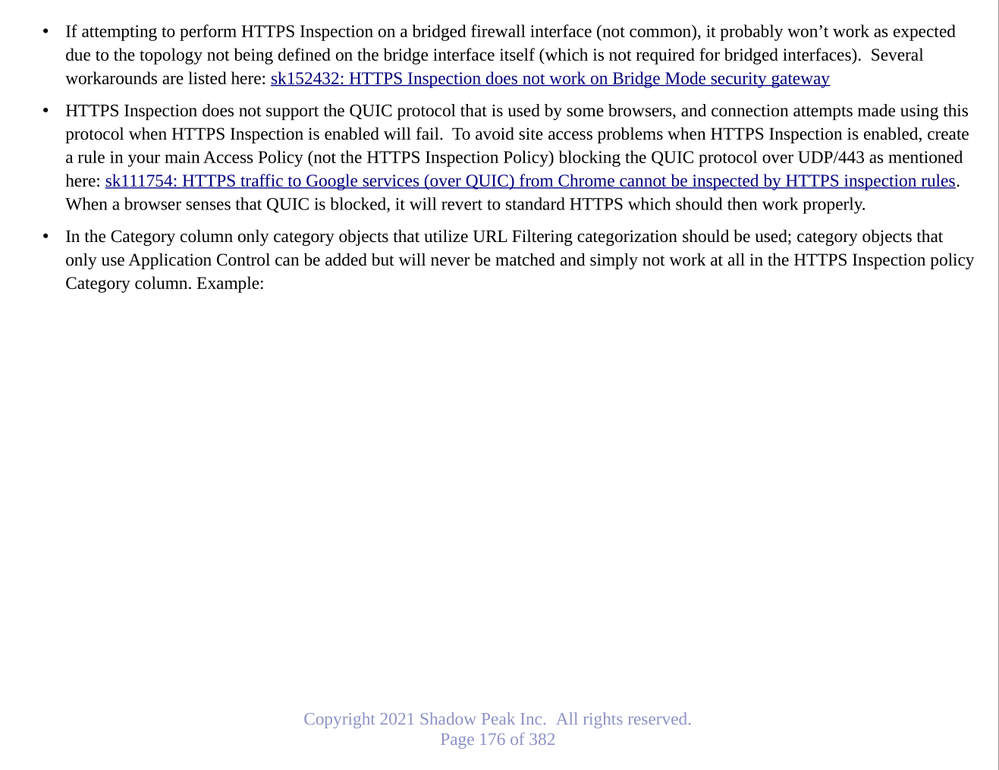
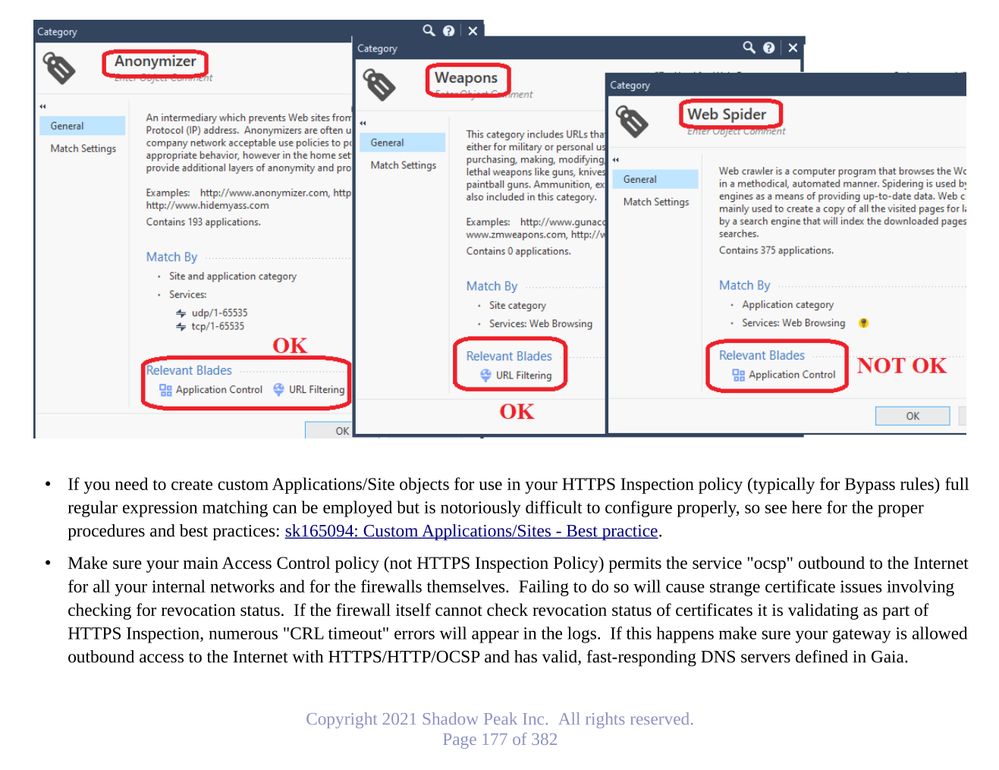
As some other posters mentioned this certainly looks like some HTTPS Inspection tuning is in order. Here is the relevant content from my 2021 IPS/AV/ABOT Immersion video series which covered this topic extensively and should be helpful:
Gaia 4.18 (R82) Immersion Tips, Tricks, & Best Practices Video Course
Now Available at https://shadowpeak.com/gaia4-18-immersion-course
Now Available at https://shadowpeak.com/gaia4-18-immersion-course
- Mark as New
- Bookmark
- Subscribe
- Mute
- Subscribe to RSS Feed
- Permalink
- Report Inappropriate Content
its a 5800 appliance with 8 Cores.
- Mark as New
- Bookmark
- Subscribe
- Mute
- Subscribe to RSS Feed
- Permalink
- Report Inappropriate Content
Hello
I had a problem of 'High memory consumption' of a 9700 appliance in R82 version with JHF 10.
The box exceeded 90% memory consumption and from one moment to the next it 'froze', because physically it appeared on but logically all management was lost.
The physical reboot has corrected this (at least for now).
Is there any way to detect or know what was the root-cause of the high memory consumption?
Thanks
- Mark as New
- Bookmark
- Subscribe
- Mute
- Subscribe to RSS Feed
- Permalink
- Report Inappropriate Content
thank you very much for all your responses. That provided me with items that I can look into and progress with this .
- Mark as New
- Bookmark
- Subscribe
- Mute
- Subscribe to RSS Feed
- Permalink
- Report Inappropriate Content
Glad we can help!
Best,
Andy
Andy
- Mark as New
- Bookmark
- Subscribe
- Mute
- Subscribe to RSS Feed
- Permalink
- Report Inappropriate Content
Sorry for resurrecting this thread:-)
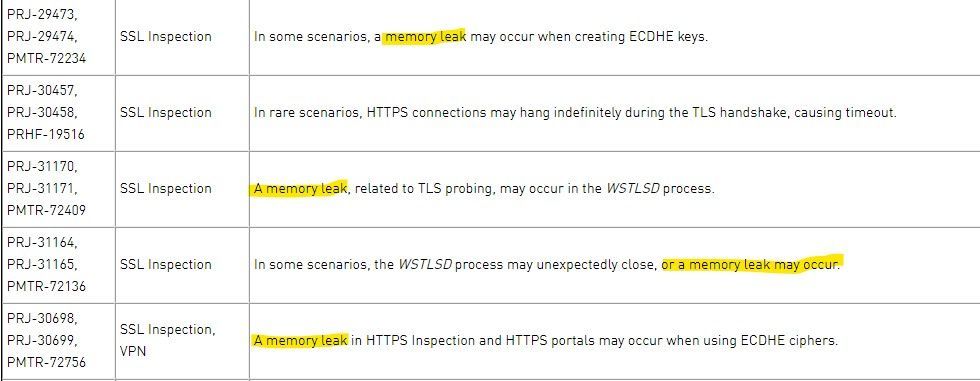
Just a quick note - went through the release notes of Take 246 (current GA for R80.30) to see if it addresses another issue I'm working and noticed it fixes four bugs related to memory leaks in SSL inspection. Since you mentioned you're running Take 237 it might be worthwhile to upgrade?
Leaderboard
Epsum factorial non deposit quid pro quo hic escorol.
| User | Count |
|---|---|
| 13 | |
| 11 | |
| 10 | |
| 8 | |
| 5 | |
| 4 | |
| 4 | |
| 4 | |
| 4 | |
| 3 |
Upcoming Events
Fri 09 Jan 2026 @ 10:00 AM (CET)
CheckMates Live Netherlands - Sessie 42: Looking back & forwardThu 22 Jan 2026 @ 05:00 PM (CET)
AI Security Masters Session 2: Hacking with AI: The Dark Side of InnovationTue 27 Jan 2026 @ 11:00 AM (EST)
CloudGuard Network Security for Red Hat OpenShift VirtualizationThu 12 Feb 2026 @ 05:00 PM (CET)
AI Security Masters Session 3: Exposing AI Vulnerabilities: CP<R> Latest Security FindingsFri 09 Jan 2026 @ 10:00 AM (CET)
CheckMates Live Netherlands - Sessie 42: Looking back & forwardThu 22 Jan 2026 @ 05:00 PM (CET)
AI Security Masters Session 2: Hacking with AI: The Dark Side of InnovationTue 27 Jan 2026 @ 11:00 AM (EST)
CloudGuard Network Security for Red Hat OpenShift VirtualizationThu 26 Feb 2026 @ 05:00 PM (CET)
AI Security Masters Session 4: Powering Prevention: The AI Driving Check Point’s ThreatCloudAbout CheckMates
Learn Check Point
Advanced Learning
YOU DESERVE THE BEST SECURITY
©1994-2026 Check Point Software Technologies Ltd. All rights reserved.
Copyright
Privacy Policy
About Us
UserCenter


