- Products
- Learn
- Local User Groups
- Partners
- More

This website uses Cookies. Click Accept to agree to our website's cookie use as described in our Privacy Policy. Click Preferences to customize your cookie settings.
- Products
- Learn
- Local User Groups
- Upcoming Events
- Americas
- EMEA
- Czech Republic and Slovakia
- Denmark
- Netherlands
- Germany
- Sweden
- United Kingdom and Ireland
- France
- Spain
- Norway
- Ukraine
- Baltics and Finland
- Greece
- Portugal
- Austria
- Kazakhstan and CIS
- Switzerland
- Romania
- Turkey
- Belarus
- Belgium & Luxembourg
- Russia
- Poland
- Georgia
- DACH - Germany, Austria and Switzerland
- Iberia
- Africa
- Adriatics Region
- Eastern Africa
- Israel
- Nordics
- Middle East and Africa
- Balkans
- Italy
- Bulgaria
- Cyprus
- APAC
- Partners
- More
- ABOUT CHECKMATES & FAQ
- Sign In
- Leaderboard
- Events
Call For Papers
Your Expertise, Our Stage
Ink Dragon: A Major Nation-State Campaign
March 11th @ 5pm CET / 12pm EDT
AI Security Masters E5:
Powering Prevention: The AI Driving Check Point’s ThreatCloud
The Great Exposure Reset
AI Security Masters E4:
Introducing Cyata, Securing the Agentic AI Era
CheckMates Go:
CheckMates Fest
Turn on suggestions
Auto-suggest helps you quickly narrow down your search results by suggesting possible matches as you type.
Showing results for
- CheckMates
- :
- Products
- :
- Hybrid Mesh
- :
- Firewall and Security Management
- :
- Re: Concurrent Connections - R80.40
Options
- Subscribe to RSS Feed
- Mark Topic as New
- Mark Topic as Read
- Float this Topic for Current User
- Bookmark
- Subscribe
- Mute
- Printer Friendly Page
Turn on suggestions
Auto-suggest helps you quickly narrow down your search results by suggesting possible matches as you type.
Showing results for
Are you a member of CheckMates?
×
Sign in with your Check Point UserCenter/PartnerMap account to access more great content and get a chance to win some Apple AirPods! If you don't have an account, create one now for free!
- Mark as New
- Bookmark
- Subscribe
- Mute
- Subscribe to RSS Feed
- Permalink
- Report Inappropriate Content
Jump to solution
Concurrent Connections - R80.40
Hi,
I have an appliance 15600 with Gaia R80.40 JHF 126. Everyday when the connections is above 80000 all traffic to internet stops unexpectedly. I don´t understand because the fw ctl pstat output show me that the connection doesn´t have limit.
System Capacity Summary:
Memory used: 16% (7758 MB out of 47763 MB) - below watermark
Concurrent Connections: 28844 (Unlimited)
Aggressive Aging is enabled, not active
I don´t have issues related with CPU, memory or disk and no nat fragmentation as well. I saw on Smartconsole that is possible to change the connection value limit but i believe isn´t necessary to change it.
Could you help with this issue?
1 Solution
Accepted Solutions
- Mark as New
- Bookmark
- Subscribe
- Mute
- Subscribe to RSS Feed
- Permalink
- Report Inappropriate Content
Hi guys,
I want to share the solution to this case. The solution was disabling the GNAT, according describe in this sk -https://supportcenter.checkpoint.com/supportcenter/portal?eventSubmit_doGoviewsolutiondetails=&solut...
After disabling GNAT the connections are stable even up 100k connections.
Thanks all feedbacks!
25 Replies
- Mark as New
- Bookmark
- Subscribe
- Mute
- Subscribe to RSS Feed
- Permalink
- Report Inappropriate Content
Check if you do not exhaust your NAT Hide ports yet.
- Mark as New
- Bookmark
- Subscribe
- Mute
- Subscribe to RSS Feed
- Permalink
- Report Inappropriate Content
Hello
I don't have this problem, I've searched Smartlog and cpview. All related questions are apparently normal.
- Mark as New
- Bookmark
- Subscribe
- Mute
- Subscribe to RSS Feed
- Permalink
- Report Inappropriate Content
What did you search it for, exaclty? Also, when issue happens, look at your NAT kernel tables to see if they are not maxed.
- Mark as New
- Bookmark
- Subscribe
- Mute
- Subscribe to RSS Feed
- Permalink
- Report Inappropriate Content
- Mark as New
- Bookmark
- Subscribe
- Mute
- Subscribe to RSS Feed
- Permalink
- Report Inappropriate Content
Best,
Andy
"Have a great day and if its not, change it"
Andy
"Have a great day and if its not, change it"
- Mark as New
- Bookmark
- Subscribe
- Mute
- Subscribe to RSS Feed
- Permalink
- Report Inappropriate Content
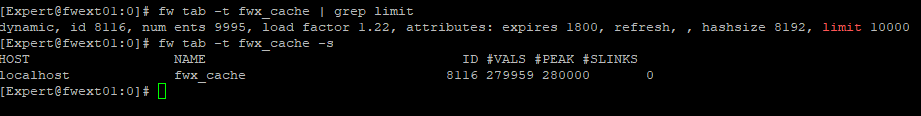
Limit 10000 but actual peak is 28000? Does not sound okay to me. Also, you are too close to that 28000, which might point in the right direction:

- Mark as New
- Bookmark
- Subscribe
- Mute
- Subscribe to RSS Feed
- Permalink
- Report Inappropriate Content
Hi,
I already asked it to TAC. According TAC i have 28 cpu core, so each core has a limit 10000, so i need to calculate 28x10000 = 280000.
I my opinion, this case i just loose the cache but the NAT still going to translate address normally.
- Mark as New
- Bookmark
- Subscribe
- Mute
- Subscribe to RSS Feed
- Permalink
- Report Inappropriate Content
First time ever I hear that sort of calculation...not really sure thats correct, maybe someone else can confirm.
Best,
Andy
"Have a great day and if its not, change it"
Andy
"Have a great day and if its not, change it"
- Mark as New
- Bookmark
- Subscribe
- Mute
- Subscribe to RSS Feed
- Permalink
- Report Inappropriate Content
Yes the_rock
TAC explained that to me during a chat. I´ll ask again.
Thanks for all feedback.
- Mark as New
- Bookmark
- Subscribe
- Mute
- Subscribe to RSS Feed
- Permalink
- Report Inappropriate Content
I will let others confirm, but I NEVER heard that before. I wish they gave you some document about it...not sure where that came from, honestly.
Best,
Andy
"Have a great day and if its not, change it"
Andy
"Have a great day and if its not, change it"
- Mark as New
- Bookmark
- Subscribe
- Mute
- Subscribe to RSS Feed
- Permalink
- Report Inappropriate Content
I'd like to see the SK or document where it explains that.
- Mark as New
- Bookmark
- Subscribe
- Mute
- Subscribe to RSS Feed
- Permalink
- Report Inappropriate Content
Hi,
I just have a response during exchange message on the case.
Hi Juarez,
" Appreciating your update, You can clear the table and check if that will resolve as a first step. The limit 10000 is per firewall worker so I am thinking there are 28 workers, each worked can have up to 10K entries in that table, so 28 X 10000 = 280000 so that is why you see it at 280K. When we increase the limit it will be by firewall worker."
*** Your service request is not monitored outside of assigned engineers working hours, should you require immediate assistance, please feel free to call in. ***
Regards
- Mark as New
- Bookmark
- Subscribe
- Mute
- Subscribe to RSS Feed
- Permalink
- Report Inappropriate Content
If you are able, a ticket with TAC will resolve the issue the quickest.
However some steps you can follow during the issue is to run the following in expert mode "fw ctl zdebug + drop" for a few seconds and see what error messages you get. TAC would request this information as well.
If you post it here someone will review but it needs to be during the issue.
- Mark as New
- Bookmark
- Subscribe
- Mute
- Subscribe to RSS Feed
- Permalink
- Report Inappropriate Content
Hi Glen,
I have ran "fw ctl zdebug + drop" but i didn´t get messages about drop...
So, i already open a case with TAC but no issues about NAT was asked me until this moment.
- Mark as New
- Bookmark
- Subscribe
- Mute
- Subscribe to RSS Feed
- Permalink
- Report Inappropriate Content
Can you please share the SR number with TAC so we can close the loop.
thanks
- Mark as New
- Bookmark
- Subscribe
- Mute
- Subscribe to RSS Feed
- Permalink
- Report Inappropriate Content
@_Val_ actually brought up a very good point. I recall there was an sk from while back about this, probably R77 and before and it involved modifying some stuff on mgmt server file. I will see if I can find it.
Best,
Andy
"Have a great day and if its not, change it"
Andy
"Have a great day and if its not, change it"
- Mark as New
- Bookmark
- Subscribe
- Mute
- Subscribe to RSS Feed
- Permalink
- Report Inappropriate Content
Hi,
I have found a SK that inform to modify the limit of connection -> /opt/CPsuite-R80.40/fw1/conf/objects_5_0.C
# :connections_limit (25000)
But when i run fw ctl pstat i have unlimited as below:
System Capacity Summary:
Memory used: 17% (8250 MB out of 47763 MB) - below watermark
Concurrent Connections: 50372 (Unlimited)
Aggressive Aging is enabled, not active
Hash kernel memory (hmem) statistics:
Total memory allocated: 8513806336 bytes in 2078566 (4096 bytes) blocks using 2 pools
Initial memory allocated: 5007998976 bytes (Hash memory extended by 3505807360 bytes)
Memory allocation limit: 40066088960 bytes using 512 pools
Total memory bytes used: 0 unused: 8513806336 (100.00%) peak: 6942913848
Total memory blocks used: 0 unused: 2078566 (100%) peak: 1812703
Allocations: 373539907 alloc, 0 failed alloc, 346496895 free
System kernel memory (smem) statistics:
Total memory bytes used: 11712721952 peak: 13962568616
Total memory bytes wasted: 123912475
Blocking memory bytes used: 119820396 peak: 815182716
Non-Blocking memory bytes used: 11592901556 peak: 13147385900
Allocations: 2250859302 alloc, 207 failed alloc, 2250776409 free, 0 failed free
vmalloc bytes used: 11447248008 expensive: no
Kernel memory (kmem) statistics:
Total memory bytes used: 6601477344 peak: 10154447436
Allocations: 2624246410 alloc, 207 failed alloc
2597134592 free, 0 failed free
External Allocations:
Packets:124969024, SXL:37052266, Reorder:0
Zeco:0, SHMEM:2176, Resctrl:0
ADPDRV:0, PPK_CI:13015296, PPK_CORR:0
Cookies:
1870268372 total, 809226293 alloc, 809155399 free,
3679877010 dup, 4020703328 get, 2165983218 put,
2327063251 len, 740443353 cached len, 26932 chain alloc,
26932 chain free
Connections:
540014320 total, 466588826 TCP, 71211150 UDP, 2203472 ICMP,
10872 other, 406247 anticipated, 1883050 recovered, 50372 concurrent,
124545 peak concurrent
Fragments:
92073 fragments, 44095 packets, 69 expired, 0 short,
0 large, 0 duplicates, 0 failures
NAT:
1779716794/0 forw, -431240825/0 bckw, 1135361697 tcpudp,
17091927 icmp, 1548710183-419225040 alloc
- Mark as New
- Bookmark
- Subscribe
- Mute
- Subscribe to RSS Feed
- Permalink
- Report Inappropriate Content
This is one of sk's I was thinking of...check bottom for R80.x mgmt server (or R81 if thats what you use for mgmt)
Best,
Andy
"Have a great day and if its not, change it"
Andy
"Have a great day and if its not, change it"
- Mark as New
- Bookmark
- Subscribe
- Mute
- Subscribe to RSS Feed
- Permalink
- Report Inappropriate Content
Hi the_rock
I've seen this sk, but my question is whether it's even necessary to adjust this parameter since the gateway has no connection limit according to fw ctl pstat output.
I have seen gateway with low capacity with no problem related nat or limits as well.
It´s very stranger to me.
- Mark as New
- Bookmark
- Subscribe
- Mute
- Subscribe to RSS Feed
- Permalink
- Report Inappropriate Content
@_Val_ is right, I just noticed the same thing actually. How come limit says 10000, but peak is 280000??!! That makes no sense...if you edit fw object in dashboard and go to optimization from left side menu, what do you have set there for capacity optimization?
Andy
Best,
Andy
"Have a great day and if its not, change it"
Andy
"Have a great day and if its not, change it"
- Mark as New
- Bookmark
- Subscribe
- Mute
- Subscribe to RSS Feed
- Permalink
- Report Inappropriate Content
Sorry to come in late on this thread, but the fwx_cache table is solely used to cache NAT rulebase hits and avoid as much as possible a full NAT rulebase lookup which can take substantial overhead. If the fwx_cache table is full (or close to being full) it should not cause NAT operations to break, other than causing higher CPU load on the workers. If the workers are already riding the edge as far as high CPU, the additional load caused by suddenly having to do far more resource-intensive NAT rulebase lookups may be causing the behavior you describe. In fact it is possible to completely disable the fwx_cache mechanism and NAT still works just fine although it consumes more CPU for NAT rule lookups. I uncovered most of this when researching the third edition of my book an excerpt of which is included below, and it took me awhile as there was not a lot of documentation about this mechanism available at the time.
The 10K cache entries per worker is documented, but only in my book. 😀
Bottom line is I don't think the fwx_cache table getting full or close to full is directly causing your problem; it lies elsewhere.


New Book: "Max Power 2026" Coming Soon
Check Point Firewall Performance Optimization
Check Point Firewall Performance Optimization
- Mark as New
- Bookmark
- Subscribe
- Mute
- Subscribe to RSS Feed
- Permalink
- Report Inappropriate Content
The old default used to be 25000 before it changed to automatic, so that parameter will be a legacy thing that is no used when automatic limit is enabled. You can safely ignore it if pstat is correctly showing automatic.
- Mark as New
- Bookmark
- Subscribe
- Mute
- Subscribe to RSS Feed
- Permalink
- Report Inappropriate Content
This is still very much a thing on VSX.
- Mark as New
- Bookmark
- Subscribe
- Mute
- Subscribe to RSS Feed
- Permalink
- Report Inappropriate Content
Hi guys,
I want to share the solution to this case. The solution was disabling the GNAT, according describe in this sk -https://supportcenter.checkpoint.com/supportcenter/portal?eventSubmit_doGoviewsolutiondetails=&solut...
After disabling GNAT the connections are stable even up 100k connections.
Thanks all feedbacks!
- Mark as New
- Bookmark
- Subscribe
- Mute
- Subscribe to RSS Feed
- Permalink
- Report Inappropriate Content
Thanks very much for sharing that...that sk is super useful!
Best,
Andy
"Have a great day and if its not, change it"
Andy
"Have a great day and if its not, change it"
Leaderboard
Epsum factorial non deposit quid pro quo hic escorol.
| User | Count |
|---|---|
| 38 | |
| 16 | |
| 15 | |
| 15 | |
| 12 | |
| 9 | |
| 7 | |
| 7 | |
| 6 | |
| 6 |
Upcoming Events
Fri 06 Mar 2026 @ 08:00 AM (COT)
Check Point R82 Hands‑On Bootcamp – Comunidad DOJO PanamáThu 12 Mar 2026 @ 05:00 PM (CET)
AI Security Masters Session 5: Powering Prevention: The AI Driving Check Point’s ThreatCloudThu 12 Mar 2026 @ 05:00 PM (CET)
AI Security Masters Session 5: Powering Prevention: The AI Driving Check Point’s ThreatCloudTue 17 Mar 2026 @ 10:00 AM (CET)
Industrial Cybersecurity in Practice: Manufacturing & Utilities - EMEATue 17 Mar 2026 @ 03:00 PM (CET)
From SASE to Hybrid Mesh: Securing Enterprise AI at Scale - EMEAFri 06 Mar 2026 @ 08:00 AM (COT)
Check Point R82 Hands‑On Bootcamp – Comunidad DOJO PanamáTue 24 Mar 2026 @ 06:00 PM (COT)
San Pedro Sula: Spark Firewall y AI-Powered Security ManagementAbout CheckMates
Learn Check Point
Advanced Learning
YOU DESERVE THE BEST SECURITY
©1994-2026 Check Point Software Technologies Ltd. All rights reserved.
Copyright
Privacy Policy
About Us
UserCenter