Create a Post
cancel
Showing results for 
Search instead for 
Did you mean: 
Herschel_Liang
Collaborator

Cluster failover suddenly at about 17:21 on Mar 4, 2021

FW-OA-A> ver
Product version Check Point Gaia R80.30
OS build 200
OS kernel version 2.6.18-92cpx86_64
OS edition 64-bit
FW-OA-A> cpinfo -y all

This is Check Point CPinfo Build 914000196 for GAIA
[IDA]
No hotfixes..

[MGMT]
HOTFIX_R80_30_JUMBO_HF_MAIN Take: 219

[CPFC]
HOTFIX_R80_30_JUMBO_HF_MAIN Take: 219

[FW1]
HOTFIX_MAAS_TUNNEL_AUTOUPDATE
HOTFIX_R80_30_JUMBO_HF_MAIN Take: 219

FW1 build number:
This is Check Point's software version R80.30 - Build 209
kernel: R80.30 - Build 216

[SecurePlatform]
HOTFIX_R80_30_JUMBO_HF_MAIN Take: 219

[PPACK]
HOTFIX_R80_30_JUMBO_HF_MAIN Take: 219

[CPinfo]
No hotfixes..

[DIAG]
No hotfixes..

[CVPN]
HOTFIX_R80_30_JUMBO_HF_MAIN Take: 219

[CPUpdates]
BUNDLE_HCP_AUTOUPDATE Take: 24
BUNDLE_INFRA_AUTOUPDATE Take: 39
BUNDLE_DEP_INSTALLER_AUTOUPDATE Take: 20
BUNDLE_MAAS_TUNNEL_AUTOUPDATE Take: 53
BUNDLE_R80_30_JUMBO_HF_MAIN Take: 219

[CPDepInst]
No hotfixes..

[AutoUpdater]
No hotfixes..

[hcp_wrapper]
HOTFIX_HCP_AUTOUPDATE

[Expert@FW-OA-A:0]# uname -a
Linux FW-OA-A 2.6.18-92cpx86_64 #1 SMP Tue Sep 8 20:04:48 IDT 2020 x86_64 x86_64 x86_64 GNU/Linux

A Message:

Mar 4 13:12:34 2021 FW-OA-A xpand[16114]: admin localhost t -volatile:configurationChange
Mar 4 13:12:35 2021 FW-OA-A xpand[16114]: admin localhost t -volatile:configurationSave
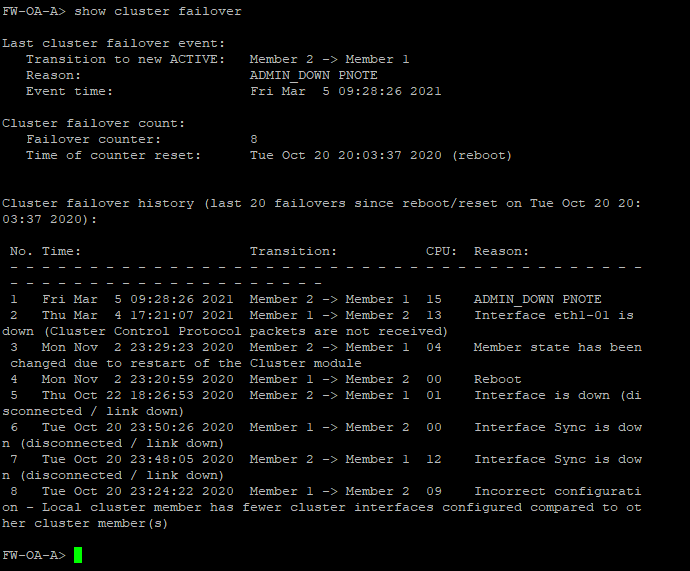
Mar 4 17:20:58 2021 FW-OA-A kernel: [fw4_1];CLUS-110305-1: State change: ACTIVE -> ACTIVE(!) | Reason: Interface eth1-01 is down (Cluster Control Protocol packets are not received)
Mar 4 17:20:59 2021 FW-OA-A kernel: [fw4_1];CLUS-114904-1: State change: ACTIVE(!) -> ACTIVE | Reason: Reason for ACTIVE! alert has been resolved
Mar 4 17:21:07 2021 FW-OA-A kernel: [fw4_1];CLUS-110305-1: State change: ACTIVE -> ACTIVE(!) | Reason: Interface eth1-01 is down (Cluster Control Protocol packets are not received)
Mar 4 17:21:07 2021 FW-OA-A kernel: [fw4_1];CLUS-110305-1: State change: ACTIVE! -> DOWN | Reason: Interface eth1-01 is down (Cluster Control Protocol packets are not received)
Mar 4 17:21:07 2021 FW-OA-A kernel: [fw4_1];CLUS-214704-1: Remote member 2 (state STANDBY -> ACTIVE) | Reason: No other ACTIVE members have been found in the cluster
Mar 4 17:21:07 2021 FW-OA-A kernel: [fw4_6];fwldbcast_handle_retrans_request: Updated bchosts_mask to 1
Mar 4 17:21:07 2021 FW-OA-A kernel: [fw4_1];CLUS-114802-1: State change: DOWN -> STANDBY | Reason: There is already an ACTIVE member in the cluster (member 2)
Mar 4 17:21:07 2021 FW-OA-A kernel: [fw4_1];CLUS-100102-1: Failover member 1 -> member 2 | Reason: Interface eth1-01 is down (Cluster Control Protocol packets are not received)
Mar 4 17:21:08 2021 FW-OA-A kernel: [fw4_7];fwldbcast_handle_retrans_request: Updated bchosts_mask to 1
Mar 4 17:21:08 2021 FW-OA-A kernel: [fw4_2];fwldbcast_handle_retrans_request: Updated bchosts_mask to 1
Mar 4 17:21:08 2021 FW-OA-A kernel: [fw4_9];fwldbcast_handle_retrans_request: Updated bchosts_mask to 1
Mar 4 17:21:08 2021 FW-OA-A kernel: [fw4_3];fwldbcast_handle_retrans_request: Updated bchosts_mask to 1
Mar 4 17:21:09 2021 FW-OA-A kernel: [fw4_1];fwldbcast_handle_retrans_request: Updated bchosts_mask to 1
Mar 4 17:21:09 2021 FW-OA-A kernel: [fw4_5];fwldbcast_handle_retrans_request: Updated bchosts_mask to 1
Mar 4 17:21:11 2021 FW-OA-A kernel: [fw4_0];fwldbcast_handle_retrans_request: Updated bchosts_mask to 1
Mar 4 17:21:14 2021 FW-OA-A kernel: [fw4_8];fwldbcast_handle_retrans_request: Updated bchosts_mask to 1
Mar 4 17:21:14 2021 FW-OA-A kernel: [fw4_4];fwldbcast_handle_retrans_request: Updated bchosts_mask to 1
Mar 4 19:12:23 2021 FW-OA-A xpand[16114]: admin localhost t +installer:check_for_updates_last_res Last check for update is running
Mar 4 19:12:23 2021 FW-OA-A xpand[16114]: Configuration changed from localhost by user admin by the service dbset
Mar 4 19:12:23 2021 FW-OA-A xpand[16114]: admin localhost t +installer:update_status -1

B message:

Mar 4 12:16:35 2021 FW-OA-B xpand[19429]: admin localhost t -volatile:configurationChange
Mar 4 12:16:36 2021 FW-OA-B xpand[19429]: admin localhost t -volatile:configurationSave
Mar 4 17:21:07 2021 FW-OA-B kernel: [fw4_1];CLUS-210300-2: Remote member 1 (state ACTIVE -> DOWN) | Reason: Interface is down (Cluster Control Protocol packets are not received)
Mar 4 17:21:07 2021 FW-OA-B kernel: [fw4_1];CLUS-114704-2: State change: STANDBY -> ACTIVE | Reason: No other ACTIVE members have been found in the cluster
Mar 4 17:21:07 2021 FW-OA-B kernel: [fw4_1];CLUS-100102-2: Failover member 1 -> member 2 | Reason: Available on member 1
Mar 4 17:21:07 2021 FW-OA-B kernel: [fw4_1];CLUS-214802-2: Remote member 1 (state DOWN -> STANDBY) | Reason: There is already an ACTIVE member in the cluster
Mar 4 18:16:28 2021 FW-OA-B xpand[19429]: admin localhost t +installer:check_for_updates_last_res Last check for update is running
Mar 4 18:16:28 2021 FW-OA-B xpand[19429]: Configuration changed from localhost by user admin by the service dbset
Mar 4 18:16:28 2021 FW-OA-B xpand[19429]: admin localhost t +installer:update_status -1
Mar 4 18:16:28 2021 FW-OA-B xpand[19429]: Configuration changed from localhost by user admin by the service dbset

[Expert@FW-OA-A:0]# netstat -ni
Kernel Interface table
Iface MTU Met RX-OK RX-ERR RX-DRP RX-OVR TX-OK TX-ERR TX-DRP TX-OVR Flg
Mgmt 1500 0 357107174 0 0 0 152432164 0 0 0 BMRU
Sync 1500 0 1140897383 0 0 0 1280037944 0 0 0 BMRU
eth1-01 1500 0 44660252890 0 0 0 73375428981 0 0 0 BMRU
eth1-02 1500 0 73378082535 0 0 0 44611246310 0 0 0 BMRU
lo 16436 0 2159425 0 0 0 2159425 0 0 0 LRU
[Expert@FW-OA-A:0]# cphaprob -a if

CCP mode: Automatic
Required interfaces: 4
Required secured interfaces: 1

Sync UP sync(secured), unicast
Mgmt UP non sync(non secured), unicast
eth1-01 UP non sync(non secured), unicast
eth1-02 UP non sync(non secured), unicast

Virtual cluster interfaces: 3

Mgmt 10.220.61.150 VMAC address: 00:1C:7F:00:0D:0C
eth1-01 172.20.251.4 VMAC address: 00:1C:7F:00:0D:0C
eth1-02 172.20.252.4 VMAC address: 00:1C:7F:00:0D:0C

[Expert@FW-OA-A:0]# cphaprob -l list

Built-in Devices:

Device Name: Interface Active Check
Current state: OK

Device Name: Recovery Delay
Current state: OK

Device Name: CoreXL Configuration
Current state: OK

Registered Devices:

Device Name: Fullsync
Registration number: 0
Timeout: none
Current state: OK
Time since last report: 3.83178e+06 sec

Device Name: Policy
Registration number: 1
Timeout: none
Current state: OK
Time since last report: 3.83178e+06 sec

Device Name: routed
Registration number: 2
Timeout: none
Current state: OK
Time since last report: 10701.3 sec

Device Name: fwd
Registration number: 3
Timeout: 30 sec
Current state: OK
Time since last report: 1.99742e+06 sec
Process Status: UP

Device Name: cphad
Registration number: 4
Timeout: 30 sec
Current state: OK
Time since last report: 1.99741e+06 sec
Process Status: UP

Device Name: Init
Registration number: 5
Timeout: none
Current state: OK
Time since last report: 1.9974e+06 sec

[Expert@FW-OA-A:0]#

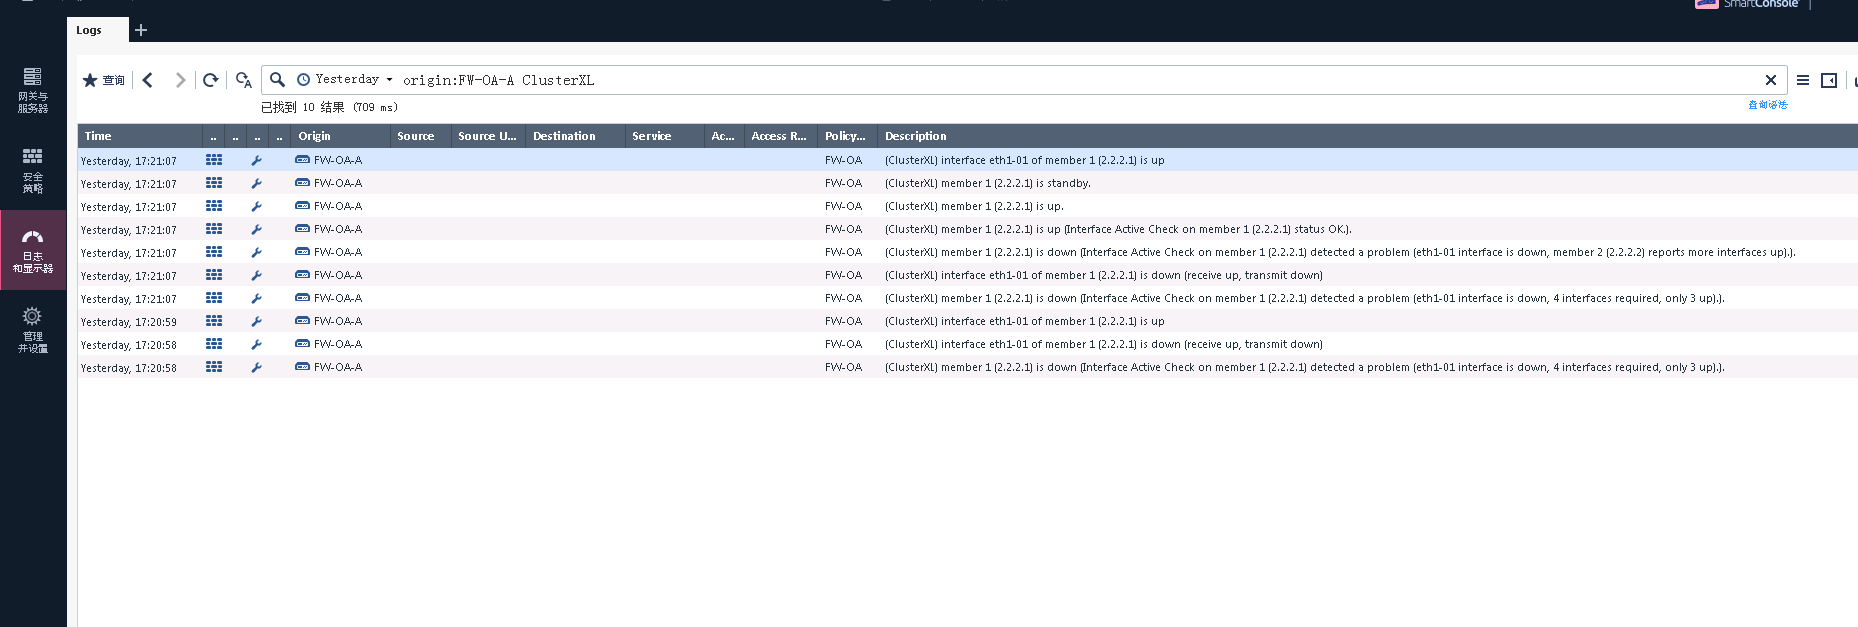
The client check switch direct interface is no any down records. Could you find the root cause of the failover issue?

0 Kudos
16 Replies
_Val_
Admin
Admin

What is your question? It seems you have a connectivity issue on one of the cluster members, eth1-01 is down

0 Kudos
Herschel_Liang
Collaborator

The client check switch direct interface is no any down records. So, th1-01 was not down at the time. I suspect it leads by CCP packet. But I don't know how to continue troubleshooting ......

0 Kudos
G_W_Albrecht
Legend
Legend

TAC should be able to help...

CCSE CCTE CCSM SMB Specialist
0 Kudos
Timothy_Hall
Champion
Champion

CCP packets were not getting handled properly by interface eth1-01.  It doesn't appear that the physical interface itself experienced a problem, but please provide the output of the expert mode commands ifconfig eth1-01 and ethtool -S eth1-01 to confirm.

Beyond that, did anything interesting get logged to any of these files around the time of the failover:

$FWDIR/log/fwd.elg
$FWDIR/log/cphaconf.elg
$FWDIR/log/cphamcset.elg

$FWDIR/log/cphastart.elg


Gateway Performance Optimization R81.20 Course
now available at maxpowerfirewalls.com
0 Kudos
Vladimir
Champion
Champion

Would clearing dynamic MAC tables or arp cache on a particular VLAN (on the switch side), accouint for this behavior?

0 Kudos
Timothy_Hall
Champion
Champion

If CCP is running in multicast mode that is possible yes, OP will need to provide output of cphaprob -a if to see current CCP operational mode.  Since they are on R80.30 kernel 2.6.18 I think the default mode is multicast.

If running in CCP unicast mode which is the default in R80.30+ kernel 3.10, clearing the cam table on the switch should not cause this effect.

Gateway Performance Optimization R81.20 Course
now available at maxpowerfirewalls.com
0 Kudos
Herschel_Liang
Collaborator

FW-OA-A> ver
Product version Check Point Gaia R80.30
OS build 200
OS kernel version 2.6.18-92cpx86_64
OS edition 64-bit

FW-OA-A> cphaprob -a if

CCP mode: Automatic
Required interfaces: 4
Required secured interfaces: 1

Sync UP sync(secured), unicast
Mgmt UP non sync(non secured), unicast
eth1-01 UP non sync(non secured), unicast
eth1-02 UP non sync(non secured), unicast

Virtual cluster interfaces: 3

Mgmt 10.220.61.150 VMAC address: 00:1C:7F:00:0D:0C
eth1-01 172.20.251.4 VMAC address: 00:1C:7F:00:0D:0C
eth1-02 172.20.252.4 VMAC address: 00:1C:7F:00:0D:0C

Gaia R80.30, kernel is v 2.6, CCP mode is auto, unicast. No change I made it.

0 Kudos
Timothy_Hall
Champion
Champion

One of your interfaces is trying to do flow control which is a little unusual (tx_flow_control_), but eth1-01 interfaces otherwise look fine.  Will need to look at the ClusterXL code with TAC.  Doubtful your switches caused the issue due to use of CCP unicast.

Gateway Performance Optimization R81.20 Course
now available at maxpowerfirewalls.com
0 Kudos
Vladimir
Champion
Champion

@Timothy_Hall Is there a way to see if CCP Auto had a mode change from multicast to unicast at the time when the issue was experienced?

@Herschel_Liang Can you get the logs from the switches around the time of the failover?


0 Kudos
Herschel_Liang
Collaborator

[Expert@FW-OA-A:0]# ifconfig eth1-01
eth1-01 Link encap:Ethernet HWaddr 00:1C:7F:39:B7:B6
inet addr:172.20.251.5 Bcast:172.20.251.255 Mask:255.255.255.0
UP BROADCAST RUNNING MULTICAST MTU:1500 Metric:1
RX packets:45144466983 errors:0 dropped:0 overruns:0 frame:0
TX packets:74032728874 errors:0 dropped:0 overruns:0 carrier:0
collisions:0 txqueuelen:1000
RX bytes:14826245966076 (13.4 TiB) TX bytes:83900021916308 (76.3 Ti B)

[Expert@FW-OA-A:0]# ethtool -S eth1-01
NIC statistics:
rx_packets: 45144519946
tx_packets: 74032791767
rx_bytes: 15006837365470
tx_bytes: 84229989617406
rx_broadcast: 1024
tx_broadcast: 176940
rx_multicast: 13792651
tx_multicast: 177857
multicast: 13792651
collisions: 0
rx_crc_errors: 0
rx_no_buffer_count: 74490
rx_missed_errors: 0
tx_aborted_errors: 0
tx_carrier_errors: 0
tx_window_errors: 0
tx_abort_late_coll: 0
tx_deferred_ok: 0
tx_single_coll_ok: 0
tx_multi_coll_ok: 0
tx_timeout_count: 0
rx_long_length_errors: 0
rx_short_length_errors: 0
rx_align_errors: 0
tx_tcp_seg_good: 0
tx_tcp_seg_failed: 0
rx_flow_control_xon: 0
rx_flow_control_xoff: 0
tx_flow_control_xon: 12259
tx_flow_control_xoff: 11988
rx_long_byte_count: 15006837365470
tx_dma_out_of_sync: 0
lro_aggregated: 0
lro_flushed: 0
lro_recycled: 0
tx_smbus: 0
rx_smbus: 0
dropped_smbus: 0
os2bmc_rx_by_bmc: 0
os2bmc_tx_by_bmc: 0
os2bmc_tx_by_host: 0
os2bmc_rx_by_host: 0
rx_errors: 0
tx_errors: 0
tx_dropped: 0
rx_length_errors: 0
rx_over_errors: 0
rx_frame_errors: 0
rx_fifo_errors: 0
tx_fifo_errors: 0
tx_heartbeat_errors: 0
tx_queue_0_packets: 74032791767
tx_queue_0_bytes: 83900074416860
tx_queue_0_restart: 0
rx_queue_0_packets: 45144519946
rx_queue_0_bytes: 14826259285686
rx_queue_0_drops: 0
rx_queue_0_csum_err: 769
rx_queue_0_alloc_failed: 0
[Expert@FW-OA-A:0]#

===================================================================================================================================

[Expert@FW-OA-B:0]# ifconfig eth1-01
eth1-01 Link encap:Ethernet HWaddr 00:1C:7F:39:B6:86
inet addr:172.20.251.6 Bcast:172.20.251.255 Mask:255.255.255.0
UP BROADCAST RUNNING MULTICAST MTU:1500 Metric:1
RX packets:181614294 errors:0 dropped:7 overruns:7 frame:0
TX packets:338841291 errors:0 dropped:0 overruns:0 carrier:0
collisions:0 txqueuelen:1000
RX bytes:39429454537 (36.7 GiB) TX bytes:273128443658 (254.3 GiB)

[Expert@FW-OA-B:0]# ethtool -S eth1-01
NIC statistics:
rx_packets: 181614339
tx_packets: 338843508
rx_bytes: 40155915629
tx_bytes: 274807812019
rx_broadcast: 176961
tx_broadcast: 1060
rx_multicast: 13793486
tx_multicast: 177878
multicast: 13793486
collisions: 0
rx_crc_errors: 0
rx_no_buffer_count: 26
rx_missed_errors: 7
tx_aborted_errors: 0
tx_carrier_errors: 0
tx_window_errors: 0
tx_abort_late_coll: 0
tx_deferred_ok: 0
tx_single_coll_ok: 0
tx_multi_coll_ok: 0
tx_timeout_count: 0
rx_long_length_errors: 0
rx_short_length_errors: 0
rx_align_errors: 0
tx_tcp_seg_good: 0
tx_tcp_seg_failed: 0
rx_flow_control_xon: 0
rx_flow_control_xoff: 0
tx_flow_control_xon: 0
tx_flow_control_xoff: 0
rx_long_byte_count: 40155915629
tx_dma_out_of_sync: 0
lro_aggregated: 0
lro_flushed: 0
lro_recycled: 0
tx_smbus: 0
rx_smbus: 0
dropped_smbus: 0
os2bmc_rx_by_bmc: 0
os2bmc_tx_by_bmc: 0
os2bmc_tx_by_host: 0
os2bmc_rx_by_host: 0
rx_errors: 0
tx_errors: 0
tx_dropped: 0
rx_length_errors: 0
rx_over_errors: 0
rx_frame_errors: 0
rx_fifo_errors: 7
tx_fifo_errors: 0
tx_heartbeat_errors: 0
tx_queue_0_packets: 338843508
tx_queue_0_bytes: 273129319833
tx_queue_0_restart: 0
rx_queue_0_packets: 181614339
rx_queue_0_bytes: 39429458273
rx_queue_0_drops: 0
rx_queue_0_csum_err: 0
rx_queue_0_alloc_failed: 0
[Expert@FW-OA-B:0]#

$FWDIR/log/fwd.elg
$FWDIR/log/cphaconf.elg
$FWDIR/log/cphamcset.elg            -----all no logs at that time
$FWDIR/log/cphastart.elg


Roman_Langolf
Participant

@Herschel_Liang 

Did you found the cause of the cluster failover?

We have almost the same problem right now.

0 Kudos
_Val_
Admin
Admin

@Roman_Langolf I helped you with English, just a bit.

Roman_Langolf
Participant

thx, I wasn't able edit it by my self 😄

0 Kudos
G_W_Albrecht
Legend
Legend

So did you contact TAC yet ? After some days, all logs are gone...

CCSE CCTE CCSM SMB Specialist
0 Kudos
Herschel_Liang
Collaborator

The client did not want to check the root cause of this issue, so let it gone ......  0.0

0 Kudos
Roman_Langolf
Participant

We have determined that this interface flapping was probably caused during the configuration of the switches.
Spanning tree negotiation occurs, which leads to time delay of packets on the switches. As a result, the keep-alives on the firewall do not arrive in time. As a result, the latency of the packets increases, exceeding the expected 0.100 ms and leading to the interface syptoms and cluster fail over.

0 Kudos

Leaderboard

Epsum factorial non deposit quid pro quo hic escorol.

Upcoming Events

    CheckMates Events