Create a Post
cancel
Showing results for 
Search instead for 
Did you mean: 
TomShanti
Collaborator

CPU load difference CPVIEW vs TOP on R80.30 kernel 3.1

Hi all,

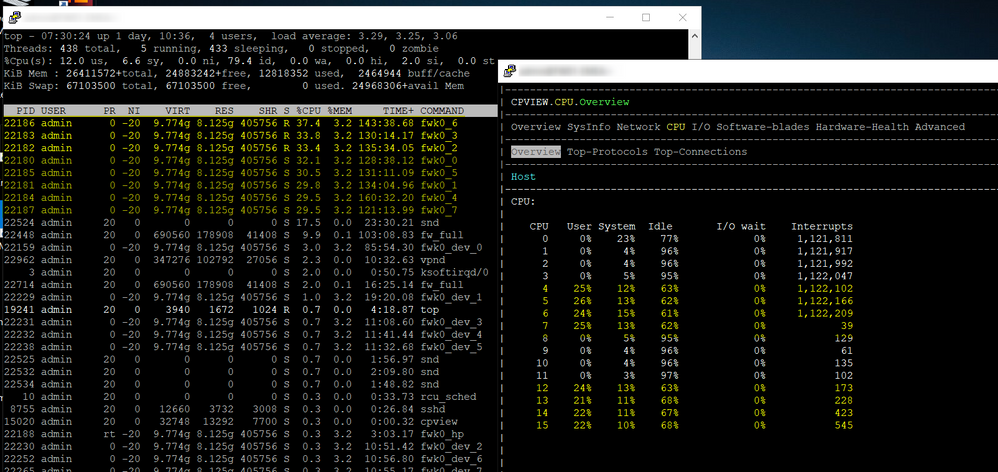
can anybody explain why I can see such a gap in the CPU loads between CPVIEW and TOP after we upgraded to R80.30 kernel 3.1 on our 16-core openserver ?

2020-04-27_08h20_37.png


This is the affinity setting:

eth7: CPU 0
fw_0: CPU 15
fw_1: CPU 7
fw_2: CPU 14
fw_3: CPU 6
fw_4: CPU 13
fw_5: CPU 5
fw_6: CPU 12
fw_7: CPU 4
mpdaemon: CPU 4 5 6 7 12 13 14 15
fwd: CPU 4 5 6 7 12 13 14 15
dtlsd: CPU 4 5 6 7 12 13 14 15
vpnd: CPU 4 5 6 7 12 13 14 15
in.asessiond: CPU 4 5 6 7 12 13 14 15
pepd: CPU 4 5 6 7 12 13 14 15
lpd: CPU 4 5 6 7 12 13 14 15
dtpsd: CPU 4 5 6 7 12 13 14 15
rtmd: CPU 4 5 6 7 12 13 14 15
pdpd: CPU 4 5 6 7 12 13 14 15
in.acapd: CPU 4 5 6 7 12 13 14 15
cprid: CPU 4 5 6 7 12 13 14 15
cpd: CPU 4 5 6 7 12 13 14 15
Interface eth4: has multi queue enabled
Interface eth5: has multi queue enabled
Interface eth6: has multi queue enabled
Interface eth10: has multi queue enabled
Interface eth11: has multi queue enabled
Interface eth12: has multi queue enabled
Interface eth13: has multi queue enabled
Interface eth8: has multi queue enabled
Interface eth9: has multi queue enabled

Thanks and regards

Thomas

0 Kudos
3 Replies
Danny
Champion Champion
Champion

How many CPU cores are licensed? Can you paste a screenshot of ccc as well?

What's this command showing?

sqlite3 -header CPViewDB.dat \
'select name_of_cpu, cpu_usage from UM_STAT_UM_CPU_UM_CPU_ORDERED_TABLE order by cpu_usage desc limit 10;'
Václav_Brožík
Collaborator

I am not sure what you see as wrong. In top you see the CPU usage averaged over all the cores (press 1 to see individual cores) while in cpview you see the usage of the individual CPU cores. I think that the values roughly correspond.

Timothy_Hall
Legend Legend
Legend

I'm unclear on exactly what you are asking, you have a 8/8 split on a 16 core box with SMT enabled.  Your question seems to be one of these three things:

1) Mapping of Physical CPUs to Firewall worker instances - Firewall instances 0 & 1 are on the same physical CPU 7/15 via SMT threads, Firewall instances 2 & 3 are on the same physical CPU 6/14 via SMT threads, Firewall instances 4 & 5 are on the same physical CPU 5/13 via SMT threads, Firewall instances 6 & 7 are on the same physical CPU 4/12 via SMT threads.  All eight remaining cores (0-3, 8-11) are SNDs with Multi-Queue enabled.  This looks correct but granted can be a bit confusing, USFW is also enabled.

2) Load difference between CPUs designated SND vs. Firewall Worker/Instance - I would speculate that the vast majority of your traffic is being handled in the Medium Path (either PXL or CPAS) which has to be handled by the workers.  This can be checked with fwaccel stats -s.  If the distribution of load amongst CPUs looked significantly different before the upgrade, it is possible that the upgrade changed the distribution of traffic such that significantly less traffic can be fully accelerated by SecureXL and handled on the SND cores.  If you upgraded from R80.10 or earlier, be advised that SecureXL was significantly overhauled in R80.20 and a split adjustment may be necessary; the gist of the changes is that the SNDs were relieved of multiple duties that were transferred to the workers thus increasing their load.

3) Higher load on CPU 0 (SND) vs. other SNDs - This may be related to Remote Access VPN connections not being properly balanced across the SNDs which was fixed in the latest Jumbo HFAs.

Or was your question something else?

Gateway Performance Optimization R81.20 Course
now available at maxpowerfirewalls.com
0 Kudos

Leaderboard

Epsum factorial non deposit quid pro quo hic escorol.

Upcoming Events

    CheckMates Events