Dear Team,
OS version: R81.10
I have collected data from the FW1.
[Expert@FW1:0]# cphaprob stat
HA module not started.
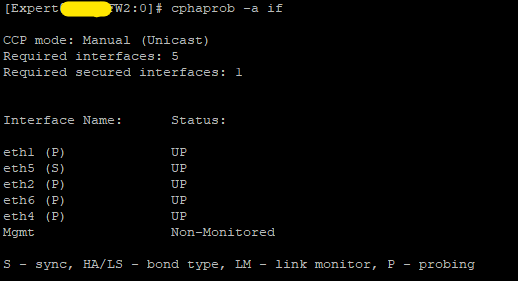
[Expert@FW1:0]# cphaprob -a if
HA module not started.
Warning: Sync will not function since there aren't any sync(secured) interfaces
[Expert@FW1:0]#
[Expert@FW1:0]# cphaprob -ia list
Built-in Devices:
Device Name: Problem Notification
Device Name: Interface Active Check
Device Name: HA Initialization
Device Name: Load Balancing Configuration
Device Name: Recovery Delay
Device Name: CoreXL Configuration
Registered Devices:
Device Name: Fullsync
Registration number: 0
Timeout: none
Device Name: Policy
Registration number: 1
Timeout: none
Device Name: routed
Registration number: 2
Timeout: none
[Expert@FW1:0]#
[Expert@FW1:0]# fw getifs
localhost eth1 172.18.0.28 255.255.255.0
localhost eth5 192.0.6.28 255.255.255.0
localhost eth2 11X.xxx.xxx.xxx 255.255.255.224
localhost eth6 10.0.6.131 255.255.255.248
localhost eth4 2xx.xxx.xxx.xxx 255.255.255.248
localhost Mgmt 10.0.0.1 255.255.255.0
[Expert@FW1:0]#
[Expert@FW1:0]# ifconfig -a
Mgmt Link encap:Ethernet HWaddr 00:1C:7F:C3:09:01
inet addr:10.0.0.1 Bcast:10.0.0.255 Mask:255.255.255.0
UP BROADCAST MULTICAST MTU:1500 Metric:1
RX packets:0 errors:0 dropped:0 overruns:0 frame:0
TX packets:0 errors:0 dropped:0 overruns:0 carrier:0
collisions:0 txqueuelen:1000
RX bytes:0 (0.0 b) TX bytes:0 (0.0 b)
Sync Link encap:Ethernet HWaddr 00:1C:7F:C3:09:00
BROADCAST MULTICAST MTU:1500 Metric:1
RX packets:0 errors:0 dropped:0 overruns:0 frame:0
TX packets:0 errors:0 dropped:0 overruns:0 carrier:0
collisions:0 txqueuelen:1000
RX bytes:0 (0.0 b) TX bytes:0 (0.0 b)
eth1 Link encap:Ethernet HWaddr 00:1C:7F:C3:08:F8
inet addr:172.18.0.28 Bcast:172.18.0.255 Mask:255.255.255.0
UP BROADCAST RUNNING MULTICAST MTU:1500 Metric:1
RX packets:1072819 errors:0 dropped:0 overruns:0 frame:0
TX packets:232533 errors:0 dropped:0 overruns:0 carrier:0
collisions:0 txqueuelen:1000
RX bytes:109122075 (104.0 MiB) TX bytes:9766386 (9.3 MiB)
eth1-01 Link encap:Ethernet HWaddr 00:1C:7F:A5:63:82
BROADCAST MULTICAST MTU:1500 Metric:1
RX packets:0 errors:0 dropped:0 overruns:0 frame:0
TX packets:0 errors:0 dropped:0 overruns:0 carrier:0
collisions:0 txqueuelen:1000
RX bytes:0 (0.0 b) TX bytes:0 (0.0 b)
eth1-02 Link encap:Ethernet HWaddr 00:1C:7F:A5:63:83
BROADCAST MULTICAST MTU:1500 Metric:1
RX packets:0 errors:0 dropped:0 overruns:0 frame:0
TX packets:0 errors:0 dropped:0 overruns:0 carrier:0
collisions:0 txqueuelen:1000
RX bytes:0 (0.0 b) TX bytes:0 (0.0 b)
eth1-03 Link encap:Ethernet HWaddr 00:1C:7F:A5:63:84
BROADCAST MULTICAST MTU:1500 Metric:1
RX packets:0 errors:0 dropped:0 overruns:0 frame:0
TX packets:0 errors:0 dropped:0 overruns:0 carrier:0
collisions:0 txqueuelen:1000
RX bytes:0 (0.0 b) TX bytes:0 (0.0 b)
eth1-04 Link encap:Ethernet HWaddr 00:1C:7F:A5:63:85
BROADCAST MULTICAST MTU:1500 Metric:1
RX packets:0 errors:0 dropped:0 overruns:0 frame:0
TX packets:0 errors:0 dropped:0 overruns:0 carrier:0
collisions:0 txqueuelen:1000
RX bytes:0 (0.0 b) TX bytes:0 (0.0 b)
eth2 Link encap:Ethernet HWaddr 00:1C:7F:C3:08:FA
inet addr:11x.xxx.xxx.xxx Bcast:11x.xxx.xxx.xxx Mask:255.255.255.224
UP BROADCAST RUNNING MULTICAST MTU:1500 Metric:1
RX packets:1037487 errors:0 dropped:0 overruns:0 frame:0
TX packets:467079 errors:0 dropped:0 overruns:0 carrier:0
collisions:0 txqueuelen:1000
RX bytes:397068804 (378.6 MiB) TX bytes:26577937 (25.3 MiB)
eth3 Link encap:Ethernet HWaddr 00:1C:7F:C3:08:FC
BROADCAST MULTICAST MTU:1500 Metric:1
RX packets:0 errors:0 dropped:0 overruns:0 frame:0
TX packets:0 errors:0 dropped:0 overruns:0 carrier:0
collisions:0 txqueuelen:1000
RX bytes:0 (0.0 b) TX bytes:0 (0.0 b)
eth4 Link encap:Ethernet HWaddr 00:1C:7F:C3:08:FE
inet addr:2xx.xxx.xxx.xxx Bcast:2xx.xxx.xxx.xxx Mask:255.255.255.2
UP BROADCAST RUNNING MULTICAST MTU:1500 Metric:1
RX packets:1158342 errors:0 dropped:0 overruns:0 frame:0
TX packets:516229 errors:0 dropped:0 overruns:0 carrier:0
collisions:0 txqueuelen:1000
RX bytes:1012674450 (965.7 MiB) TX bytes:33042024 (31.5 MiB)
eth5 Link encap:Ethernet HWaddr 00:1C:7F:C3:08:F9
inet addr:192.0.6.28 Bcast:192.0.6.255 Mask:255.255.255.0
UP BROADCAST RUNNING MULTICAST MTU:1500 Metric:1
RX packets:2303671 errors:0 dropped:0 overruns:0 frame:0
TX packets:232591 errors:0 dropped:0 overruns:0 carrier:0
collisions:0 txqueuelen:1000
RX bytes:568528896 (542.1 MiB) TX bytes:9768822 (9.3 MiB)
eth6 Link encap:Ethernet HWaddr 00:1C:7F:C3:08:FB
inet addr:10.0.6.131 Bcast:10.0.6.135 Mask:255.255.255.248
UP BROADCAST RUNNING MULTICAST MTU:1500 Metric:1
RX packets:520534 errors:0 dropped:0 overruns:0 frame:0
TX packets:239047 errors:0 dropped:0 overruns:0 carrier:0
collisions:0 txqueuelen:1000
RX bytes:47349266 (45.1 MiB) TX bytes:10783374 (10.2 MiB)
eth7 Link encap:Ethernet HWaddr 00:1C:7F:C3:08:FD
BROADCAST MULTICAST MTU:1500 Metric:1
RX packets:0 errors:0 dropped:0 overruns:0 frame:0
TX packets:0 errors:0 dropped:0 overruns:0 carrier:0
collisions:0 txqueuelen:1000
RX bytes:0 (0.0 b) TX bytes:0 (0.0 b)
eth8 Link encap:Ethernet HWaddr 00:1C:7F:C3:08:FF
BROADCAST MULTICAST MTU:1500 Metric:1
RX packets:0 errors:0 dropped:0 overruns:0 frame:0
TX packets:0 errors:0 dropped:0 overruns:0 carrier:0
collisions:0 txqueuelen:1000
RX bytes:0 (0.0 b) TX bytes:0 (0.0 b)
gretap0 Link encap:Ethernet HWaddr 00:00:00:00:00:00
BROADCAST MULTICAST MTU:1462 Metric:1
RX packets:0 errors:0 dropped:0 overruns:0 frame:0
TX packets:0 errors:0 dropped:0 overruns:0 carrier:0
collisions:0 txqueuelen:1000
RX bytes:0 (0.0 b) TX bytes:0 (0.0 b)
gre0 Link encap:UNSPEC HWaddr 00-00-00-00-61-F7-38-30-00-00-00-00-00-00-
NOARP MTU:1476 Metric:1
RX packets:0 errors:0 dropped:0 overruns:0 frame:0
TX packets:0 errors:0 dropped:0 overruns:0 carrier:0
collisions:0 txqueuelen:1000
RX bytes:0 (0.0 b) TX bytes:0 (0.0 b)
lo Link encap:Local Loopback
inet addr:127.0.0.1 Mask:255.0.0.0
UP LOOPBACK RUNNING PROMISC MTU:65536 Metric:1
RX packets:1166900 errors:0 dropped:0 overruns:0 frame:0
TX packets:1166900 errors:0 dropped:0 overruns:0 carrier:0
collisions:0 txqueuelen:1000
RX bytes:85221752 (81.2 MiB) TX bytes:85221752 (81.2 MiB)
[Expert@FW1:0]#
[Expert@FW1:0]# fw stat
HOST POLICY DATE
localhost defaultfilter 11May2025 9:23:57 : [>eth1] [>eth5] [>eth2] [<eth2]
[Expert@FW1:0]#
[Expert@FW1:0]# more /var/log/messages.1 | grep probing
May 11 07:22:49 2025 FW1 kernel: ide_generic: please use "probe_mask=0x3f"
May 11 07:22:49 2025 FW1 kernel: ipmi_si dmi-ipmi-si.0: ipmi_platform: prob
May 11 07:22:49 2025 FW1 kernel: ipmi_si IPI0001:00: ipmi_platform: probing
May 11 07:22:49 2025 FW1 kernel: ipmi_si hardcode-ipmi-si.0: ipmi_platform:
May 11 07:22:49 2025 FW1 kernel: ipmi_platform: probing via SPMI
May 11 09:20:55 2025 FW1 kernel: ide_generic: please use "probe_mask=0x3f"
May 11 09:20:55 2025 FW1 kernel: ipmi_si dmi-ipmi-si.0: ipmi_platform: prob
May 11 09:20:55 2025 FW1 kernel: ipmi_si IPI0001:00: ipmi_platform: probing
May 11 09:20:55 2025 FW1 kernel: ipmi_si hardcode-ipmi-si.0: ipmi_platform:
May 11 09:20:55 2025 FW1 kernel: ipmi_platform: probing via SPMI
May 11 09:23:40 2025 localhost kernel: ide_generic: please use "probe_mask=0x3f"
May 11 09:23:40 2025 localhost kernel: ipmi_si dmi-ipmi-si.0: ipmi_platform: pro
May 11 09:23:40 2025 localhost kernel: ipmi_si IPI0001:00: ipmi_platform: probin
May 11 09:23:40 2025 localhost kernel: ipmi_si hardcode-ipmi-si.0: ipmi_platform
May 11 09:23:40 2025 localhost kernel: ipmi_platform: probing via SPMI
[Expert@FW1:0]#
[Expert@FW1:0]# more /var/log/messages.1 | grep eth5
May 11 06:09:12 2025 FW1 kernel: igb 0000:04:00.0 eth5: igb: eth5 NIC Link
May 11 06:09:15 2025 FW1 kernel: igb 0000:04:00.0 eth5: igb: eth5 NIC Link
May 11 06:10:03 2025 FW1 kernel: igb: eth5: igb_set_rss_hash_opt: enabling
May 11 06:10:07 2025 FW1 kernel: igb 0000:04:00.0 eth5: igb: eth5 NIC Link
May 11 07:22:49 2025 FW1 kernel: igb 0000:04:00.0: added PHC on eth5
May 11 07:22:49 2025 FW1 kernel: igb 0000:04:00.0: eth5: (PCIe:2.5GT/s:Widt
May 11 07:22:49 2025 FW1 kernel: igb 0000:04:00.0 eth5: MAC: 00:1c:7f:c3:08
May 11 07:22:49 2025 FW1 kernel: igb 0000:04:00.0: eth5: PBA No: Unknown
May 11 07:22:51 2025 FW1 kernel: 8021q: adding VLAN 0 to HW filter on devic
May 11 07:22:54 2025 FW1 kernel: igb 0000:04:00.0 eth5: igb: eth5 NIC Link
May 11 07:22:54 2025 FW1 dhcpd: No subnet declaration for eth5 (192.0.6.28)
May 11 07:22:54 2025 FW1 dhcpd: ** Ignoring requests on eth5. If this is n
May 11 07:22:54 2025 FW1 dhcpd: to which interface eth5 is attached. **
May 11 07:22:54 2025 FW1 ntpd[28629]: Listen normally on 3 eth5 192.0.6.28
May 11 07:24:53 2025 FW1 kernel: igb 0000:04:00.0 eth5: igb: eth5 NIC Link
May 11 07:24:56 2025 FW1 kernel: igb 0000:04:00.0 eth5: igb: eth5 NIC Link
May 11 07:25:46 2025 FW1 kernel: igb: eth5: igb_set_rss_hash_opt: enabling
May 11 07:25:49 2025 FW1 kernel: igb 0000:04:00.0 eth5: igb: eth5 NIC Link
May 11 09:20:55 2025 FW1 kernel: igb 0000:04:00.0: added PHC on eth5
May 11 09:20:55 2025 FW1 kernel: igb 0000:04:00.0: eth5: (PCIe:2.5GT/s:Widt
May 11 09:20:55 2025 FW1 kernel: igb 0000:04:00.0 eth5: MAC: 00:1c:7f:c3:08
May 11 09:20:55 2025 FW1 kernel: igb 0000:04:00.0: eth5: PBA No: Unknown
May 11 09:20:56 2025 FW1 kernel: 8021q: adding VLAN 0 to HW filter on devic
May 11 09:20:59 2025 FW1 kernel: igb 0000:04:00.0 eth5: igb: eth5 NIC Link
May 11 09:21:00 2025 FW1 dhcpd: No subnet declaration for eth5 (192.0.6.28)
May 11 09:21:00 2025 FW1 dhcpd: ** Ignoring requests on eth5. If this is n
May 11 09:21:00 2025 FW1 dhcpd: to which interface eth5 is attached. **
May 11 09:21:00 2025 FW1 ntpd[28457]: Listen normally on 3 eth5 192.0.6.28
May 11 09:23:40 2025 localhost kernel: igb 0000:04:00.0: added PHC on eth5
May 11 09:23:40 2025 localhost kernel: igb 0000:04:00.0: eth5: (PCIe:2.5GT/s:Wid
May 11 09:23:40 2025 localhost kernel: igb 0000:04:00.0 eth5: MAC: 00:1c:7f:c3:0
May 11 09:23:40 2025 localhost kernel: igb 0000:04:00.0: eth5: PBA No: Unknown
May 11 09:23:42 2025 localhost kernel: 8021q: adding VLAN 0 to HW filter on devi
May 11 09:23:45 2025 FW1 kernel: igb 0000:04:00.0 eth5: igb: eth5 NIC Link
May 11 09:23:45 2025 FW1 dhcpd: No subnet declaration for eth5 (192.0.6.28)
May 11 09:23:45 2025 FW1 dhcpd: ** Ignoring requests on eth5. If this is n
May 11 09:23:45 2025 FW1 dhcpd: to which interface eth5 is attached. **
May 11 09:23:45 2025 FW1 ntpd[28730]: Listen normally on 3 eth5 192.0.6.28
May 11 09:25:46 2025 FW1 kernel: igb 0000:04:00.0 eth5: igb: eth5 NIC Link
May 11 09:25:49 2025 FW1 kernel: igb 0000:04:00.0 eth5: igb: eth5 NIC Link
May 11 09:26:37 2025 FW1 kernel: igb: eth5: igb_set_rss_hash_opt: enabling
May 11 09:26:41 2025 FW1 kernel: igb 0000:04:00.0 eth5: igb: eth5 NIC Link
[Expert@FW1:0]#
[Expert@FW1:0]# more /var/log/messages.2 | grep eth5
May 10 16:06:54 2025 FW1 kernel: igb 0000:04:00.0: added PHC on eth5
May 10 16:06:54 2025 FW1 kernel: igb 0000:04:00.0: eth5: (PCIe:2.5GT/s:Widt
May 10 16:06:54 2025 FW1 kernel: igb 0000:04:00.0 eth5: MAC: 00:1c:7f:c3:08
May 10 16:06:54 2025 FW1 kernel: igb 0000:04:00.0: eth5: PBA No: Unknown
May 10 16:06:56 2025 FW1 kernel: 8021q: adding VLAN 0 to HW filter on devic
May 10 16:06:59 2025 FW1 kernel: igb 0000:04:00.0 eth5: igb: eth5 NIC Link
May 10 16:06:59 2025 FW1 dhcpd: No subnet declaration for eth5 (192.0.6.28)
May 10 16:06:59 2025 FW1 dhcpd: ** Ignoring requests on eth5. If this is n
May 10 16:06:59 2025 FW1 dhcpd: to which interface eth5 is attached. **
May 10 16:06:59 2025 FW1 ntpd[28388]: Listen normally on 3 eth5 192.0.6.28
May 10 16:08:59 2025 FW1 kernel: igb 0000:04:00.0 eth5: igb: eth5 NIC Link
May 10 16:09:02 2025 FW1 kernel: igb 0000:04:00.0 eth5: igb: eth5 NIC Link
May 10 16:09:51 2025 FW1 kernel: igb: eth5: igb_set_rss_hash_opt: enabling
May 10 16:09:54 2025 FW1 kernel: igb 0000:04:00.0 eth5: igb: eth5 NIC Link
May 11 05:06:00 2025 FW1 kernel: igb 0000:04:00.0: added PHC on eth5
May 11 05:06:00 2025 FW1 kernel: igb 0000:04:00.0: eth5: (PCIe:2.5GT/s:Widt
May 11 05:06:00 2025 FW1 kernel: igb 0000:04:00.0 eth5: MAC: 00:1c:7f:c3:08
May 11 05:06:00 2025 FW1 kernel: igb 0000:04:00.0: eth5: PBA No: Unknown
May 11 05:06:02 2025 FW1 kernel: 8021q: adding VLAN 0 to HW filter on devic
May 11 05:06:05 2025 FW1 kernel: igb 0000:04:00.0 eth5: igb: eth5 NIC Link
May 11 05:06:05 2025 FW1 dhcpd: No subnet declaration for eth5 (192.0.6.28)
May 11 05:06:05 2025 FW1 dhcpd: ** Ignoring requests on eth5. If this is n
May 11 05:06:05 2025 FW1 dhcpd: to which interface eth5 is attached. **
May 11 05:06:05 2025 FW1 ntpd[28992]: Listen normally on 3 eth5 192.0.6.28
May 11 05:08:06 2025 FW1 kernel: igb 0000:04:00.0 eth5: igb: eth5 NIC Link
May 11 05:08:09 2025 FW1 kernel: igb 0000:04:00.0 eth5: igb: eth5 NIC Link
May 11 05:08:57 2025 FW1 kernel: igb: eth5: igb_set_rss_hash_opt: enabling
May 11 05:09:00 2025 FW1 kernel: igb 0000:04:00.0 eth5: igb: eth5 NIC Link
May 11 06:07:07 2025 FW1 kernel: igb 0000:04:00.0: added PHC on eth5
May 11 06:07:07 2025 FW1 kernel: igb 0000:04:00.0: eth5: (PCIe:2.5GT/s:Widt
May 11 06:07:07 2025 FW1 kernel: igb 0000:04:00.0 eth5: MAC: 00:1c:7f:c3:08
May 11 06:07:07 2025 FW1 kernel: igb 0000:04:00.0: eth5: PBA No: Unknown
May 11 06:07:08 2025 FW1 kernel: 8021q: adding VLAN 0 to HW filter on devic
May 11 06:07:11 2025 FW1 kernel: igb 0000:04:00.0 eth5: igb: eth5 NIC Link
May 11 06:07:11 2025 FW1 dhcpd: No subnet declaration for eth5 (192.0.6.28)
May 11 06:07:11 2025 FW1 dhcpd: ** Ignoring requests on eth5. If this is n
May 11 06:07:11 2025 FW1 dhcpd: to which interface eth5 is attached. **
May 11 06:07:11 2025 FW1 ntpd[28926]: Listen normally on 3 eth5 192.0.6.28
[Expert@FW1:0]# more /var/log/messages.1 | grep down
May 11 06:15:17 2025 FW1 xpand[28924]: admin localhost t +installer:availab
May 11 06:16:11 2025 FW1 xpand[28924]: admin localhost t +installer:availab
May 11 07:31:00 2025 FW1 xpand[28627]: admin localhost t +installer:availab
May 11 07:31:55 2025 FW1 xpand[28627]: admin localhost t +installer:availab
May 11 09:31:51 2025 FW1 xpand[28728]: admin localhost t +installer:availab
May 11 09:32:46 2025 FW1 xpand[28728]: admin localhost t +installer:availab
- In FW1 all daemons are up&running properly.
- During the Policy installation, the FW1 is state is missing and defaultfilter policy and FW2 went into "Active Mode".
Please assist me
Regards,
Saranya
