





What’s New in Agentic Network Orchestration
21 October @ 5pm CET / 11am EDT
AI Security Masters
LGTM: Bypassing an LLM Build Gate
When Prompt Injection Fails
Scaling Check Point Automation with Arodonata
CheckMates Go:
Fun Ding


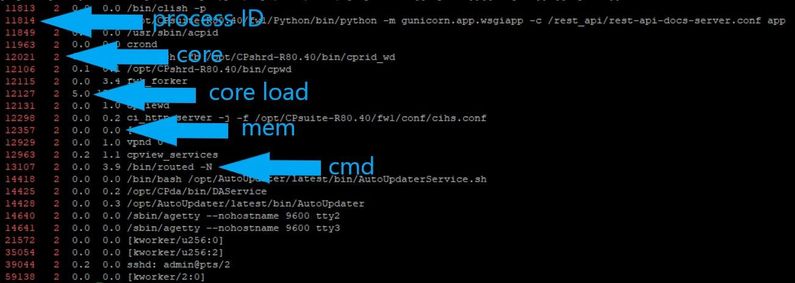
With this onliner you can view the process load of each core.
Change the variable CORE to the correct core number (for example CORE=3):
CORE=3; ps --sort=-c -e -o pid,psr,%cpu,%mem,cmd | grep -E "^[[:space:]][[:digit:]]+[[:space:]]+${CORE}"
ps L -> List all format specifiers (for example pid, psr, %cpu, %mem, ...)
There is still much potential for improvement here 🙂
With this onliner you can view the process load of each core.
Change the variable CORE to the correct core number (for example CORE=3):
CORE=3; ps --sort=-c -e -o pid,psr,%cpu,%mem,cmd | grep -E "^[[:space:]][[:digit:]]+[[:space:]]+${CORE}"
ps L -> List all format specifiers (for example pid, psr, %cpu, %mem, ...)
There is still much potential for improvement here 🙂
;
I always use this one:
watch -n 1 'CORE=2; ps --sort=-c -e -o pid,psr,%cpu,%mem,wchan,vsize,time,cmd | grep -E "^[[:space:]][[:digit:]]+[[:space:]]+${CORE}"'
> Refresh display every second
> For core two (set CORE=x parameter)
> Is sorted by CPU load
> The following fields are used:
- Process ID
- Core
- CPU utilization in %
- Memory utilization in %
- Process type
- Process memory usage in KB
- Process time
- Process path+command
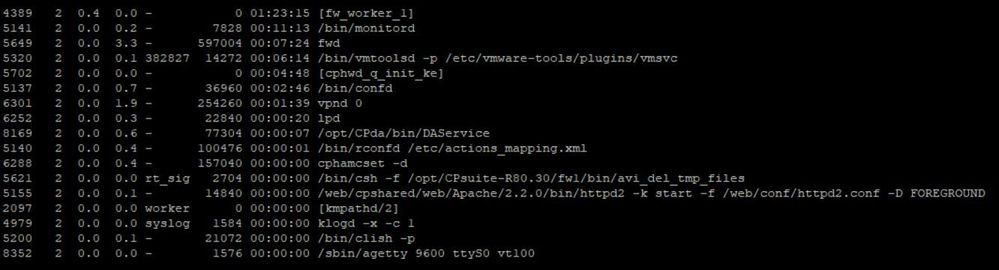
Output:
If you want to sort it by memory usage, use this:
watch -n 1 'CORE=2; ps --sort=-vsize -e -o pid,psr,%cpu,%mem,wchan,vsize,time,cmd | grep -E "^[[:space:]][[:digit:]]+[[:space:]]+${CORE}"'
I always use this one:
watch -n 1 'CORE=2; ps --sort=-c -e -o pid,psr,%cpu,%mem,wchan,vsize,time,cmd | grep -E "^[[:space:]][[:digit:]]+[[:space:]]+${CORE}"'
> Refresh display every second
> For core two (set CORE=x parameter)
> Is sorted by CPU load
> The following fields are used:
- Process ID
- Core
- CPU utilization in %
- Memory utilization in %
- Process type
- Process memory usage in KB
- Process time
- Process path+command
Output:
If you want
I always use this one:
watch -n 1 'CORE=2; ps --sort=-c -e -o pid,psr,%cpu,%mem,wchan,vsize,time,cmd | grep -E "^[[:space:]][[:digit:]]+[[:space:]]+${CORE}"'
> Refresh display every second
> For core two (set CORE=x parameter)
> Is sorted by CPU load
> The following fields are used:
- Process ID
- Core
- CPU utilization in %
- Memory utilization in %
- Process type
- Process memory usage in KB
- Process time
- Process path+command
Output:
If you want to sort it by memory usage, use this:
watch -n 1 'CORE=2; ps --sort=-vsize -e -o pid,psr,%cpu,%mem,wchan,vsize,time,cmd | grep -E "^[[:space:]][[:digit:]]+[[:space:]]+${CORE}"'
I always use this one:
watch -n 1 'CORE=2; ps --sort=-c -e -o pid,psr,%cpu,%mem,wchan,vsize,time,cmd | grep -E "^[[:space:]][[:digit:]]+[[:space:]]+${CORE}"'
> Refresh display every second
> For core two (set CORE=x parameter)
> Is sorted by CPU load
> The following fields are used:
- Process ID
- Core
- CPU utilization in %
- Memory utilization in %
- Process type
- Process memory usage in KB
- Process time
- Process path+command
Output:
If you want

 KernelGordon
Really like this one-liner, made a small change to have it run over all cores and sort by CPU usage or Memory usage:
Sort by CPU:
echo "" > coreload.txt ; for (( cpuCore = 0; cpuCore < $(cpstat os -f cpu | grep Number: | awk '{print $3}'); ++cpuCore )); do CORE=${cpuCore}; ps -e -o pid,psr,%cpu,%mem,cmd | grep -E "^[[:space:]][[:digit:]]+[[:space:]]+${CORE}" >> coreload.txt; done ; cat coreload.txt | sort -k3 -grSort by Memory:
echo "" > coreload.txt ; for (( cpuCore = 0; cpuCore < $(cpstat os -f cpu | grep Number: | awk '{print $3}'); ++cpuCore )); do CORE=${cpuCore}; ps -e -o pid,psr,%cpu,%mem,cmd | grep -E "^[[:space:]][[:digit:]]+[[:space:]]+${CORE}" >> coreload.txt; done ; cat coreload.txt | sort -k4 -grReally like this one-liner, made a small change to have it run over all cores and sort by CPU usage or Memory usage:
Sort by CPU:
echo "" > coreload.txt ; for (( cpuCore = 0; cpuCore < $(cpstat os -f cpu | grep Number: | awk '{print $3}'); ++cpuCore )); do CORE=${cpuCore}; ps -e -o pid,psr,%cpu,%mem,cmd | grep -E "^[[:space:]][[:digit:]]+[[:space:]]+${CORE}" >> coreload.txt; done ; cat coreload.txt | sort -k3 -gr
Sort by Memory:
echo "" > coreload.txt ; for (( cpuCore = 0; Hi @KernelGordon,
You can use this! It is quick and easy:
ps --sort=-c -e -o pid,psr,%cpu,%mem,wchan,vsize,time,cmdps --sort=-vsize -e -o pid,psr,%cpu,%mem,wchan,vsize,time,cmdYou can sort directly into ps with "--sort". If you use a "--sort=-" it will sort in reverse order 🙂
Hi @KernelGordon,
You can use this! It is quick and easy:
ps --sort=-c -e -o pid,psr,%cpu,%mem,wchan,vsize,time,cmd
ps --sort=-vsize -e -o pid,psr,%cpu,%mem,wchan,vsize,time,cmd
You can sort directly into ps with "--sort". If you use a "--sort=-" it will sort in reverse order 🙂
;
Or just to monitor the firewall workers
watch -n 1 'ps --sort=-c -e -o pid,psr,%cpu,%mem,wchan,time,cmd |grep "fw_worker_"|grep -v pipe|grep -v grep '
Output:
KernelGordon
Nice find! I wasn't aware of the 'psr' format specifier. Time to read the man page and see if there are any other neat things to add to this 😀

About CheckMates
Learn Check Point
Advanced Learning

YOU DESERVE THE BEST SECURITY