Create a Post
cancel
Showing results for 
Search instead for 
Did you mean: 
IDoCare2022
Participant

Troubleshooting Skyline

Hi all, 

I have finally found the solution for the issue I was having setting up Prometheus, the issue reported in my previous topic. Now all seems to be running fine. My Skyline server runs Prometheus, and Grafana, everything seems to have full connectivitiy to eachother. 

So I decided to add a Check Point r81.10 all-in-one deployment, management+ FW. So it's a non-distributed setup ( updated to the latest take HFA 87,  using a full trial license ).

I have tried executing the last step from the guidlines , step called "5. Setup Check Point Firewall open telemery (Change name)".

I went to the AIO r81.10 server, I have created a payload-no-tls.json config file according to the example, adapted it only for my own Skyline/prometeus-target-ip ( 192.168.111.104 ), put it in /home/admin/ and I have started the service using the command below as per SK. 

"

/opt/CPotelcol/REST.py --set_open_telemetry "$(cat payload-no-tls.json)"

"

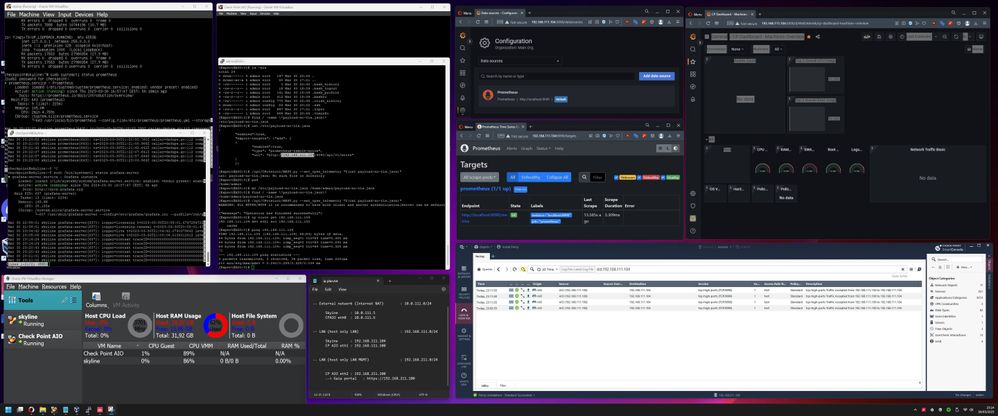
As you will see on the sreenshot, both Grafana and Premeteus claim to be running on my Skyline server...

But no data arrives clicking either one of the imported Grafana dashboards templates. On my r81.10 AIO server's logging ( where I have a FW with basically an ANY ANY ANY allow rule ), I can see my r81.10 AIO server is connecting to my Skyline server on port 9090 )

Any advice on how to start troubleshooting this ? 

for example :

- tcpdump my skyline and check if indeed data is being sent ?

- check with ps -ef if indeed all is running and check listening ports

I hope it's readable because I have tried putting most relevant info on 1 ultrawide screen 😁

Any advice please ? 

( Because 1 picture says more than a 1000 words, here's my lab setup on my home PC in virutalbox )
Screenshot 2023-03-30 231716-big.jpg


0 Kudos
6 Replies
PhoneBoy
Admin
Admin

@Arik_Ovtracht can you have someone weigh in on this?

0 Kudos
Elad_Chomsky
Employee
Employee

Hi @IDoCare2022

We have a dedicated SK for troubleshooting, which you can use to assist you on the investigation.
I would try to do the following:

- Check the Skyline Components logs:

  • /opt/CPotelcol/otelcol.log
  • /opt/CPviewExporter/otlp_cpview.log

The error should be very descriptive and should give you a hint on the issue. ( See the full section 'There is no data on the Grafana Dashboard' in the troubleshooting SK ). You can also see if any component is down by running 'cpwd_admin list' or 'ps -auxf | grep otelcol', and restart it using the 'stop/start' commands.

- Try to look into blocks by policy, by either inspecting TCP dump for port 9090 with your Prometheus host address. Or look for the logs in the SmartConsole, to see if any drops have occurred.

- Inspect the Prometheus Graph tool, see the SK for a more detailed guide.

If this does not help, feel free to contact us at ariko@checkpoint.com or eladch@checkpoint.com and we can try further assist you to investigate the issue.

0 Kudos
andreicrb
Explorer

Hello,

Related to troubleshooting the skyline deployment I also have an issue, for two of my security gateways I have this in the /opt/CPviewExporter/otlp_cpview.log:
ts=2023-04-27T14:39:39.542Z caller=main.go:324 level=error invalidcharacter'}'afterdecimalpointinnumericliteral=(MISSING)
ts=2023-04-27T14:39:55.643Z caller=main.go:324 level=error invalidcharacter'}'afterdecimalpointinnumericliteral=(MISSING)
ts=2023-04-27T14:40:11.767Z caller=main.go:324 level=error invalidcharacter'}'afterdecimalpointinnumericliteral=(MISSING)
ts=2023-04-27T14:40:27.882Z caller=main.go:324 level=error invalidcharacter'}'afterdecimalpointinnumericliteral=(MISSING)
ts=2023-04-27T14:40:43.968Z caller=main.go:324 level=error invalidcharacter'}'afterdecimalpointinnumericliteral=(MISSING)

for the other this:

ts=2023-04-27T14:48:04.578Z caller=main.go:324 level=error unexpectedendofJSONinput=(MISSING)
ts=2023-04-27T14:48:21.916Z caller=main.go:324 level=error unexpectedendofJSONinput=(MISSING)
ts=2023-04-27T14:48:39.230Z caller=main.go:324 level=error unexpectedendofJSONinput=(MISSING)
ts=2023-04-27T14:48:56.583Z caller=main.go:324 level=error unexpectedendofJSONinput=(MISSING)

What should I do to correct this issues?

Thank you!

0 Kudos
Elad_Chomsky
Employee
Employee

Hi @andreicrb ,

This seems like the issue described in sk180748. Please review the SK.

0 Kudos
andreicrb
Explorer

Hello,

One more issue with skyline, in the /opt/CPviewExporter/otlp_cpview.log there is this line:

2024/04/25 13:51:58 max retry time elapsed: rpc error: code = Unavailable desc = connection error: desc = "transport: Error while dialing dial unix /opt/CPotelcol/grpc_otlp.sock: connect: connect
ion refused"

The command sklnctl --show_open_telemetry, gives this instead of the configuration in json format:


panic: interface conversion: interface {} is nil, not string

goroutine 1 [running]:
checkpoint.com/otlp/sklnctl/commands.(*ExportTarget).Populate(0xc00014bb40, {0xc000218020, 0xa}, 0x0?)
/local_ckp/src/skyline_configuration_tools/otlp_GA/release.static/commands/showopentelemetry.go:154 +0x146
checkpoint.com/otlp/sklnctl/commands.PopulateExportTargets()
/local_ckp/src/skyline_configuration_tools/otlp_GA/release.static/commands/showopentelemetry.go:167 +0x1cb
checkpoint.com/otlp/sklnctl/commands.ShowOpenTelemetry()
/local_ckp/src/skyline_configuration_tools/otlp_GA/release.static/commands/showopentelemetry.go:174 +0x1d
checkpoint.com/otlp/sklnctl/commands.glob..func1(0xa15e80?, {0x77c737?, 0x1?, 0x1?})
/local_ckp/src/skyline_configuration_tools/otlp_GA/release.static/commands/commands.go:27 +0x6a
github.com/spf13/cobra.(*Command).execute(0xa15e80, {0xc000014050, 0x1, 0x1})
/ckp/builder/go/pkg/mod/github.com/spf13/cobra@v1.8.0/command.go:983 +0xaaa
github.com/spf13/cobra.(*Command).ExecuteC(0xa15e80)
/ckp/builder/go/pkg/mod/github.com/spf13/cobra@v1.8.0/command.go:1115 +0x425
github.com/spf13/cobra.(*Command).Execute(...)
/ckp/builder/go/pkg/mod/github.com/spf13/cobra@v1.8.0/command.go:1039
checkpoint.com/otlp/sklnctl/commands.Execute()
/local_ckp/src/skyline_configuration_tools/otlp_GA/release.static/commands/commands.go:345 +0x25
main.main()
/local_ckp/src/skyline_configuration_tools/otlp_GA/release.static/main.go:8 +0x17

Tried to stop and restart both otelcol and cpview_exporter processes with the same result.

What is there to be done in order to have the metrics sent to prometheus server?

Thank you!

0 Kudos
Elad_Chomsky
Employee
Employee

Hi @andreicrb ,

Try to see if restarting the otlp_cpview resolves the issue, 

/opt/CPviewExporter/CPviewExporterCli.sh stop/start

if not please open a support ticket to CheckPoint, so we can try to assist you directly. 

0 Kudos
Upcoming Events

    CheckMates Events