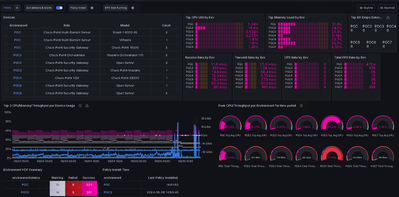
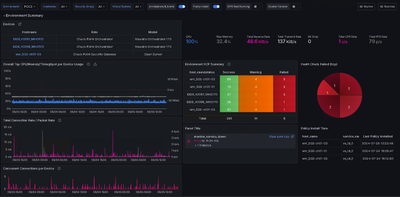
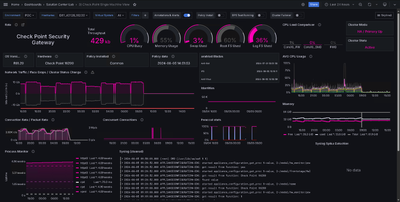
VSX and Maestro still need a bit of work on these dashboards. However, I wanted to share what we have created thus far with skyline and open telemetry with the Quantum Force Gateways. More to come.
These are the Dashboards I have been using in the Check Point POC lab. Recently I have expanded the dashboards to provide a complete Lab Overview, POC Environment Overview, and Single gateway/virtual system statistics.
The Environment parameter comes from the gateway. By default if you do not provide --set-env it will be Default.

I have integrated HCP (sk171436) with Prometheus, using a simple script to parse the hcp report json and send it over for parsing in grafana. Then hcp -r all &> /dev/null is added to cron to run nightly.

In the single machine view, I have integrated syslog-ng with loki providing ways to parse and display syslog details.
I have also added a view for fwaccel statistics from a custom script parsing the output of fwaccel stats -s on the gateway.

Tested with R81.10 JHF 135 and R81.20 JHF65
sklnctl version: 1.0.2
cpview exporter take: 34
cpotelcol take 97
otlpagent take: 26
I don't believe the documentation for the custom skyline metrics are available yet for publication. They are coming soon.
performance note: skyline will monitor the custom scripts that are run for high cpu and long run time. Under heavy load the fwaccel script may take too long to return results, skyline will disable the script.
/opt/CPotlpAgent/otlp_agent_diagnostics_error.csv and otlp_agent.log are good places to look if your script isn't running.
If you use these dashboards or parts of it. Please let us know.


